The bi-annual CNCF survey takes a pulse of the community to better understand the adoption of cloud native technologies. This is the second time CNCF has conducted its cloud native survey in Mandarin to better gauge how Asian companies are adopting open source and cloud native technologies. The previous Mandarin survey was published in March 2018. This post also makes comparisons to the most recent North American / European version of this survey from August 2018.
Key takeaways
- Usage of public and private clouds in Asia has grown 135% since March 2018, while on-premise has dropped 48%.
- Usage of nearly all container management tools in Asia has grown, with commercial off-the-shelf solutions up 58% overall, and home-grown solutions up 690%. Kubernetes has grown 11%.
- The number of Kubernetes clusters in production is increasing. Organizations in Asia running 1-5 production clusters decreased 37%, while respondents running 11-50 clusters increased 154%.
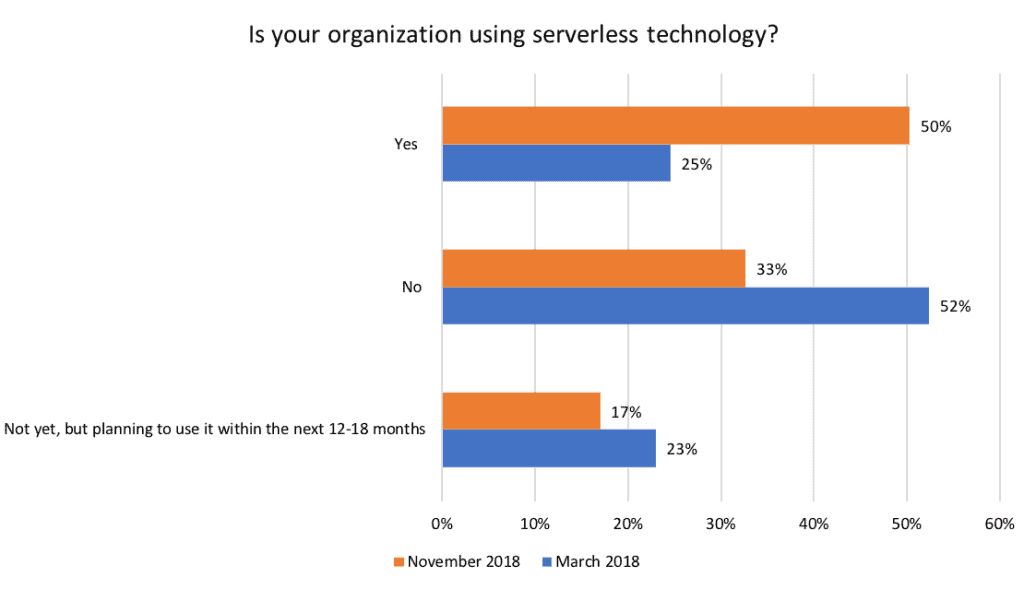
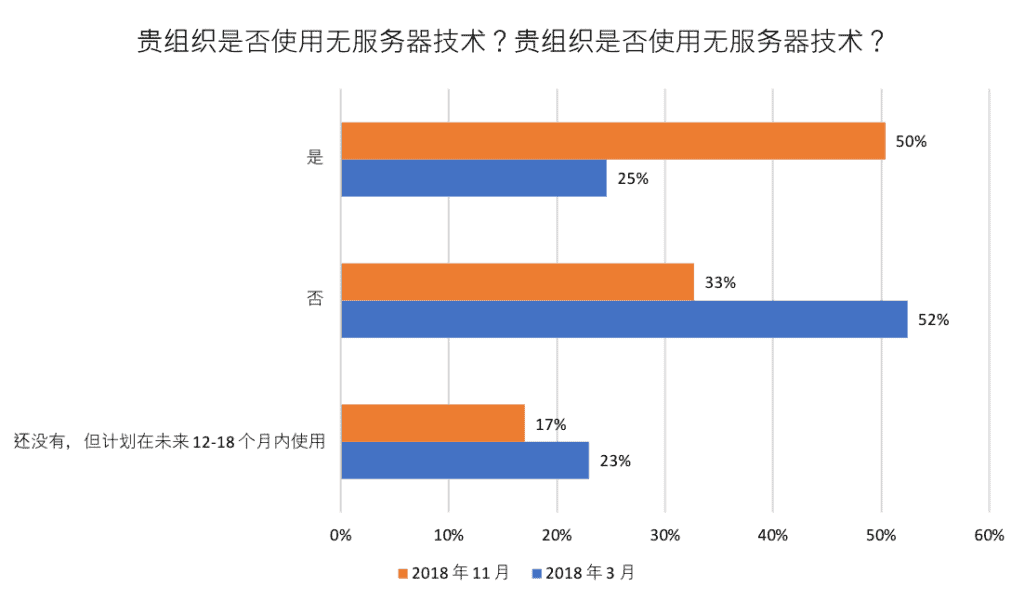
- Use of serverless technology in Asia has spiked 100% with 29% of respondents using installable software and 21% using a hosted platform.
300 people responded to the Chinese version with 83% being from Asia, compared to 187 respondents from our March 2018 survey.
CNCF has a total of 42 members across China, Japan, and South Korea including 4 platinum members: Alibaba Cloud, Fujitsu, Huawei, and JD.com. A number of these members are also end users, including:
- JD.com, the first Chinese Internet company to make the Global Fortune 500 list, moved from OpenStack to Kubernetes to increase resource utilization by 30%.
- Huawei, the largest telecommunications equipment manufacturer in the world, cut 20-30 percent of their operating expenses moving to cloud native.
- Yahoo Japan, one of the world’s most innovative companies of 2018 according to Forbes, automated their production deployment with Kubernetes.
- China Mobile, one of the largest carries in China, uses containers to replace VMs to run various applications on their platform and leverages Kubernetes to increase resource utilization.
Growth of containers
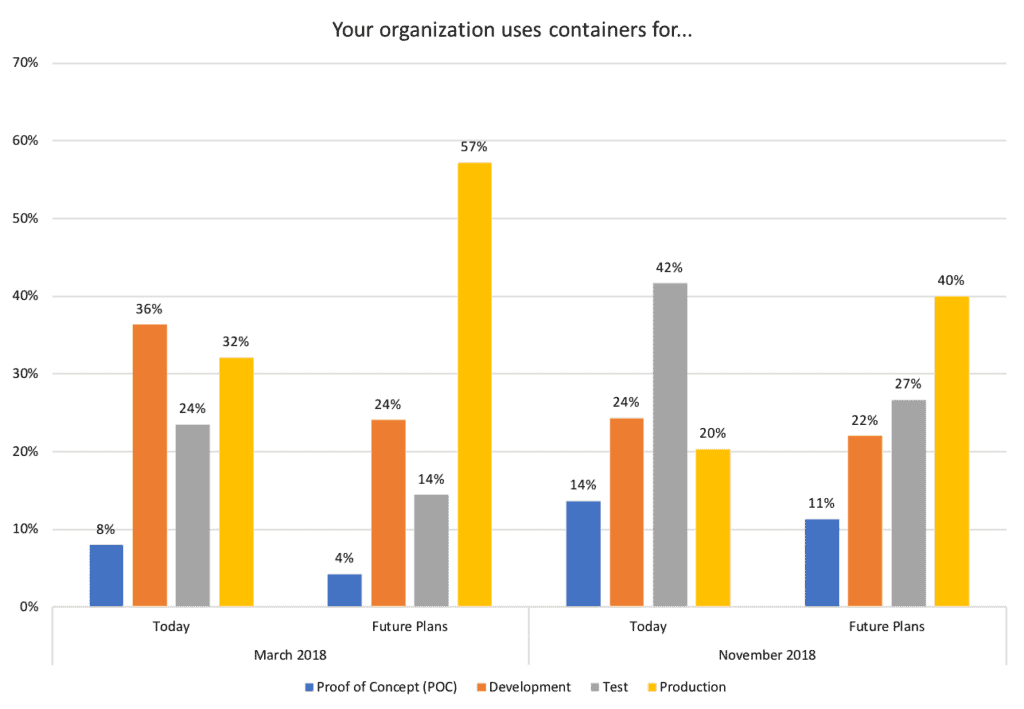
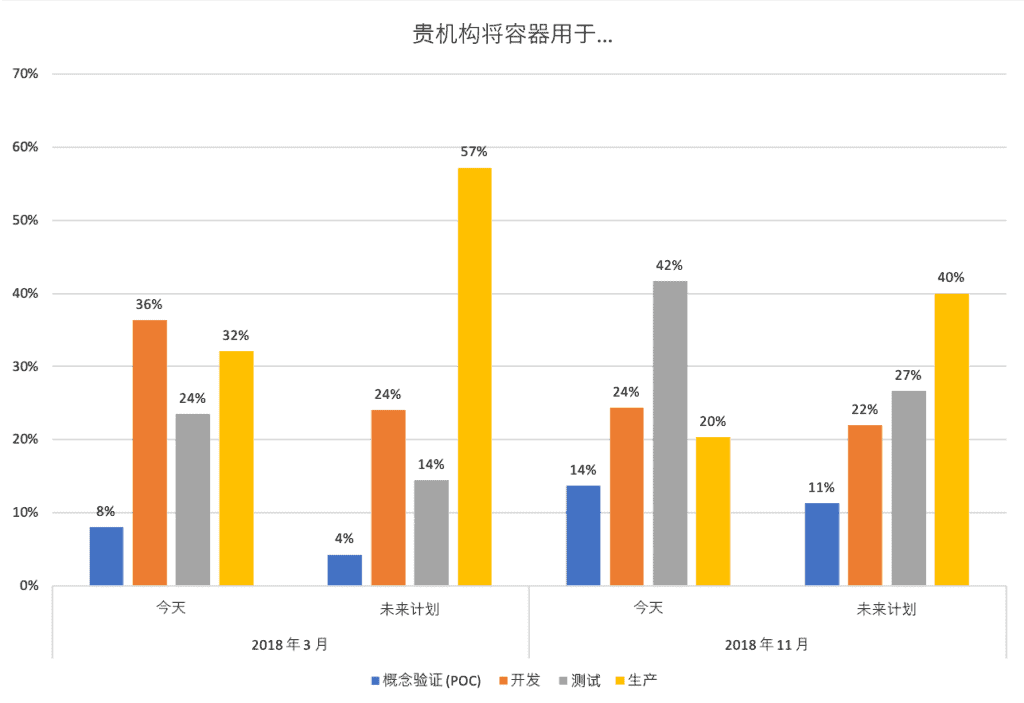
Container usage is becoming prevalent in all phases of the development cycle. There has been a significant jump in the use of containers for testing, up to 42% from 24% in March 2018 with an additional 27% of respondents citing future plans. There has also been an increase in use of containers for Proof of Concept (14% up from 8%).
As the usage of containers becomes more prevalent across all phases of development, the use of container management tools is growing. Since March 2018, there has been a significant jump in the usage of nearly all container management tools.
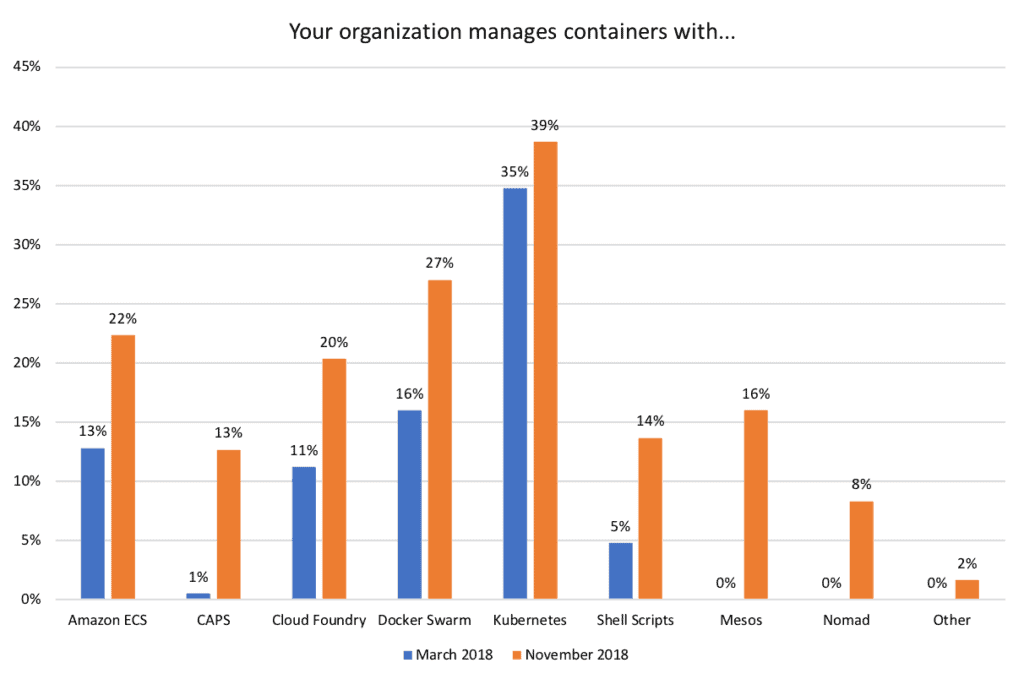
Usage of Kubernetes has grown 11% since March 2018. Other tools have also grown:
- Amazon ECS: up to 22% from 13%
- CAPS: up to 13% from 1%
- Cloud Foundry: up to 20% from 1%
- Docker Swarm: up to 27% from 16%
- Shell Scripts: up to 14% from 5%
There are also two new tools that were not cited in the March 2018 survey. 16% of respondents are using Mesos and an additional 8% are using Nomad for container management.
Commercial off-the-shelf solutions (Kubernetes, Docker Swarm, Mesos, etc.) have grown 58% overall, while home-grown management (Shell Scripts and CAPS) have grown 690%, showing that home-grown solutions are still widely popular in Asia while North American and European markets moved away from those in favor of COTS solutions.
Cloud vs. On-Premise
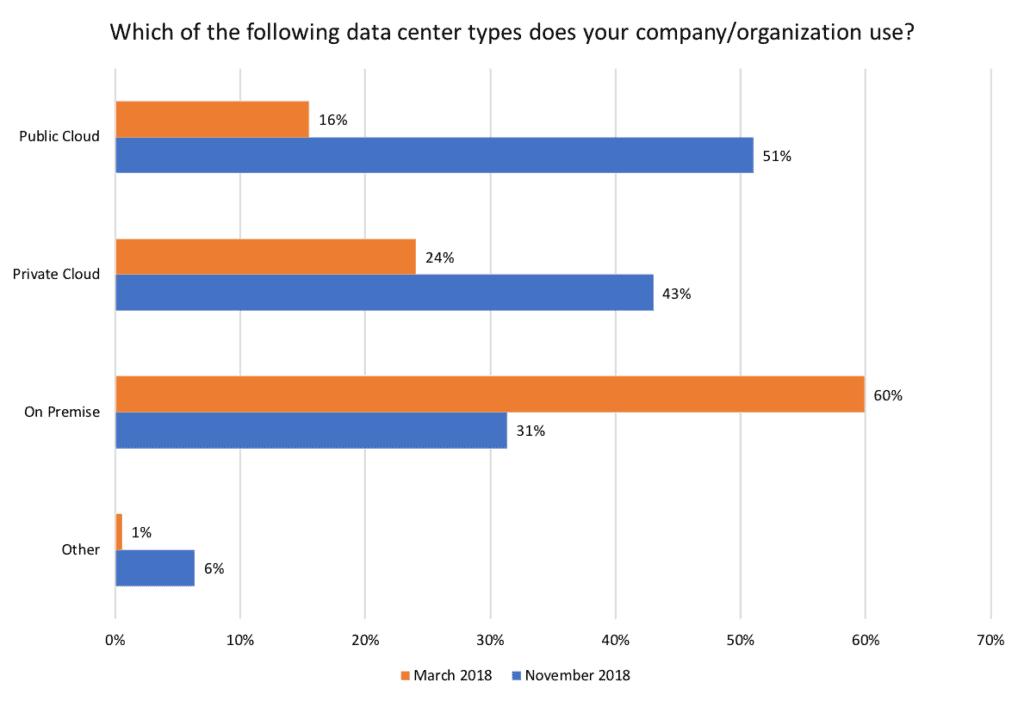
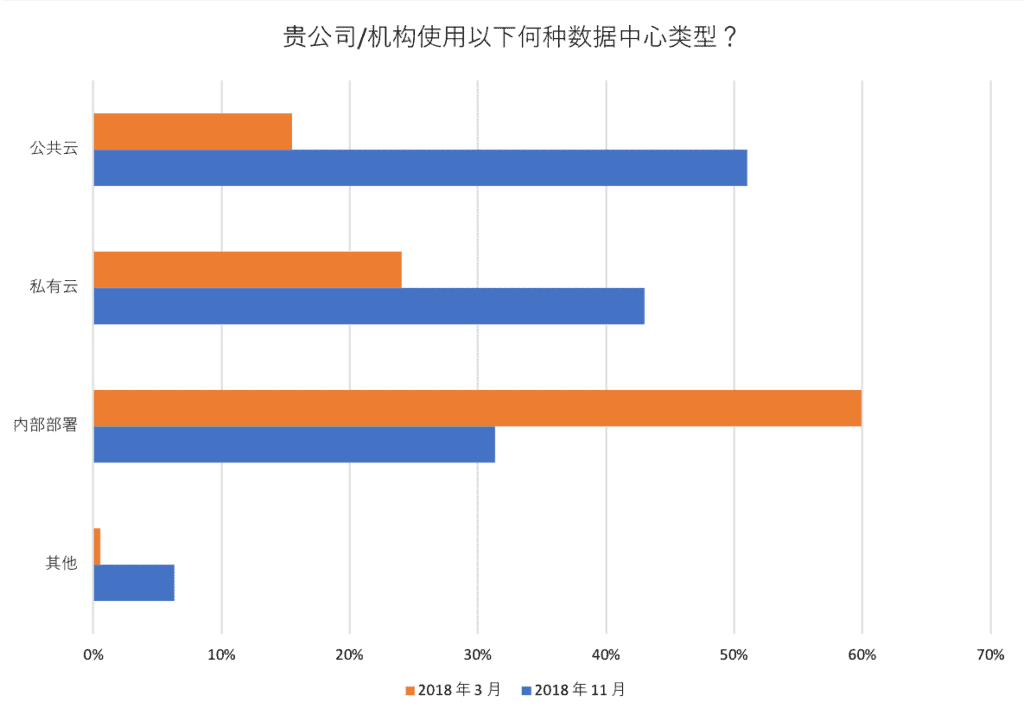
While on-premise solutions are widely used in the North American and European markets (64%), that number seems to be declining for the Asian market. Only 31% of respondents reported using on-premise solutions in this survey, compared to 60% in March 2018. Cloud usage is growing with 43% of respondents using private clouds (up from 24%) and 51% using public clouds (up from 16%).
Kubernetes
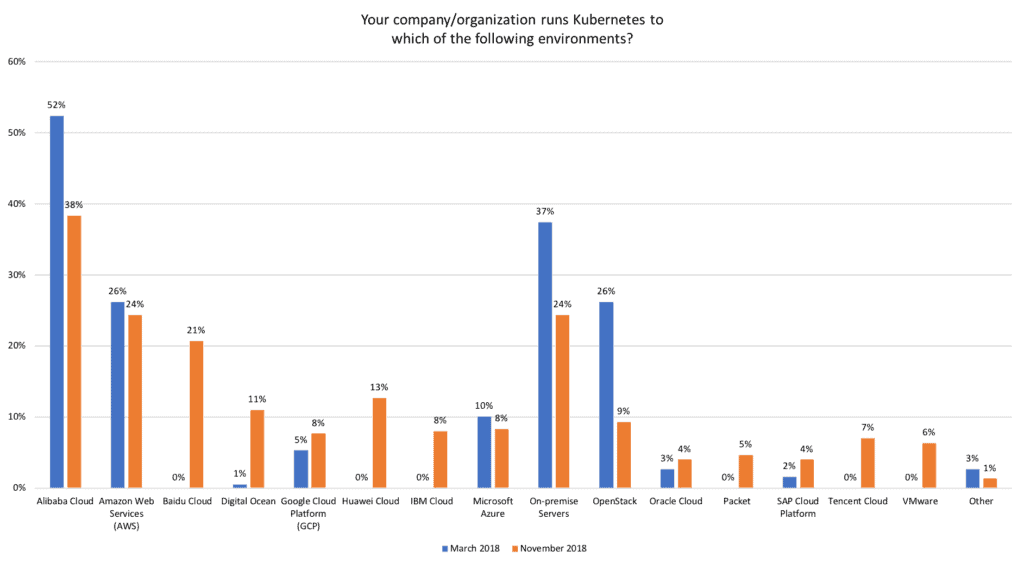
As for where Kubernetes is being run, Alibaba still remains No. 1 with 38% of respondents reporting usage, but is down from 52% in March 2018. Following Alibaba, is Amazon Web Services (AWS) with 24% of respondents citing usage, slightly down from 26%.
New environments that were not previously reported and are taking up additional market share are Huawei Cloud (13%), VMware (6%), Baidu Cloud (21%), Tencent Cloud (7%), IBM Cloud (8%), and Packet (5%).
The decline of on-premise usage is also evident in these responses, with 24% of respondents reporting that they run Kubernetes on-prem compared to 38% in March 2018. OpenStack usage has also declined significantly, down to 9% from 26% in March 2018.
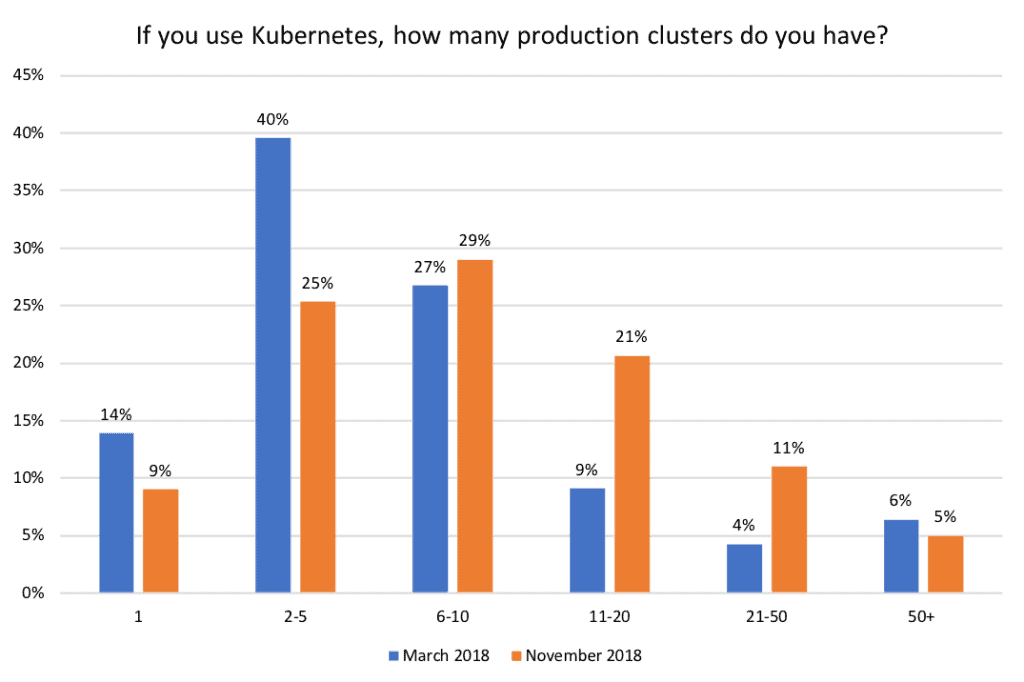
For organizations running Kubernetes, the number of production clusters is also increasing. Respondents running 1-5 production clusters decreased 37%, while respondents running 11-50 clusters increased 154%. Still, respondents are mostly running 6-10 production containers, with 29% reporting that number.
We also asked respondents about the tools they are using to manage various aspects of their applications:
Packaging
The most popular method of packaging Kubernetes applications is Managed Kubernetes Offerings (37%), followed by Ksonnet (27%) and Helm (24%).
Autoscaling
Respondents are primarily using autoscaling for Task and Queue processing applications (44%) and Java Applications (44%). This is followed by stateless applications (33%) and stateful databases (29%).
The top reasons respondents aren’t using Kubernetes autoscaling capabilities are because they are using a third party autoscaling solution (32%), were not aware these capabilities existed (30%), or have built their own solution to autoscale (26%).
Ingress Providers
The top Kubernetes ingress providers reported are F5 (36%), nginx (34%), and GCP (22%).
Exposing Cluster External Services
The most popular ways to expose Cluster External Services were Load-Balancer Services (43%), integration with a third party load-balancer (37%), and L7 Ingress (35%).
Separating Kubernetes in an Organization with Multiple Teams
Respondents are separating multiple teams within their organization using namespaces (49%), separate clusters (42%), and only labels (34%).
Separating Kubernetes Applications
Respondents are primarily separating their Kubernetes applications using separate clusters (45%), namespaces (46%), and only labels (33%).
Cloud native projects
What are the benefits of cloud native projects in production? Respondents cited the top four reasons as:
- Improved Availability (47%)
- Improved Scalability (46%)
- Cloud Portability (45%)
- Improved Developer Productivity (45%)
Compared to the North American and European markets, improved availability and developer productivity are more important in the Asian market, while faster deployment time is less important (only 38% cited this compared to 50% in the English version of this survey).
As for the cloud native projects that are being used in production and evaluated:
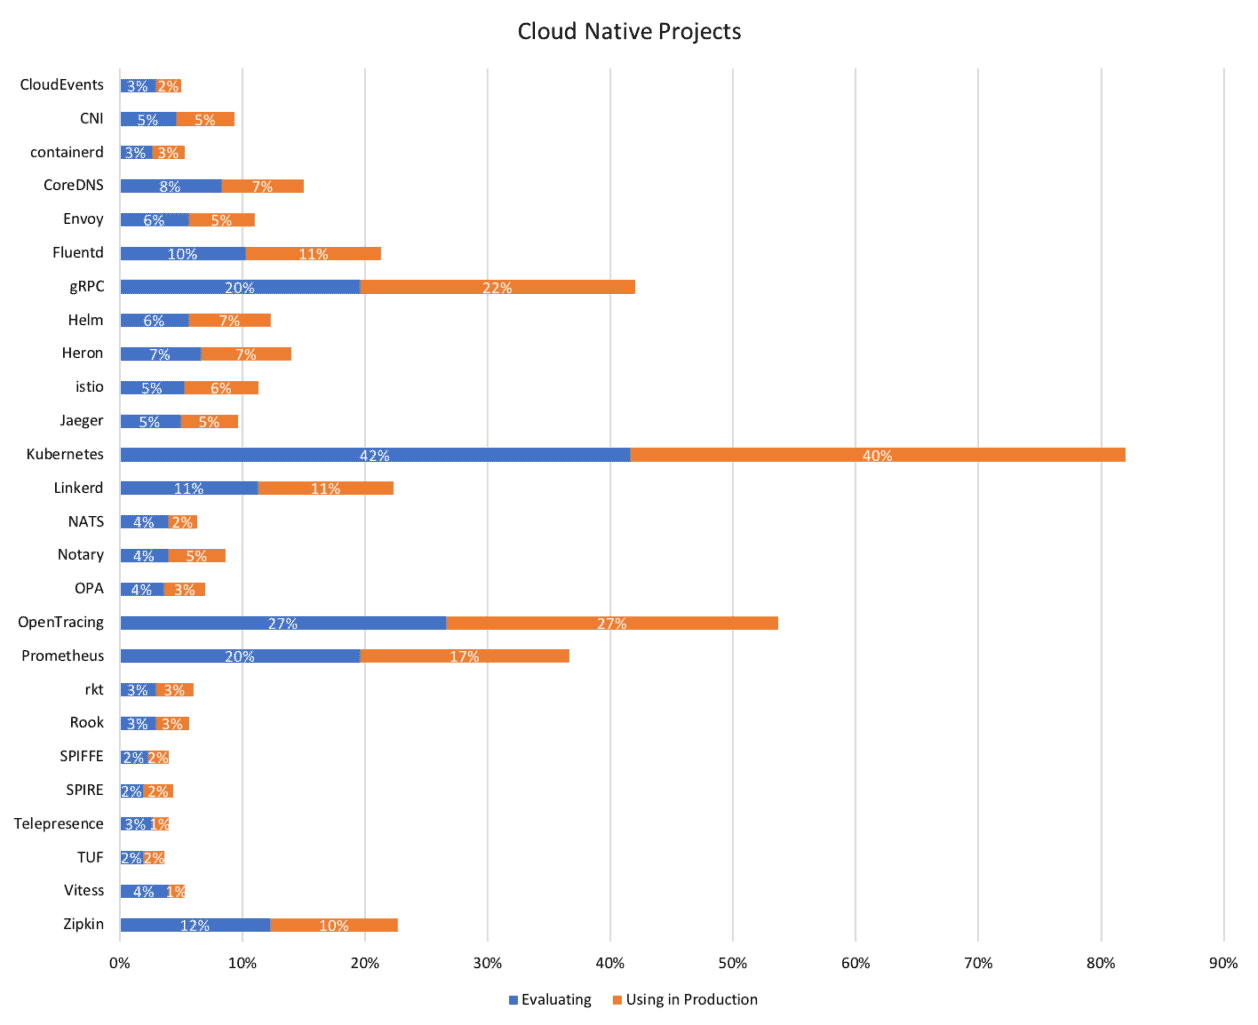
Many cloud native projects have grown in production usage since March 2018. Projects with the largest spike in production usage are: gRPC (22% up from 13%), Fluentd (11% up from 7%), Linkerd (11% up from 7%), OpenTracing (27% from 20%).
The number of respondents evaluating cloud native projects also grew with: gRPC (20% up from 11%), OpenTracing (27% up from 18%), and Zipkin (12% up from 9%).
Challenges ahead
As cloud native technologies continue to be adopted, especially into production, there are still challenges to address. The top challenges respondents are facing are:
- Lack of training (46%)
- Difficulty in choosing an orchestration solution (30%)
- Complexity (28%)
- Finding vendor support (28%)
- Monitoring (25%)
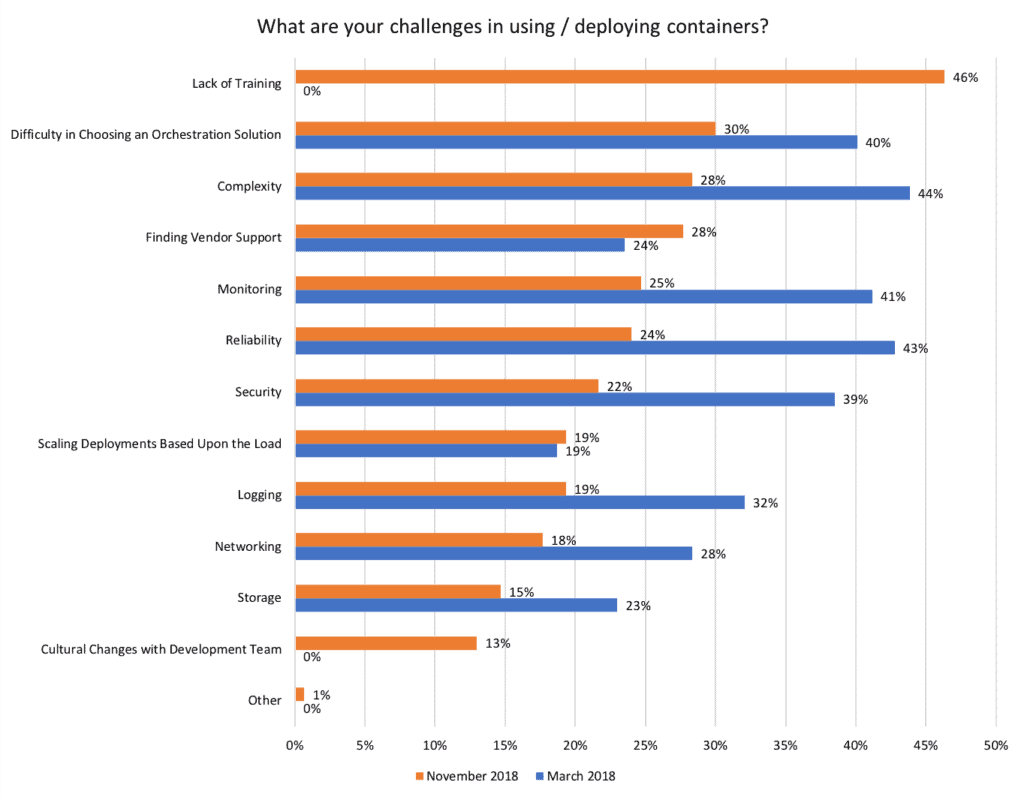
One interesting note is that many of the challenges have significantly declined since our previous survey in March 2018 as more resources are added to address these concerns. A new challenge that has come up is lack of training. While CNCF has invested heavily in Kubernetes training over the past year, including courses and certification for Kubernetes Administrators and Application Developers, we are still actively working to make translated versions of the courses and certifications available and more easily accessible in Asia. CNCF is also working with a global network of Kubernetes Training Partners to expand these resources, as well as Kubernetes Certified Service Providers to help support organizations with the complexity of embarking on their cloud native journey.
Serverless
The use of serverless technology has spiked with 50% of organizations using the technology compared to 25% in March 2018. Of that 50%, 29% are using installable software and 21% are using a hosted platform. An additional 17% plan to use the technology within the next 12-18 months.
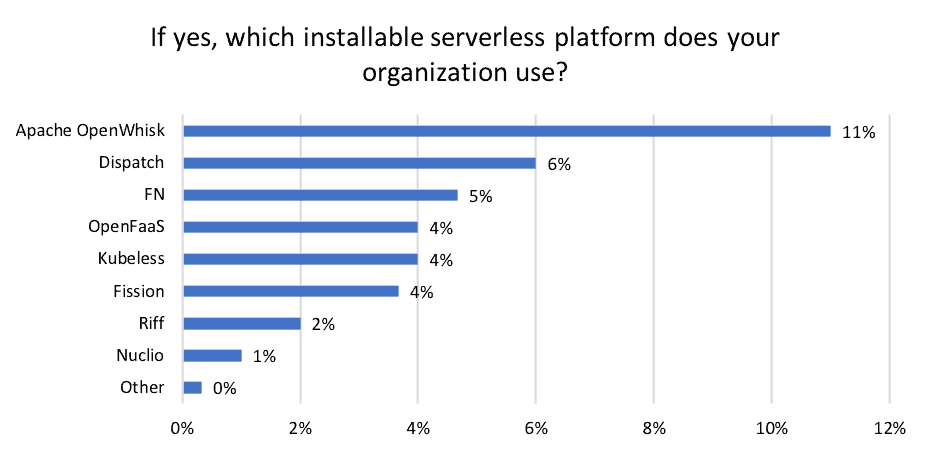
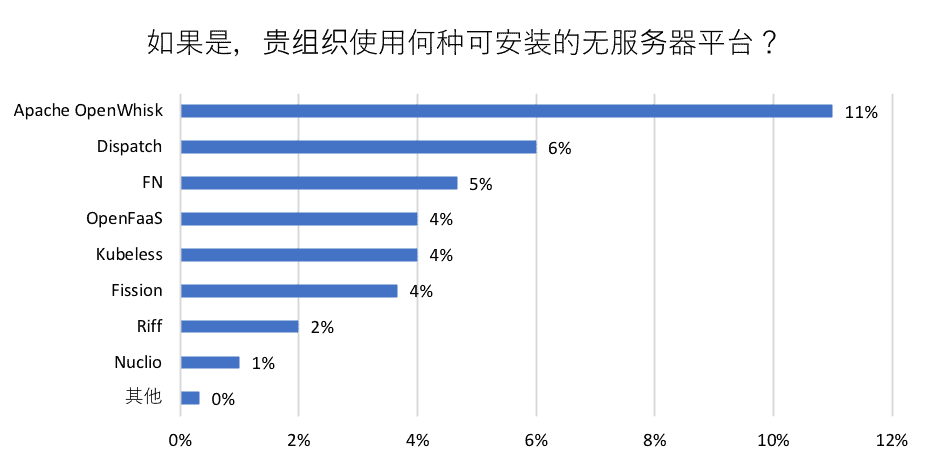
For installable serverless platforms, Apache OpenWhisk is the most popular with 11% of respondents citing usage. This is followed by Dispatch (6%), FN (5%) and OpenFaaS, Kubeless, and Fission tied at 4%.
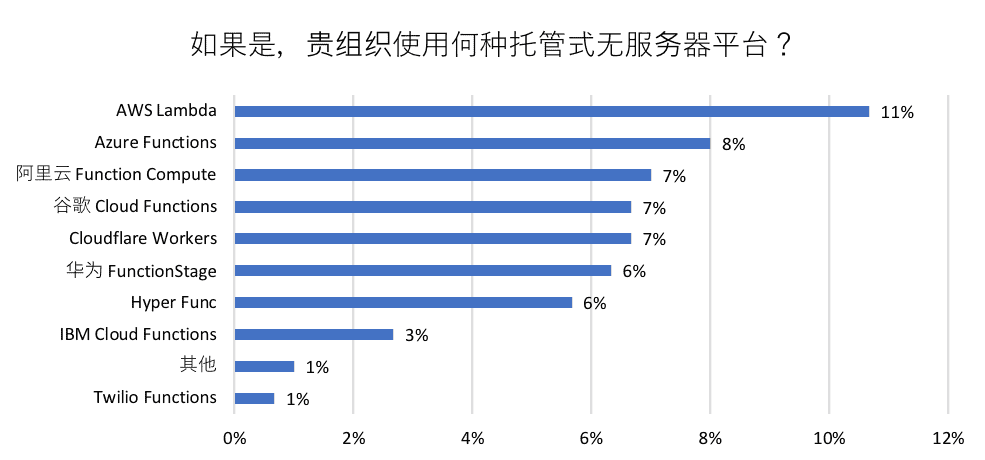
For hosted serverless platforms, AWS Lambda is the most popular with 11% of respondents citing usage. This is followed by Azure Functions (8%), and Alibaba Cloud Compute Functions, Google Cloud Functions, and Cloudflare Functions tied at 7%.
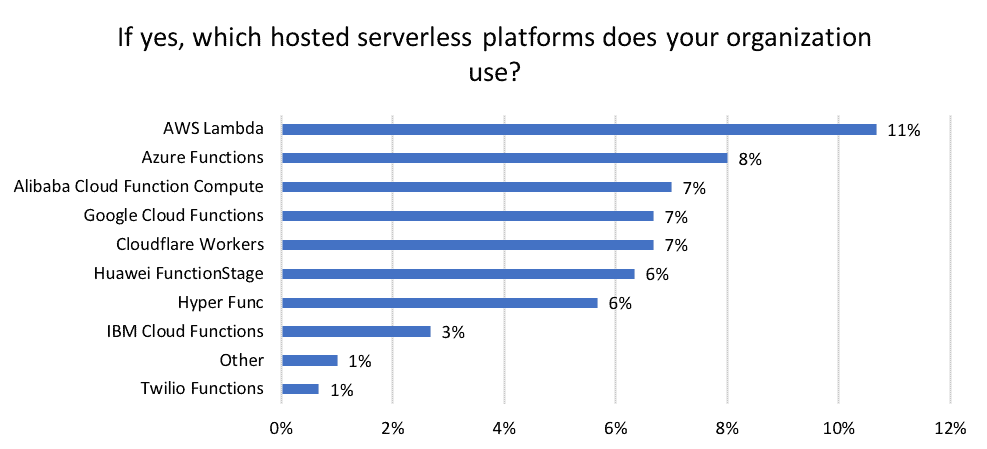
Serverless usage in Asia is higher than what we saw in North American and European markets where 38% of organizations were using serverless technology. Hosted platforms (32%) were also much more popular compared to installable software (6%), whereas in Asia both options are more evenly used. There is also much more variety in the solutions used, whereas AWS Lambda and Kubeless were the clear leaders in North America and Europe.
Relating back to CNCF projects, a small percentage of respondents are now evaluating (3%) or using CloudEvents in production (2%). CloudEvents is an effort organized by CNCF’s Serverless Working Group to create a specification for describing event data in a common way.
Cloud native is growing in China
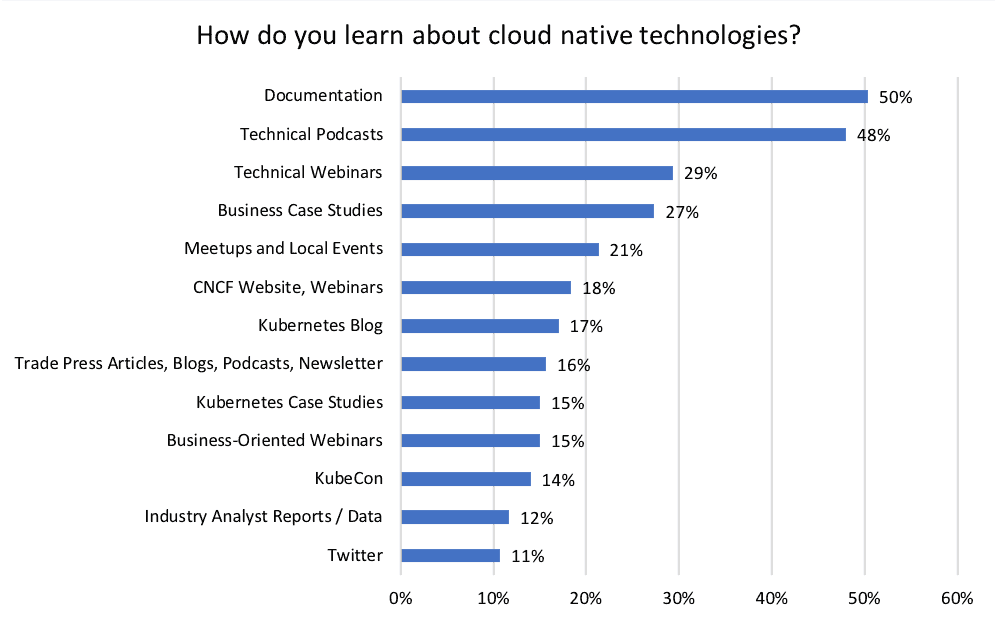
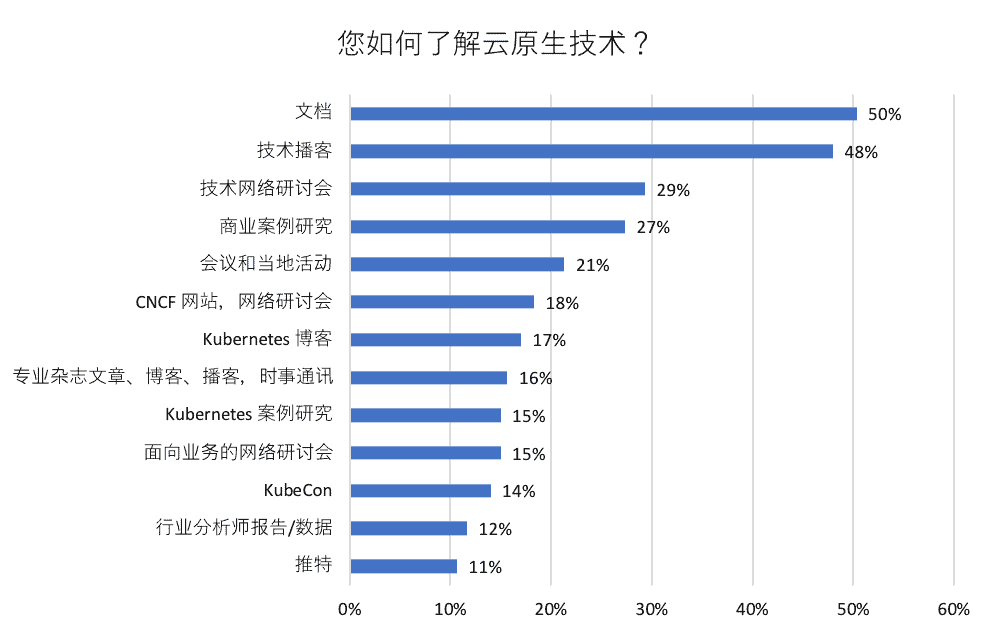
As cloud native continues to grow in China, the methods for learning about these technologies becomes increasingly important. Here are the top ways respondents are learning about cloud native technologies:
Documentation
50% of respondents are learning through documentation. Each CNCF project hosts extensive documentation on their websites, which can be found here. Kubernetes, in particular, is currently working on translating their documentation and website across multiple languages including Japanese, Korean, Norwegian, and Chinese.
Technical Podcasts
48% of respondents are learning through technical podcasts. There are a variety of cloud native podcasts out there to learn from such as the Kubernetes Podcast from Google and PodCTL by Red Hat. Also, check out this list of 10 China tech podcasts you should follow.
Technical Webinars
29% of respondents are learning through technical webinars. CNCF runs a weekly webinar series that takes place every Tuesday from 10am-11am PT. You can see the upcoming schedule and view recordings and slides of previous webinars.
Business Case Studies
27% of respondents are learning through business case studies. CNCF has a collection of end user case studies while Kubernetes also maintains an extensive list of Kubernetes-specific user case studies.
The Cloud Native Community in China
As cloud native continues to grow in Asia, CNCF is excited to be hosting the first annual KubeCon + CloudNativeCon in Shanghai this week. With over 1,500 attendees at the inaugural event, we look forward to seeing the continued growth of cloud native technologies at a global scale.
To keep up with the latest news and projects, join us at one of the 22 cloud native Meetups across Asia. We hope to see you at one of our upcoming Meetups!
A huge thank you to everyone who participated in our survey!
You can also view the findings from past surveys here:
- August 2018: Use of Cloud Native Technologies in Production Has Grown Over 200%
- March 2018: China is Going Native with Cloud
- December 2017: Cloud Native Technologies Are Scaling Production Applications
- June 2017: Survey Shows Kubernetes Leading as Orchestration Platform
- January 2017: Kubernetes moves out of testing and into production
- June 2016: Container Survey
- March 2016: Container survey results
About the Survey Methodology & Respondents
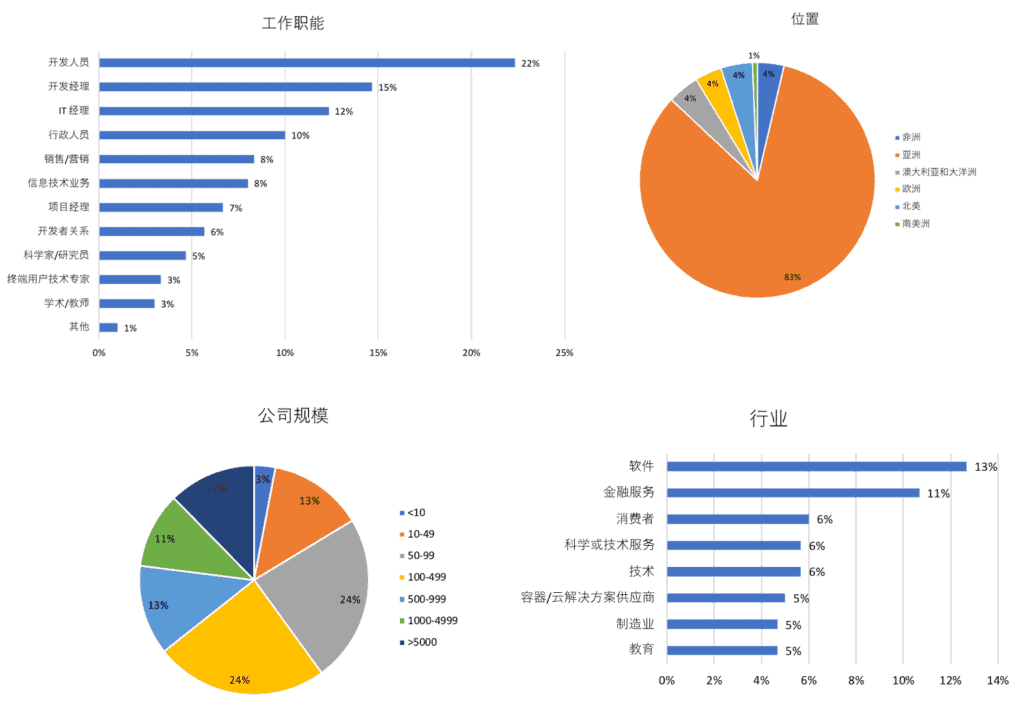
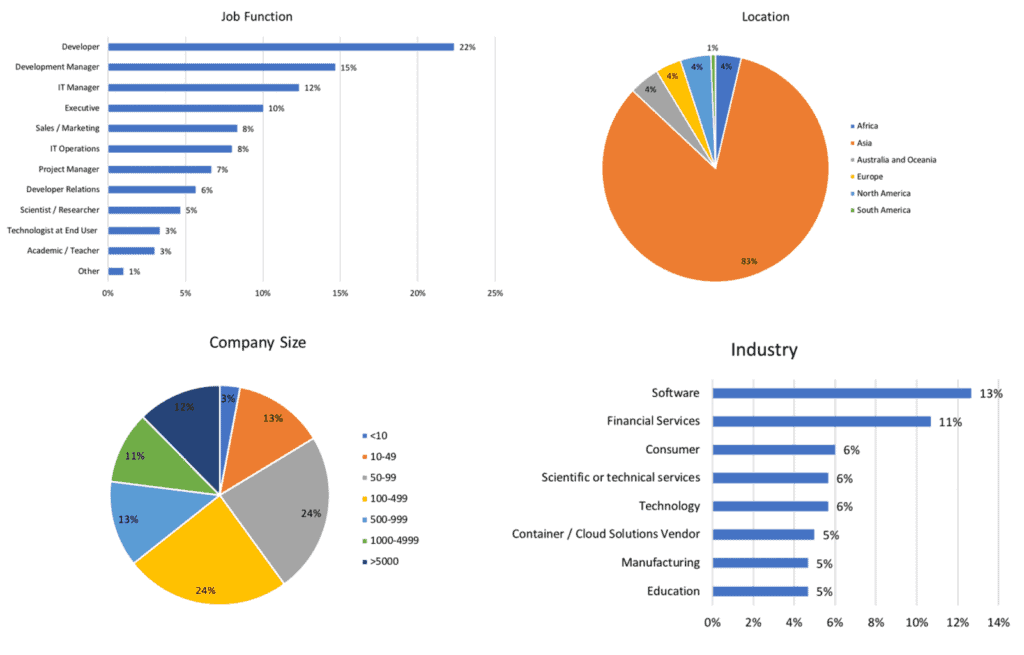
The pool of respondents represented a variety of company sizes with the majority being in the 50-499 employee range (48%). As for job function, respondents identified mostly as Developers (22%), Development Manager (15%), and IT Managers (12%).
Respondents represented 31 different industries, the largest being software (13%) and financial services (11%).
This survey was conducted in Mandarin. You can view additional demographics breakdowns below:
CNCF 调查:自 2018 年 3 月以来,亚洲云使用率增长 135%
一年两次的 CNCF 调查让社区紧跟时代脉搏,更好地了解云原生技术的采用情况。这是 CNCF 第二次用普通话进行云原生调查,以更好地衡量亚洲公司如何采用开源和云原生技术。之前的普通话调查已于 2018 年 3 月进行。本文还将与 2018 年 8 月以来北美/欧洲最新的同文调查版本进行比较。
重要结论
- 自 2018 年 3 月以来,亚洲公共云和私有云的使用量增长 135%,而本地使用量下降 48%。
- 亚洲几乎所有容器管理工具的使用率都有所增长,现成商业解决方案总体增长 58%,本土解决方案增长 690%。Kubernetes 增长 11%。
- Kubernetes 集群在生产中的数量正在增加。运行 1-5 个生产集群的亚洲组织减少 37%,而运行 11-50 个集群的受访者增加 154%。
- 在亚洲,无服务器技术的使用率激增了 100%,29% 的受访者使用可安装软件,21% 的受访者使用托管平台。
300 人回复了中文版调查,其中 83% 来自亚洲,相比之下,我们 2018 年 3 月的调查中有 187 人回复。
CNCF 在中国, 日本和韩国共有 42 位会员,其中包括 4 位白金会员:阿里云, 富士通, 华为和京东 (JD.com)。其中 某些成员也是终端用户,包括:
- 京东 (JD.com),第一家跻身全球财富 500 强的中国互联网公司,从 OpenStack 迁移至 Kubernetes,资源利用率提高 30%。
- 华为,作为世界上最大的电信设备制造商,迁移至云原生环境后,运营成本削减 20-30%。
- 据《福布斯》报道,2018 年世界上最具创新性的公司之一,雅虎日本利用 Kubernetes 自动进行生产部署 。
- 中国移动是中国最大的运营商之一,其使用容器代替虚拟机在平台上运行各种应用程序,利用 Kubernetes 提高资源利用率。
容器的增长
在开发周期的所有阶段均使用容器已经成为常态利用容器进行测试的人数大幅增加,从 2018 年 3 月的 24% 增加到 42%,另外 27% 的受访者提到未来计划采用。用于概念验证的容器使用也有所增加(从 8% 上升到 14%)。
随着容器的使用在所有开发阶段日益普遍,容器管理工具的使用也越来越多。自 2018 年 3 月以来,几乎所有容器管理工具的使用都大幅增加。
自 2018 年 3 月以来, Kubernetes 的使用量增长 11%。其他工具的使用也有所增加:
- Amazon ECS:从 13% 上升至 22%
- CAPS:从 1% 上升至 13%
- Cloud Foundry:从 1% 上升至 20%
- Docker Swarm:从 16% 上升至 27%
- Shell Scripts:从 5% 上升至 14%
也有 2018 年 3 月的调查中没有提及的两个新工具。16% 的受访者使用 Mesos,另外 8% 使用 Noman 进行容器管理。
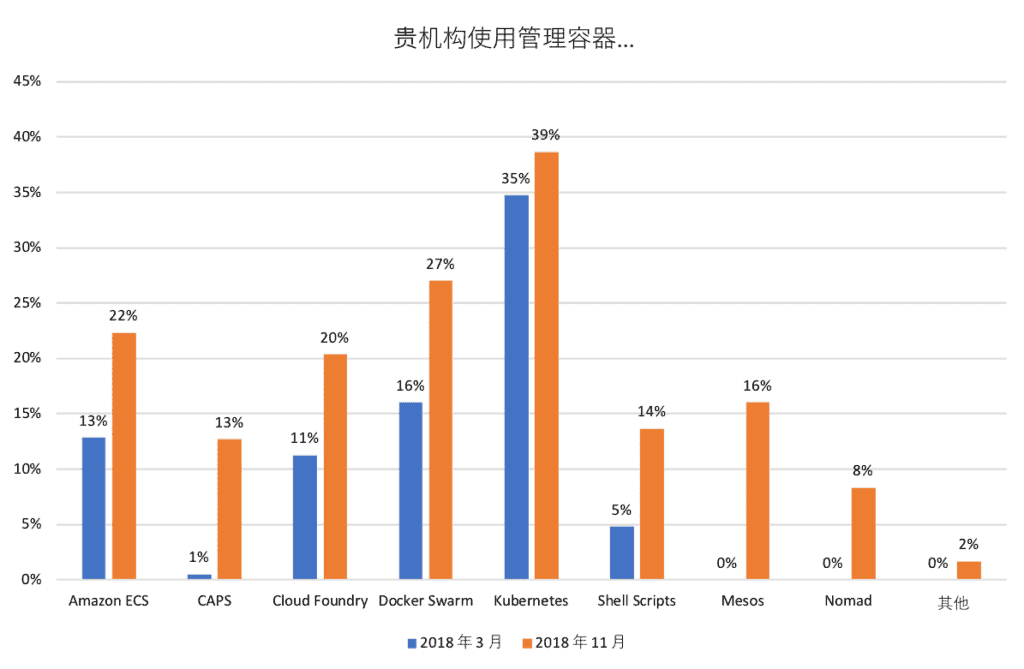
现成的商业解决方案(Kubernetes, Docker Swarm, Mesos 等)总体增长 58%,而本土管理(Shell Scripts 和 CAPS)增长 690%,这表明本土解决方案在亚洲仍然很受欢迎,而北美和欧洲市场则不再青睐 COTS 解决方案。
云与本地部署
虽然北美和欧洲市场广泛使用本地解决方案 (64%),但在亚洲市场,这一数字似乎在下降。在本次调查中,只有 31% 的受访者报告了使用本地解决方案,相比之下,2018 年 3 月这一比例为 60%。云使用率正在增长,43% 的受访者使用私有云(从 24% 上升,51% 的受访者使用公共云(从 16% 上升。
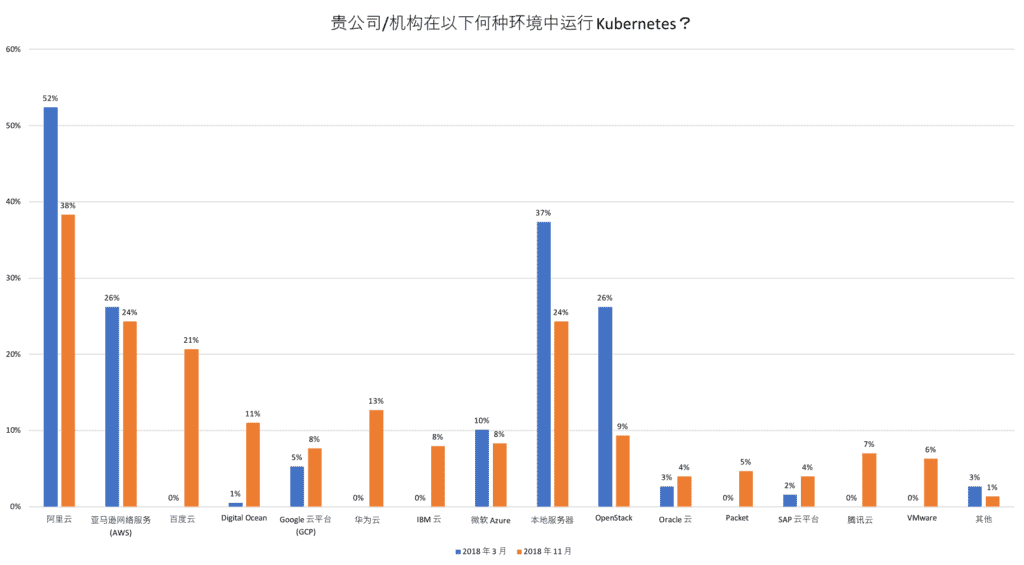
Kubernetes
至于在何处运营 Kubernetes,阿里巴巴仍是第一,38% 的受访者报告正在使用,但低于 2018 年 3 月的 52%。紧随阿里巴巴之后的是亚马逊网络服务 (AWS),24% 的受访者提到使用,略低于 26%。
以前未报告过,但正在占据额外市场份额的新环境是华为云 (13%), VMware (6%), 百度云 (21%), 腾讯云 (7%),IBM 云 (8%) 和 Packet (5%)。
这些回应中也显示,本地使用量下降,24% 的受访者报告说,他们在本地运行 Kubernetes,而 2018 年 3 月这一比例为 38%。OpenStack 的使用率也大幅下降,从 2018 年 3 月的 26% 降至 9%。
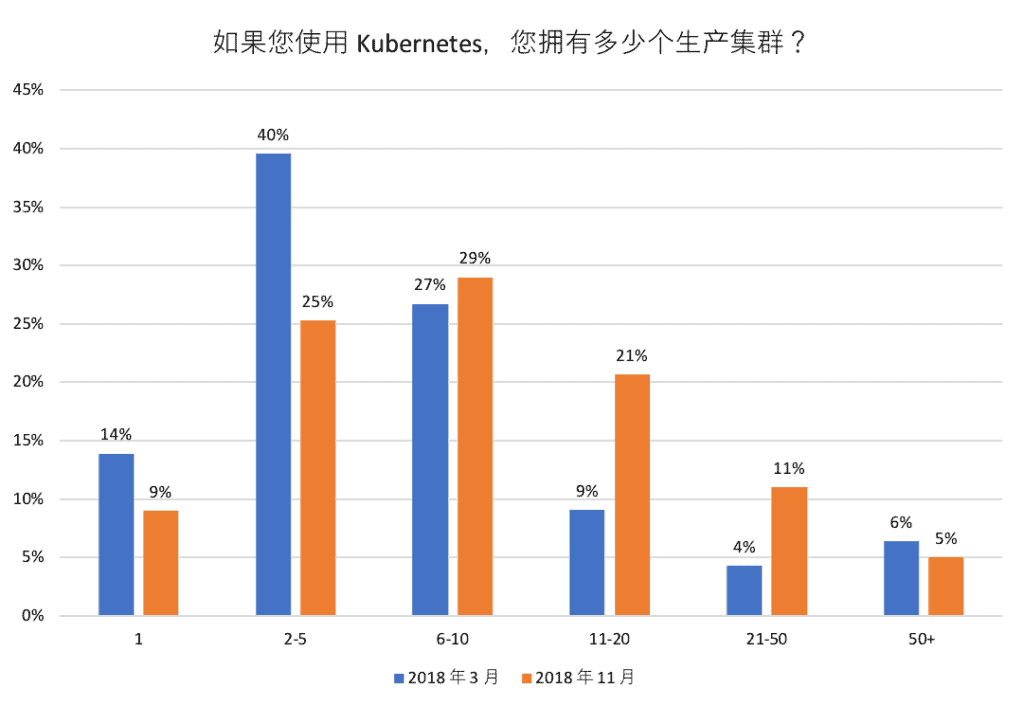
对于运行 Kubernetes 的组织而言,生产集群的数量也在增加。运行 1-5 个生产集群的受访者减少 37%,而运行 11-50 个集群的受访者增加 154%。尽管如此,受访者大多运营 6-10 个生产容器,29% 的受访者报告这一数字。
我们还向受访者询问了他们用于管理应用程序各个方面的工具:
封装
封装 Kubernetes 应用程序最流行的方法是 Managed Kubernetes Offerings (37%),其次是 Ksonnet (27%) 和 Helm (24%)。
自动扩展
受访者主要对任务和队列处理应用程序 (44%) 和 Java 应用程序 (44%) 使用自动扩展。其次是无状态应用程序 (33%) 和有状态数据库 (29%)。
受访者未使用 Kubernetes 自动扩展功能的最大原因是因为,其使用第三方自动扩展解决方案 (32%),不知道这些功能存在 (30%),或者已经构建了自己的自动扩展解决方案 (26%)。
入口提供商 (Ingress Providers)
据报告,Kubernetes 最大的入口提供商是 F5 (36%), nginx (34 %) 和 GCP (22%)。
公开集群外部服务 (Cluster External Services)
公开集群外部服务最流行的方式是负载平衡器服务 (43%), 与第三方负载平衡器的集成 (37%)和 L7 入口 (35%)。
在拥有多个团队的组织中分离 Kubernetes
受访者使用命名空间 (49%), 单独集群 (42%)和仅使用标签 (34 %),将组织内的多个团队分开。
分离 Kubernetes 应用程序
受访者主要使用单独的集群 (45%), 命名空间 (46%) 和标签 (33%),分离他们的 Kubernetes 应用程序。
云原生项目
云原生项目在生产中有什么优点?受访者列举了前四个原因:
- 提高可用性 (47%)
- 改进可扩展性 (46%)
- 云便携性 (45%)
- 提高开发人员的工作效率 (45%)
与北美和欧洲市场相比,提高可用性和开发人员工作效率在亚洲市场更为重要,而更快的部署时间则不那么重要(只有 38% 的受访者提到了这一点,而在本调查的英文版本中这一比例为 50%。
至于生产和评估中使用的云原生项目:
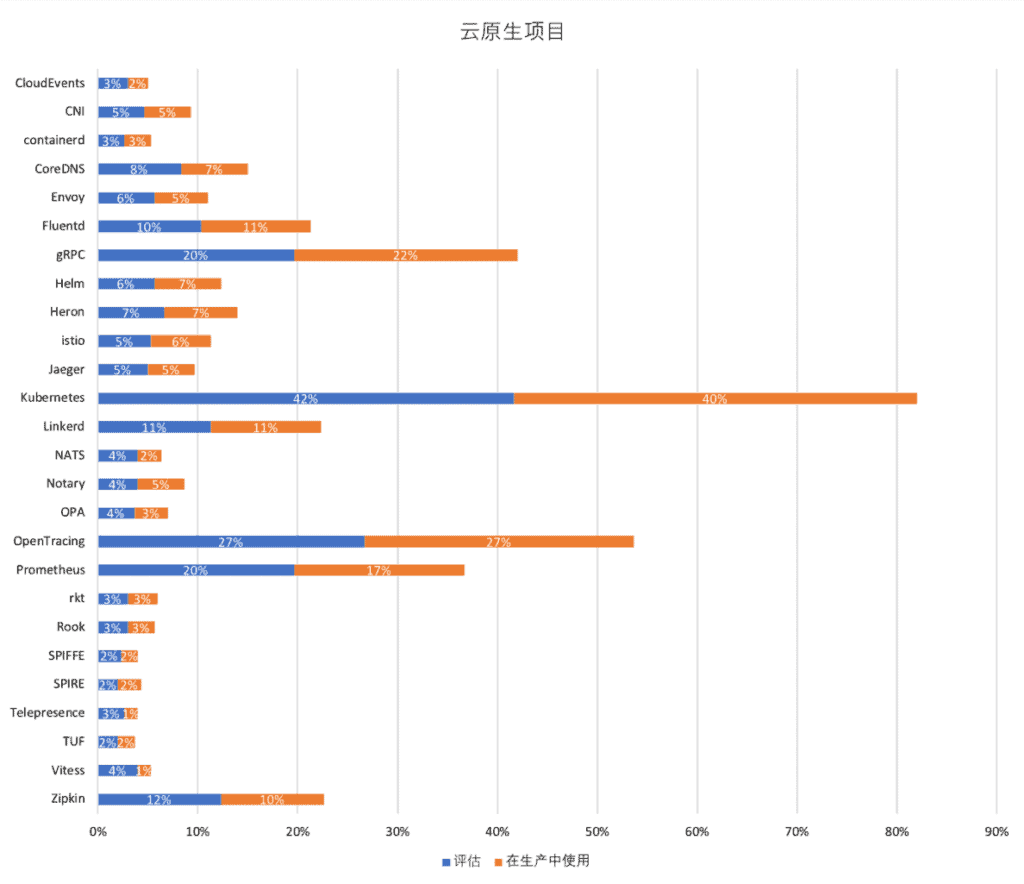
自 2018 年 3 月以来,许多云原生项目的生产使用率有所增长。生产使用率最高的项目是:gRPC(从 13% 上升至 22%, Fluentd(从 7% 上升至 11%, Linkerd(从 7% 上升至 11%,OpenTracing(从 20% 上升至 27%。
评估云原生项目的受访者数量也在增长:gRPC(从 11% 上升到 20%), OpenTracing(从 18% 上升到 27%)和 Zipkin(从 9% 上升到 12%。
未来的挑战
随着云原生技术不断被采用,尤其是在生产中,仍然有挑战需要解决。受访者面临的最大挑战是:
- 缺乏培训 (46%)
- 难以选择编排解决方案 (30%)
- 复杂性 (28%)
- 寻找供应商支持 (28 %)
- 监控 (25%)
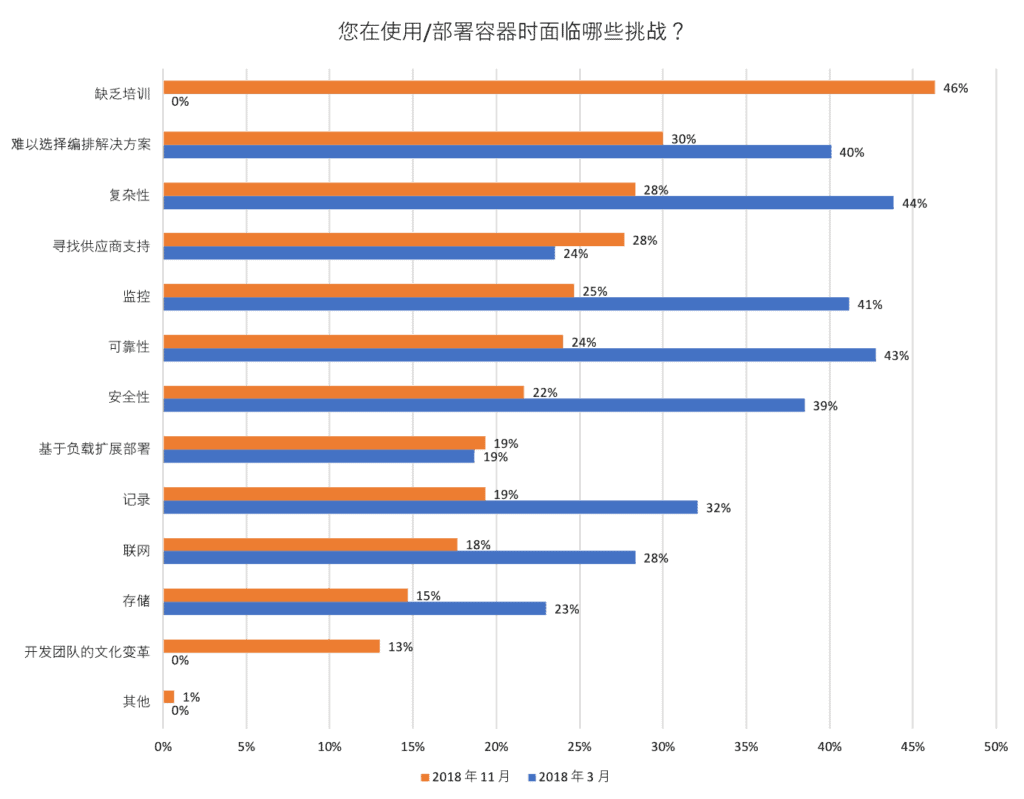
我们注意到一个有趣的现象,自 2018 年 3 月的上一次调查以来,随着更多资源用于解决这些问题,许多挑战已经显著减少。出现的一个新挑战是缺乏培训。虽然 CNCF 在过去的一年中在Kubernetes 培训方面投入了大量资金,包括 Kubernetes 管理员和应用程序开发人员的课程和认证,但我们仍在积极努力使这些课程和认证的翻译版本在亚洲更容易访问。CNCF 还与 Kubernetes 培训合作伙伴的全球网络合作,以扩展这些资源,并与Kubernetes 认证服务提供商]合作,帮助支持复杂的组织踏上云原生之旅。
无服务
无服务器技术的使用在使用此技术的组织中激增 50%,而 2018 年 3 月这一比例为 25%。在这 50% 中,29% 使用可安装软件,21% 使用托管平台。另外 17% 的受访者计划在未来 12-18 个月内采用这项技术。
对于可安装的无服务器平台,Apache openshill 最受欢迎,有 11% 的受访者提到正在使用。其次是 Dispatch (6%), FN (5%) 和 OpenFaaS, Kubeless,和 Fission,并列 4%。
对于托管式无服务器平台,AWS Lambda 最受欢迎,有 11% 的受访者提到正在使用。其次是 Azure Functions (8%),阿里云 Compute Functions, 谷歌云 Functions 和Cloudflare Functions 并列 7%。
亚洲的无服务器使用量高于北美和欧洲市场,其中,38% 的组织使用无服务器技术。与可安装软件 (6%) 相比,托管平台 (32%) 也更受欢迎,而在亚洲,这两种选择的使用更均匀。使用的解决方案也多种多样,而 AWS Lambda 和 kubeness 显然是北美和欧洲的领导者。
关于回到 CNCF 项目,一小部分受访者现在正在评估 (3%)或在生产中使用 CloudEvents(2%)。CloudEvents 是由 CNCF 无服务器工作组 组织的一项工作,旨在创建以一种通用方式描述事件数据的规范。
云原生在中国生根发芽
随着云原生在中国的持续增长,学习有关这些技术的方法变得越来越重要。以下是受访者了解云原生技术的主要方式:
文档
50% 的受访者通过文档学习。 每个 CNCF 项目在网站上都有大量文档,可以在此处找到。尤其是 Kubernetes,目前正致力于采用多种语言翻译其文档和网站,包括日语, 韩语, 挪威语和汉语。
技术播客
48% 的受访者通过技术播客学习。有各种各样的云原生播客可供学习,例如,谷歌的 Kubernetes 播课和 Red Hat 的PodCTL b。此外,可以查看 您应当留意的 10 个中国技术播客。
技术网络研讨会
29% 的受访者通过技术网络研讨会学习。CNCF 每周星期二上午 10 点到 11 点举办一次网络研讨会系列。您可以查看即将到来的时间表,或查看 之前网络研讨会的录音和幻灯片。
商业案例研究
27% 的受访者通过商业案例学习。CNCF 收集了终端用户案例研究 ,而 Kubernetes 也保留了大量的Kubernetes 特定用户案例研究列表。
中国的云原生社区
随着云原生技术在亚洲的持续增长,CNCF 很期待本周在上海举办首届 KubeCon + CloudNativeCon 年会。有 1,500 多名与会者参加开幕式,我们期待看到云原生技术在全球范围内的持续增长。
若要了解最新的新闻和项目,请参加我们在亚洲举办的 22 场云原生交流会。我们期待着在即将举行的会议上与您见面!
衷心感谢每一位调查参与人员!
您也可以在这里查看过去调查的结果:
- 2018 年 8 月:生产中使用云原生技术增长 200%
- 2018 年 3 月:云技术在中国遍地开花
- 2017 年 12 月:云原生技术正在扩展生产应用程序
- 2017 年 6 月:调查显示,Kubernetes 是领先的编排平台
- 2017 年 1 月:Kubernetes 从测试走向生产
- 2016 年 6 月:容器调查
- 2016 年 3 月:容器调查结果
关于调查方法和受访者
受访者代表各种公司规模,其中大多数在 50-499 名员工范围内 (48%)。至于工作职能,受访者大多数为开发人员 (22%), 开发经理 (15%) 和 IT 经理 (12%)。
受访者代表了 31 个不同的行业,主要为软件 (13%) 和金融服务 (11%) 行业。
此项调查采用普通话进行。下列为其他人口学统计数据: