

The question that stopped the meeting
It was a routine cost review. The slide showed the month’s GPU spend, the biggest line on the whole infrastructure bill, and someone asked a five-word question: “Are we using these things?” Nobody could answer. The most expensive hardware we owned was also the hardest to see.
The frustrating part is that the answer already existed. Every GPU’s utilization had been recorded, every second, for months, all of it flowing into one central, infrastructure-owned Prometheus that held every metric for every team across thousands of namespaces. The data was right there. It just sat somewhere no tenant was allowed to look, because a store that sees everyone’s metrics can’t safely be opened to any one of them. So visibility split in two:
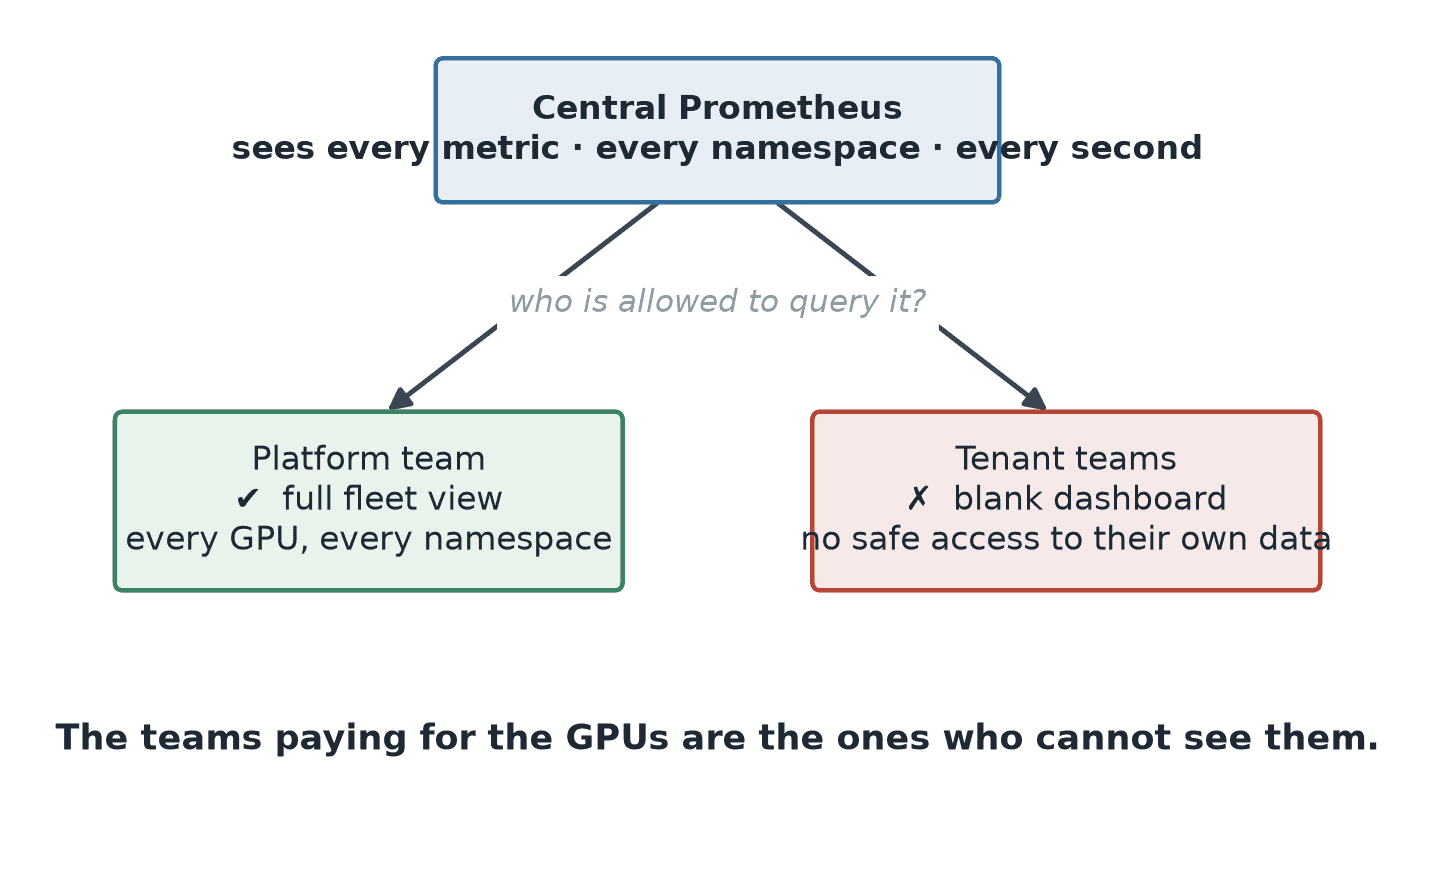
When we finally went looking, we found a GPU that had sat at zero percent utilization for eleven straight days: allocated, powered on, doing nothing, and invisible to the team that owned it. You can’t fix what you’re not allowed to see. Multiply that one idle card across a fleet, all of it drawing power behind green health checks, and “we’re not sure” becomes real money every month.
This post is how we closed that gap: how we gave every team a safe, self-service view into their own metrics without handing them the keys to everyone else’s. No new metrics stack, no vendor platform, just CNCF-native pieces arranged so the people spending the GPU budget can finally see it.
Why “just share Prometheus” doesn’t work
The obvious fix is to give every team read access to the central Prometheus. We ran into two walls, each built from an individually correct decision.
The first is security. A Prometheus query endpoint isn’t namespace-aware: if a tenant can run one PromQL query, they can run any query, including one that reads another tenant’s request rates or capacity plans. “Everyone can read everything” isn’t a posture you can defend across thousands of namespaces.
The second is scale, and it has a name every platform engineer knows: the noisy neighbor. The central Prometheus is already scraping and storing series for the whole fleet. Point a few hundred engineers and ad-hoc queries at it and the store everyone depends on starts to buckle. One team’s expensive range query becomes everyone’s latency spike.
Both are reasonable on their own. Together they leave the data tenants need locked in a store you can’t safely open to them. We needed to give each tenant their own curated, isolated slice, served directly.
A metaphor that made it click
Picture the central Prometheus as one enormous reading room where every team’s private notebooks sit on open shelves. Hand out a room key and you break confidentiality in the same motion, and the moment a crowd arrives the shared room grinds to a halt. What you want is a librarian who takes your card and brings a copy of only your box. That librarian is the multi-tenant proxy.
The insight: a proxy in front, a contract in YAML
We didn’t need a new metrics stack. We needed a thin, tenant-aware layer in front of the one we already had. The design came down to three moves:
- Identify: Authenticate the caller and establish which tenant they are.
- Isolate: Restrict every query to that tenant’s namespace, enforced below the query language so it can’t be bypassed.
- Deliver: Optionally copy a curated slice of each tenant’s metrics into their own small Prometheus, so their dashboards and alerts run against a store they own.
The other half is self-service. Platform teams can’t hand-curate metric lists for thousands of namespaces, so the contract is a small Kubernetes custom resource, a MetricAccess object, where a team declares which metrics it wants. The platform owns the mechanism; the tenant owns the policy. All of it sits on CNCF-native, open source pieces.
How the pieces fit
The infrastructure Prometheus keeps doing its job; everything tenant-facing sits behind the proxy:
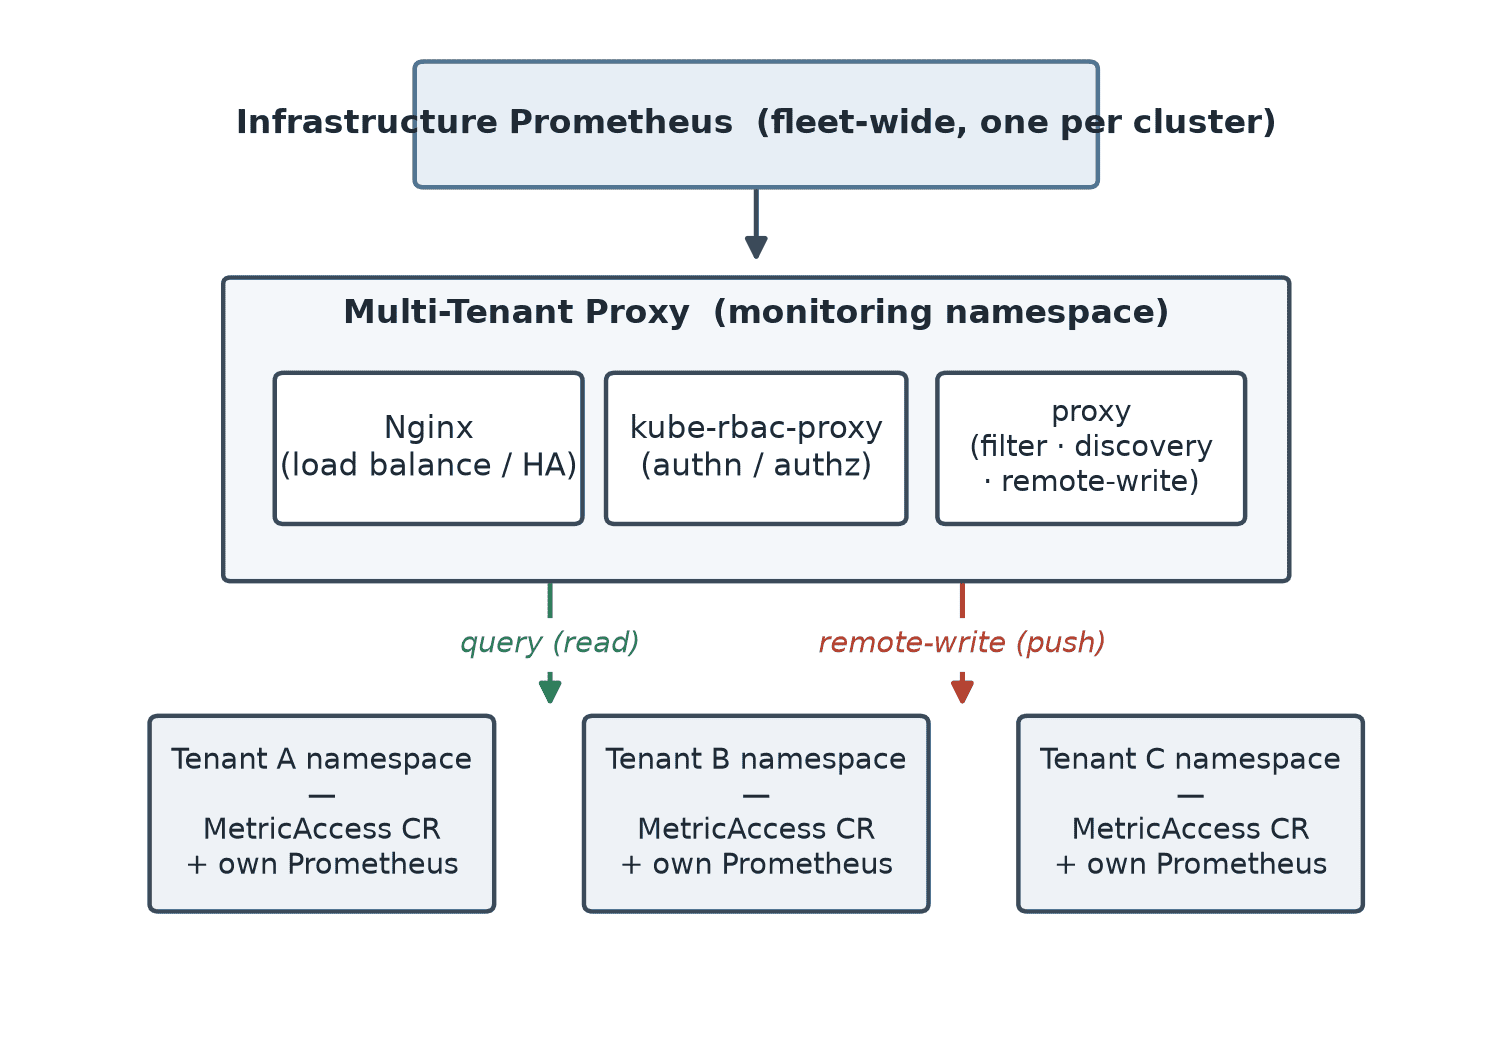
On the read path, a tenant’s request enters through Nginx (load-balancing across proxy replicas), passes through kube-rbac-proxy for authentication and authorization, and reaches the proxy. The proxy discovers backend Prometheus instances via the Kubernetes API, fans the query across healthy backends, filters results to what the tenant may see, and returns the aggregate.
On the write path, the proxy periodically collects each tenant’s curated metrics and remote-writes them into that tenant’s own Prometheus. For HA tenants it resolves each replica’s pod DNS and writes to all of them, so every instance holds identical data. None of this is exotic: Prometheus, service discovery, and remote-write with a tenancy model on top.
The part that has to be airtight: isolation
Self-service is only safe if isolation isn’t optional. Two open source components do the work here.
kube-rbac-proxy handles authentication and authorization. It answers “who is this, and are they allowed?” using Kubernetes-native identity and RBAC, the same model you already trust for the API server, and carries the tenant’s identity through as a namespace assertion that anchors everything downstream.
Query-time isolation is handled by prom-label-proxy . It’s the piece that makes “everyone can read everything” impossible rather than merely discouraged: it rewrites every incoming query to inject a namespace matcher, so any query becomes query{namespace=”your-namespace”} before it reaches Prometheus. Enforcement happens below the query language, so no PromQL can escape it.
The proxy itself runs hardened: non-root (UID 65534), read-only root filesystem, all capabilities dropped, no privilege escalation, least-privilege service account. Defense in depth on the path that matters most.
Isolation that also cuts the bill
There’s a second, quieter isolation, where the cost story lives. Read-time filtering stops tenants seeing each other’s data, but a tenant’s own Prometheus can still store far more than it needs. The metricIsolation setting pushes the boundary to collection time: metrics are gathered through prom-label-proxy with the namespace filter already applied, so a tenant only ever ingests its own series.
The difference is not subtle:
| Configuration | Series stored | Query speed | Isolation |
| metricIsolation: false | ~10,000+ (all namespaces) | Slower (large dataset) | Query-time only |
| metricIsolation: true | ~300 (this namespace) | Faster (focused dataset) | Collection + query time |
For a typical tenant that’s roughly a 97% cut in stored series, from ten-thousand-plus down to a few hundred. A smaller store queries faster, costs less, and can’t leak data it never collected. The noisy-neighbor problem shrinks too, since the fleet-wide store leaves the critical path for everyday dashboards. Our original team went from empty dashboards to a Prometheus of its own.
What a tenant actually does
A tenant onboards with a single YAML file that declares the metrics and where to deliver them:
apiVersion: observability.ethos.io/v1alpha1
kind: MetricAccess
metadata:
  name: gpu-team-metrics
  namespace: gpu-team
spec:
  source: gpu-team
  metricIsolation: true          # only collect this namespace's series
  metrics:
    - "DCGM_FI_DEV_GPU_UTIL"                       # exact match
    - "container_(cpu|memory)_.*"                  # regex
    - '{__name__=~"nginx_ingress_controller_.*"}'  # PromQL selector
  remoteWrite:
    enabled: true
    interval: "30s"
    target:
      type: "prometheus"
    prometheus:
      serviceName: "prometheus-operated"
      servicePort: 9090
      replicas: 2                # write to both HA replicas
      statefulSetName: "prometheus-gpu-team"
    extraLabels:
      tenant: "gpu-team"
      managed_by: "multi-tenant-proxy"
The metrics list mixes three styles freely: exact names, regexes, and PromQL selectors. Apply the file and the proxy starts collecting and delivering. Querying is a normal Prometheus API call with a tenant header:
curl -H "X-Tenant-Namespace: gpu-team" \
  "http://prometheus-multi-tenant-proxy:8080/api/v1/query?query=DCGM_FI_DEV_GPU_UTIL"
One requirement: the tenant’s Prometheus must accept remote-write (start it with –web.enable-remote-write-receiver). Everything else is defaults.
Six PromQL queries that make idle GPUs visible
Once a team can see GPU metrics, a few queries do most of the work. These assume a DCGM-style exporter; adjust the names to yours. Queries 5 and 6 also use an ingress request-rate metric, so swap nginx_ingress_controller_requests for whatever your ingress exposes.
1. Average GPU utilization per namespace — the headline number the team was missing:
avg by (namespace) (DCGM_FI_DEV_GPU_UTIL)
2. Count GPUs that are effectively idle — under 5% utilization for the last hour (this one finds the money):
count by (namespace) (avg_over_time(DCGM_FI_DEV_GPU_UTIL[1h]) < 5)
3. GPU memory used vs. total per namespace — separates “busy and memory-bound” from “reserved but empty”:
sum by (namespace) (DCGM_FI_DEV_FB_USED)
/ sum by (namespace) (DCGM_FI_DEV_FB_USED + DCGM_FI_DEV_FB_FREE)
4. Power draw per namespace — a rough real-time proxy for cost:
sum by (namespace) (DCGM_FI_DEV_POWER_USAGE)
5. Hot cards, no traffic — GPUs busy while ingress is silent, often a stuck job:
avg by (namespace) (DCGM_FI_DEV_GPU_UTIL) > 70
and sum by (namespace) (rate(nginx_ingress_controller_requests[5m])) < 1
6. Traffic, no GPUs — requests arriving while GPUs sit idle points at a scheduling gap, not capacity:
sum by (namespace) (rate(nginx_ingress_controller_requests[5m])) > 10
and avg by (namespace) (DCGM_FI_DEV_GPU_UTIL) < 5
Query 2 closed the loop for our original team: it surfaced GPUs idle for hours, the invisible spend we opened with, capacity they could finally see and give back.
Holding up at fleet scale
Self-service without limits just moves the noisy-neighbor problem downstream. Two levers keep load bounded. Curated metric sets mean the proxy handles a fraction of the fleet’s cardinality, not all of it. And per-tenant collection intervals act as a quota: one team can run at 5-second resolution, a batch workload at five minutes, and neither pays for the other’s cadence.
Across many clusters it leans on the same primitives: dynamic backend discovery, independent per-tenant remote-write, and writes to all HA replicas so failover is a non-event. It’s still a system you operate, but its moving parts are ones a platform team already knows.
What we’d tell our past selves
- Self-service still needs guardrails. A team asking for “all metrics” usually means “I don’t know which ones I need yet.” Curation is a conversation, and good defaults beat a big allowlist.
- Cardinality is a cost decision. metricIsolation is the difference between a 300-series store and a 10,000-series one. Turn it on unless a team has a concrete cross-namespace reason not to.
- Delivery is where the sharp edges are. Retries, backoff, and HA multi-replica writes aren’t optional extras. Budget for the failure modes up front.
- Isolation can be overkill. Small teams do fine on filtered query access alone; reserve remote-write for teams that own real dashboards and alerts.
- Names drift across clusters. Half our early “no data” tickets were a query naming a metric the exporter didn’t emit. Pin exporter versions and document the exact series names.
The portable idea
Strip away the specifics and the pattern fits any multi-tenant cluster: an authn/authz proxy, label-enforced isolation below the query language, and optional per-tenant remote-write, all CNCF-native and open source. No proprietary lock-in, no bespoke stack; if you already run Prometheus, you have the foundation. Other approaches exist and are worth a look. This is just the one that let us give thousands of namespaces their own view without opening the shared store to everyone.
The team that couldn’t see its own GPUs now runs its own dashboards and catches idle capacity within the hour. The reading room is quiet again, and everyone has their own desk.
Try it yourself
The proxy is open source under Apache 2.0; the MetricAccess CRD, manifests, and examples are in the repo. The KubeCon + CloudNativeCon India 2025 talk walks through a live demo.
Repository: https://github.com/adobe/prometheus-multi-tenant-proxy
Talk recording: https://www.youtube.com/watch?v=gI40zpbES5w
About the authors
Bingi Narasimha Karthik (Golden Kubestronaut, Adobe) is a Senior Cloud Engineer working on Kubernetes observability and GPU workload orchestration. He co-presented “Unlocking Kubernetes Observability: Secure, Tenant-Centric Metrics for GPU Workloads” at KubeCon + CloudNativeCon India 2025 and is based in Bengaluru, India.
Ramkumar Nagaraj (Golden Kubestronaut, Adobe) is a Senior Computer Scientist working on GPU infrastructure and Kubernetes platform engineering. He co-presented the same session and is based in Bengaluru, India.