

Turn on an AI coding agent’s telemetry and it throws a wall of text at you. It’s expensive to store and what’s worse, you can’t make sense of it.
It’s all OpenTelemetry native, though. So you can shape it in the Collector before sending it to a telemetry backend. Which leaves one question. What do you actually need?
The requirement isn’t to collect less, it’s to keep what answers questions
I gave Claude Code a small task. Fix two failing tests, add a few boundary tests. It did. With every content flag on, that one run produced 181 telemetry records and 289 KB of JSON.
What I needed was answers to these six questions:
| Question | What answers it |
|---|---|
| What is this costing, per model? | claude_code.cost.usage |
| Tokens per session, and how much is cache? | claude_code.token.usage by type |
| Which tools fail, and how often? | tool_result events, success |
| Are people rejecting the agent’s edits? | tool_decision events |
| Where is the latency? | llm_request spans, ttft_ms |
| What broke? | api_error events, error_class |
Every answer is a counter or a short attribute. I don’t need prompts, file bodies or diffs. If no dashboard, alert, or query reads a field, it isn’t observability. It’s storage you’re paying to index.
Where the volume actually lives
An agent runs a loop: Prompt, model call, tool call, result, decide, repeat. One interaction is a claude_code.interaction span with an llm_request child per model turn and a tool child per tool call. With OTEL_LOG_TOOL_CONTENT on, each tool span gets a tool.output event holding whatever the tool returned.
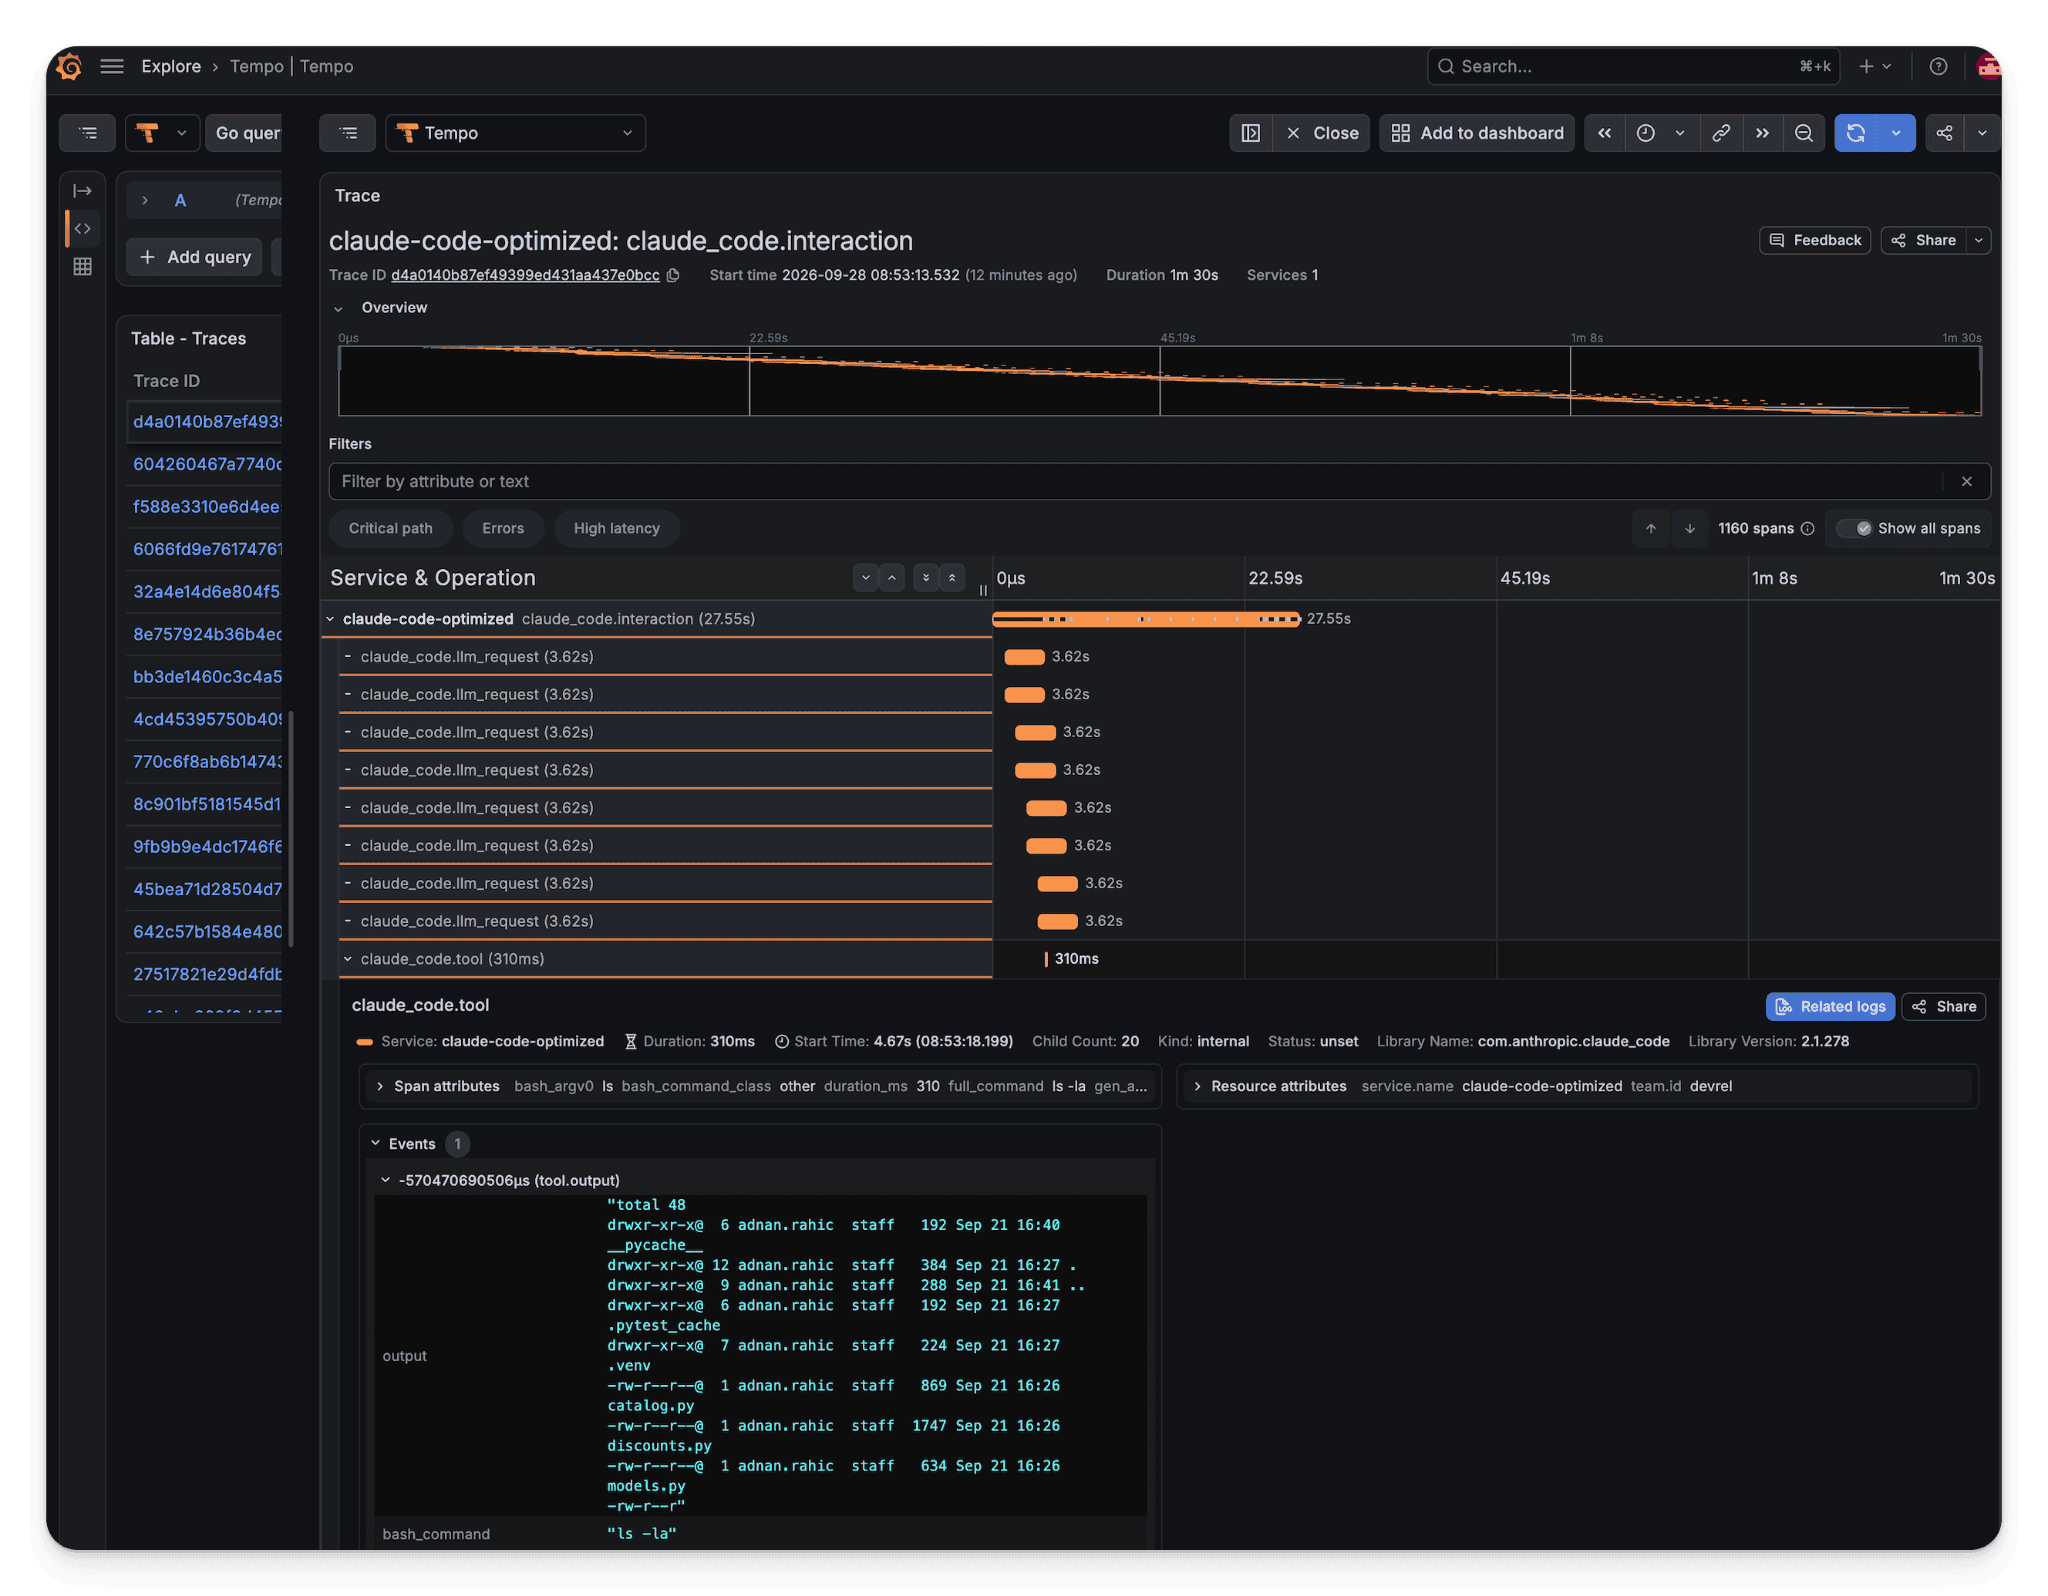
That’s a directory listing. When the tool is Read, the event is the file. A 40 KB file becomes a 40 KB span event.
Logs have the same shape. tool_result and tool_decision events carry tool_parameters, the full arguments to the tool. For a Write that’s the whole file. Same content as the span event, stored twice.
Metrics carry identity instead. Every data point has session.id, user.id, user.email and two account ids. Each new session created a fresh set of time series that never goes away. Twenty five sessions gave me 300 series for eight metrics.
The default instrumentation is written for debugging one agent run, not for running a fleet. Tool content lands in traces and logs both. Metrics are keyed on attributes that belong on the resource, or nowhere. None of that is wrong for a single developer watching a single session. It’s wrong at 200 sessions a day. The agent won’t change its defaults for you, so the pipeline has to.
What we’re building
One OTLP receiver that’ll ingest Claude Code’s internal telemetry. Every signal is fanned into two pipelines, a raw one and an optimized one, each with its own exporter, all six landing in the same Grafana LGTM container.
The raw pipeline is the control group. It carries a service.name and a batch processor. Nothing else. The optimized pipeline carries the processors we’ll add in this tutorial. The same receiver feeds both, so both paths see byte identical input.
That’s what makes the comparison honest. Both data sets land in Grafana. One dashboard reads both and draws them side by side, red for raw, green for optimized. Cardinality, bytes per minute, record counts. The gap between the lines is the storage you stop paying for.
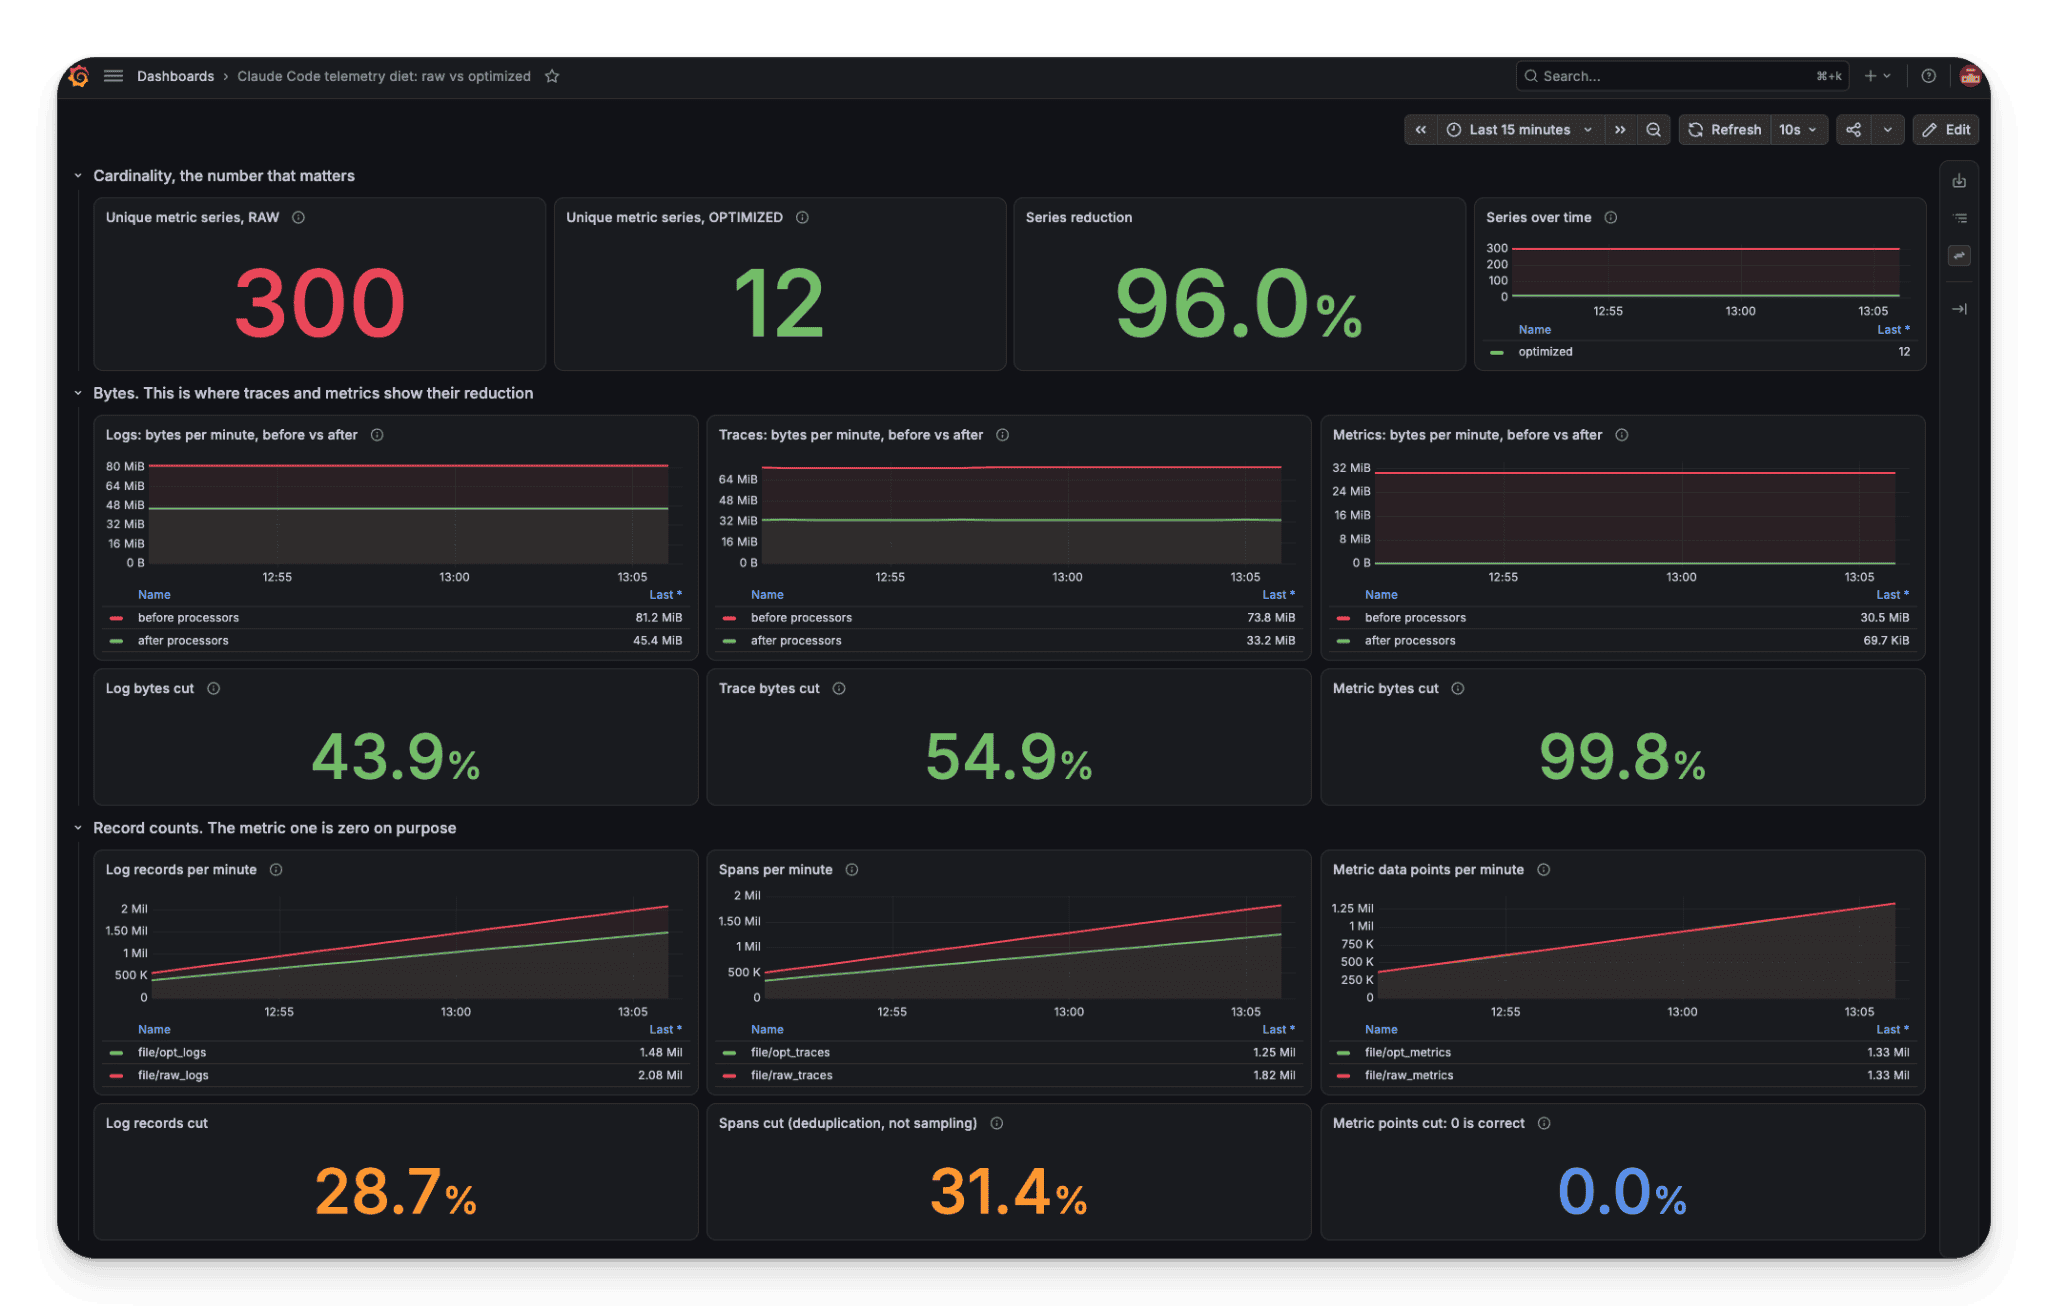
In production you’d point the raw exporters at object storage, or drop them altogether. Here they point at Grafana because I want to show you the difference.
# docker-compose.yaml
services:
  lgtm:
    image: grafana/otel-lgtm:0.33.1
    ports:
      - "3000:3000"
  collector:
    image: otel/opentelemetry-collector-contrib:0.161.0
    depends_on: [lgtm]
    volumes:
      - ./config.yaml:/etc/otelcol-contrib/config.yaml:ro
    ports:
      - "4317:4317"
      - "4318:4318"
receivers:
  otlp:
    protocols:
      grpc:
        endpoint: 0.0.0.0:4317
      http:
        endpoint: 0.0.0.0:4318

exporters:
  otlp/lgtm_raw_logs:
    endpoint: lgtm:4317
    tls:
      insecure: true
    sending_queue:
      enabled: true
  otlp/lgtm_opt_logs:
    endpoint: lgtm:4317
    tls:
      insecure: true
    sending_queue:
      enabled: true
  # four more exactly like this:
  # otlp/lgtm_raw_metrics, otlp/lgtm_raw_traces,
  # otlp/lgtm_opt_metrics, otlp/lgtm_opt_traces

service:
  pipelines:
    logs/raw:
      receivers: [otlp]
      processors: [batch]
      exporters: [otlp/lgtm_raw_logs]
    logs/optimized:
      receivers: [otlp]
      processors: [batch]          # the reduction goes here
      exporters: [otlp/lgtm_opt_logs]
    # four more exactly like this:
    # metrics/raw, metrics/optimized, traces/raw, traces/optimized
export CLAUDE_CODE_ENABLE_TELEMETRY=1
export CLAUDE_CODE_ENHANCED_TELEMETRY_BETA=1
export OTEL_METRICS_EXPORTER=otlp
export OTEL_LOGS_EXPORTER=otlp
export OTEL_TRACES_EXPORTER=otlp
export OTEL_EXPORTER_OTLP_PROTOCOL=grpc
export OTEL_EXPORTER_OTLP_ENDPOINT=http://localhost:4317
export OTEL_LOG_USER_PROMPTS=1
export OTEL_LOG_ASSISTANT_RESPONSES=1
export OTEL_LOG_TOOL_DETAILS=1
export OTEL_LOG_TOOL_CONTENT=1
Step 2. Logs: Drop, delete, trim, hash
Filter. api_request carries a model name and a request id. Everything else on it lives in other signals. Drop the whole event. Roughly a quarter of log records.
processors:
  filter/drop_api_request:
    error_mode: ignore
    logs:
      log_record:
        - 'attributes["event.name"] == "api_request"'
Delete. Six attributes off every record. tool_parameters is the big one. prompt_length and response_length stay, so you still see size trends without the text.
transform/logs_delete_fields:
    error_mode: ignore
    log_statements:
      - context: log
        statements:
          - delete_key(log.attributes, "prompt")
          - delete_key(log.attributes, "response")
          - delete_key(log.attributes, "tool_parameters")
          - delete_key(log.attributes, "workspace.host_paths")
          - delete_key(log.attributes, "user.email")
          - delete_key(log.attributes, "terminal.type")
Hash and trim. Hash session.id and user.id, cap error at 256 characters.
 transform/logs_hash_and_trim:
    error_mode: ignore
    log_statements:
      - context: log
        statements:
          - set(log.attributes["session.id"], Substring(SHA256(log.attributes["session.id"]), 0, 16)) where log.attributes["session.id"] != nil
          - set(log.attributes["user.id"], Substring(SHA256(log.attributes["user.id"]), 0, 16)) where log.attributes["user.id"] != nil
          - set(log.attributes["error"], Substring(log.attributes["error"], 0, 256)) where log.attributes["error"] != nil and Len(log.attributes["error"]) > 256
Truncate the digest. A full SHA256 is 64 characters replacing a 36 character UUID, twice per record. The first time I ran this, log bytes went up. Sixteen hex characters is plenty.
    logs/optimized:
      receivers: [otlp]
      processors: [filter/drop_api_request, transform/logs_delete_fields, transform/logs_hash_and_trim, batch]
      exporters: [otlp/lgtm_opt_logs]
Log bytes roughly halve.
Step 3. Metrics: Delete the dimension
The problem here is cardinality, not bytes. Delete six attributes from every data point and 300 series become 12 regardless if the content flags are on or off.
 transform/metrics_delete_fields:
    error_mode: ignore
    metric_statements:
      - context: datapoint
        statements:
          - delete_key(datapoint.attributes, "session.id")
          - delete_key(datapoint.attributes, "user.account_uuid")
          - delete_key(datapoint.attributes, "user.account_id")
          - delete_key(datapoint.attributes, "user.id")
          - delete_key(datapoint.attributes, "user.email")
          - delete_key(datapoint.attributes, "terminal.type")
Sum the sessions, then convert. Claude Code exports delta temporality and Prometheus wants cumulative, so delta_to_cumulative has to sit at the end of this pipeline. With session.id gone, every running session writes into the same twelve series, and the converter only accepts points in timestamp order. Sum the sessions per window first.
  # 1. Collect two seconds of exports. The size is out of reach on purpose,
  #    so the timeout is always what flushes.
  batch/metrics_window:
    send_batch_size: 1000000
    send_batch_max_size: 0
    timeout: 2s
# 2. Put every metric of the same name under one resource.
  groupbyattrs/compact: {}
# 3. Give every point in the window the same timestamp, then sum the points
  #    whose attributes are now identical.
  transform/metrics_merge_sessions:
    error_mode: ignore
    metric_statements:
      - context: datapoint
        statements:
          - set(datapoint.time, TruncateTime(Now(), Duration("1s")))
          - set(datapoint.start_time, datapoint.time)
      - context: metric
        statements:
          - aggregate_on_attributes("sum")

  # 4. Only now convert. On the raw pipeline too, or the raw side never
  #    reaches Prometheus and there is nothing to compare against.
  delta_to_cumulative:
    max_stale: 5m
    metrics/optimized:
      receivers: [otlp]
      processors: [transform/metrics_delete_fields, batch/metrics_window, groupbyattrs/compact, transform/metrics_merge_sessions, delta_to_cumulative, batch]
      exporters: [otlp/lgtm_opt_metrics]
Batch and wait two seconds, give everything one timestamp, add up the points, then convert. Optimized totals match raw to within half a percent.
Note: This only works if one Collector sees every session, so behind a load balancer it belongs on a single gateway.
Metric bytes fall by more than any other signal. Six attributes on every point was most of the payload. And, removing the session.id keeps the cardinality in check.
Step 4. Traces: Trim, don’t sample
Traces are the biggest stream and the one people want to sample first. I’ll use one filter and two transforms instead.
Filter. Drop tool.execution when the tool succeeded. The parent span already has tool_name, duration_ms and result_tokens. The child is only valuable when it fails. This alone removes a fifth of the trace bytes.
filter/drop_successful_tool_execution:
    error_mode: ignore
    traces:
      span:
        - 'name == "claude_code.tool.execution" and attributes["success"] == true and attributes["error_class"] == nil'
Span context. Delete what repeats, hash what identifies.
transform/traces_span:
    error_mode: ignore
    trace_statements:
      - context: span
        statements:
          - delete_key(span.attributes, "user_prompt") where span.name == "claude_code.interaction"
          - delete_key(span.attributes, "user.email")
          - delete_key(span.attributes, "terminal.type")
          - delete_key(span.attributes, "user.account_uuid")
          - delete_key(span.attributes, "user.account_id")
          - delete_key(span.attributes, "organization.id")
          - delete_key(span.attributes, "span.type")
          - delete_key(span.attributes, "tool_use_id")
          - delete_key(span.attributes, "request_id")
          - delete_key(span.attributes, "model")
          - delete_key(span.attributes, "stop_reason")
          - delete_key(span.attributes, "full_command") where span.attributes["full_command"] != nil and IsMatch(span.attributes["full_command"], "(sk-ant-|gh[pousr]_|AKIA[0-9A-Z]{16}|(?i)(password|secret|token)\\s*=)")
          - set(span.attributes["user.id"], Substring(SHA256(span.attributes["user.id"]), 0, 16)) where span.attributes["user.id"] != nil
          - set(span.attributes["session.id"], Substring(SHA256(span.attributes["session.id"]), 0, 16)) where span.attributes["session.id"] != nil
Twelve deletes. tool_use_id, request_id, model and stop_reason each have a twin in gen_ai.tool.call.id, gen_ai.response.id, gen_ai.request.model and gen_ai.response.finish_reasons. Keep the gen_ai.* semconv names. A dashboard that has never heard of Claude Code still understands those. The full_command statement is the one secret guard, on the one field that can carry a secret.
Span event context. Cap content, output and diff at 512 characters, move them onto the span, and add content_truncated_by_pipeline so nobody mistakes a cut body for a short one.
  transform/traces_spanevent:
    error_mode: ignore
    trace_statements:
      - context: spanevent
        statements:
          - set(span.attributes["content_truncated_by_pipeline"], true) where spanevent.attributes["content"] != nil and Len(spanevent.attributes["content"]) > 512
          - set(span.attributes["content"], Substring(spanevent.attributes["content"], 0, 512)) where spanevent.attributes["content"] != nil and Len(spanevent.attributes["content"]) > 512
          - delete_key(spanevent.attributes, "content")
          # the same three statements for "output" and for "diff"
Every span survives. The ls -la stays readable. A 40 KB file read does not, and that’s the point.
traces/optimized:
      receivers: [otlp]
      processors: [filter/drop_successful_tool_execution, transform/traces_span, transform/traces_spanevent, batch]
      exporters: [otlp/lgtm_opt_traces]
Trace bytes roughly halve without sampling.
Sampling would cut further. I left it out because it trades away the one thing traces are for, pulling up the specific run someone is asking about. Agent interactions also run for minutes, and tail_sampling decides after decision_wait, so a tool that fails at minute three arrives after the verdict. If truncation isn’t enough, this is the next step. This block below keeps errors, slow traces, and 10 percent of the rest.
tail_sampling:
    decision_wait: 120s
    num_traces: 50000
    decision_cache:
      sampled_cache_size: 100000
      non_sampled_cache_size: 100000
    policies:
      - name: errors
        type: status_code
        status_code:
          status_codes: [ERROR]
      - name: slow
        type: latency
        latency:
          threshold_ms: 60000
      - name: baseline
        type: probabilistic
        probabilistic:
          sampling_percentage: 10
Step 5. Prove nothing you needed was lost
The objection is always the same.
“We lose data.”
Let’s check. The Collector counts its own bytes. Turn on detailed self telemetry and send it to the same Grafana.
service:
  telemetry:
    metrics:
      level: detailed
      readers:
        - periodic:
            interval: 10000
            exporter:
              otlp:
                protocol: grpc
                endpoint: http://lgtm:4317
                insecure: true
Name the two paths and tag the metric points so the queries can tell them apart. Four processor definitions, then every pipeline picks up the ones it needs.
resource/name_raw:
    attributes:
      - {key: service.name, value: claude-code-raw, action: upsert}
  resource/name_optimized:
    attributes:
      - {key: service.name, value: claude-code-optimized, action: upsert}

  transform/tag_raw:
    error_mode: ignore
    metric_statements:
      - context: datapoint
        statements:
          - set(datapoint.attributes["pipeline"], "raw")
  transform/tag_optimized:
    error_mode: ignore
    metric_statements:
      - context: datapoint
        statements:
          - set(datapoint.attributes["pipeline"], "optimized")
service:
  pipelines:
    logs/raw:
      receivers: [otlp]
      processors: [resource/name_raw, batch]
      exporters: [otlp/lgtm_raw_logs]
    logs/optimized:
      receivers: [otlp]
      processors: [filter/drop_api_request, transform/logs_delete_fields, transform/logs_hash_and_trim, resource/name_optimized, batch]
      exporters: [otlp/lgtm_opt_logs]

    metrics/raw:
      receivers: [otlp]
      processors: [transform/tag_raw, resource/name_raw, delta_to_cumulative, batch]
      exporters: [otlp/lgtm_raw_metrics]
    metrics/optimized:
      receivers: [otlp]
      processors: [transform/metrics_delete_fields, transform/tag_optimized, resource/name_optimized, batch/metrics_window, groupbyattrs/compact, transform/metrics_merge_sessions, delta_to_cumulative, batch]
      exporters: [otlp/lgtm_opt_metrics]

    traces/raw:
      receivers: [otlp]
      processors: [resource/name_raw, batch]
      exporters: [otlp/lgtm_raw_traces]
    traces/optimized:
      receivers: [otlp]
      processors: [filter/drop_successful_tool_execution, transform/traces_span, transform/traces_spanevent, resource/name_optimized, batch]
      exporters: [otlp/lgtm_opt_traces]
The dashboard is three query shapes.
# cardinality, from the data itself
count by (pipeline) ({__name__=~”claude_code_.*”, pipeline=~”raw|optimized”})
# bytes per minute, per signal, before and after
sum(increase(otelcol_exporter_enqueue_size_bytes_sum{exporter=”otlp/lgtm_raw_logs”}[1m]))
sum(increase(otelcol_exporter_enqueue_size_bytes_sum{exporter=”otlp/lgtm_opt_logs”}[1m]))
# record counts, per exporter
sum by (exporter) (otelcol_exporter_sent_log_records_total)
otelcol_exporter_enqueue_size_bytes only exists at level: detailed with sending_queue enabled, and it’s labelled by exporter, not signal.
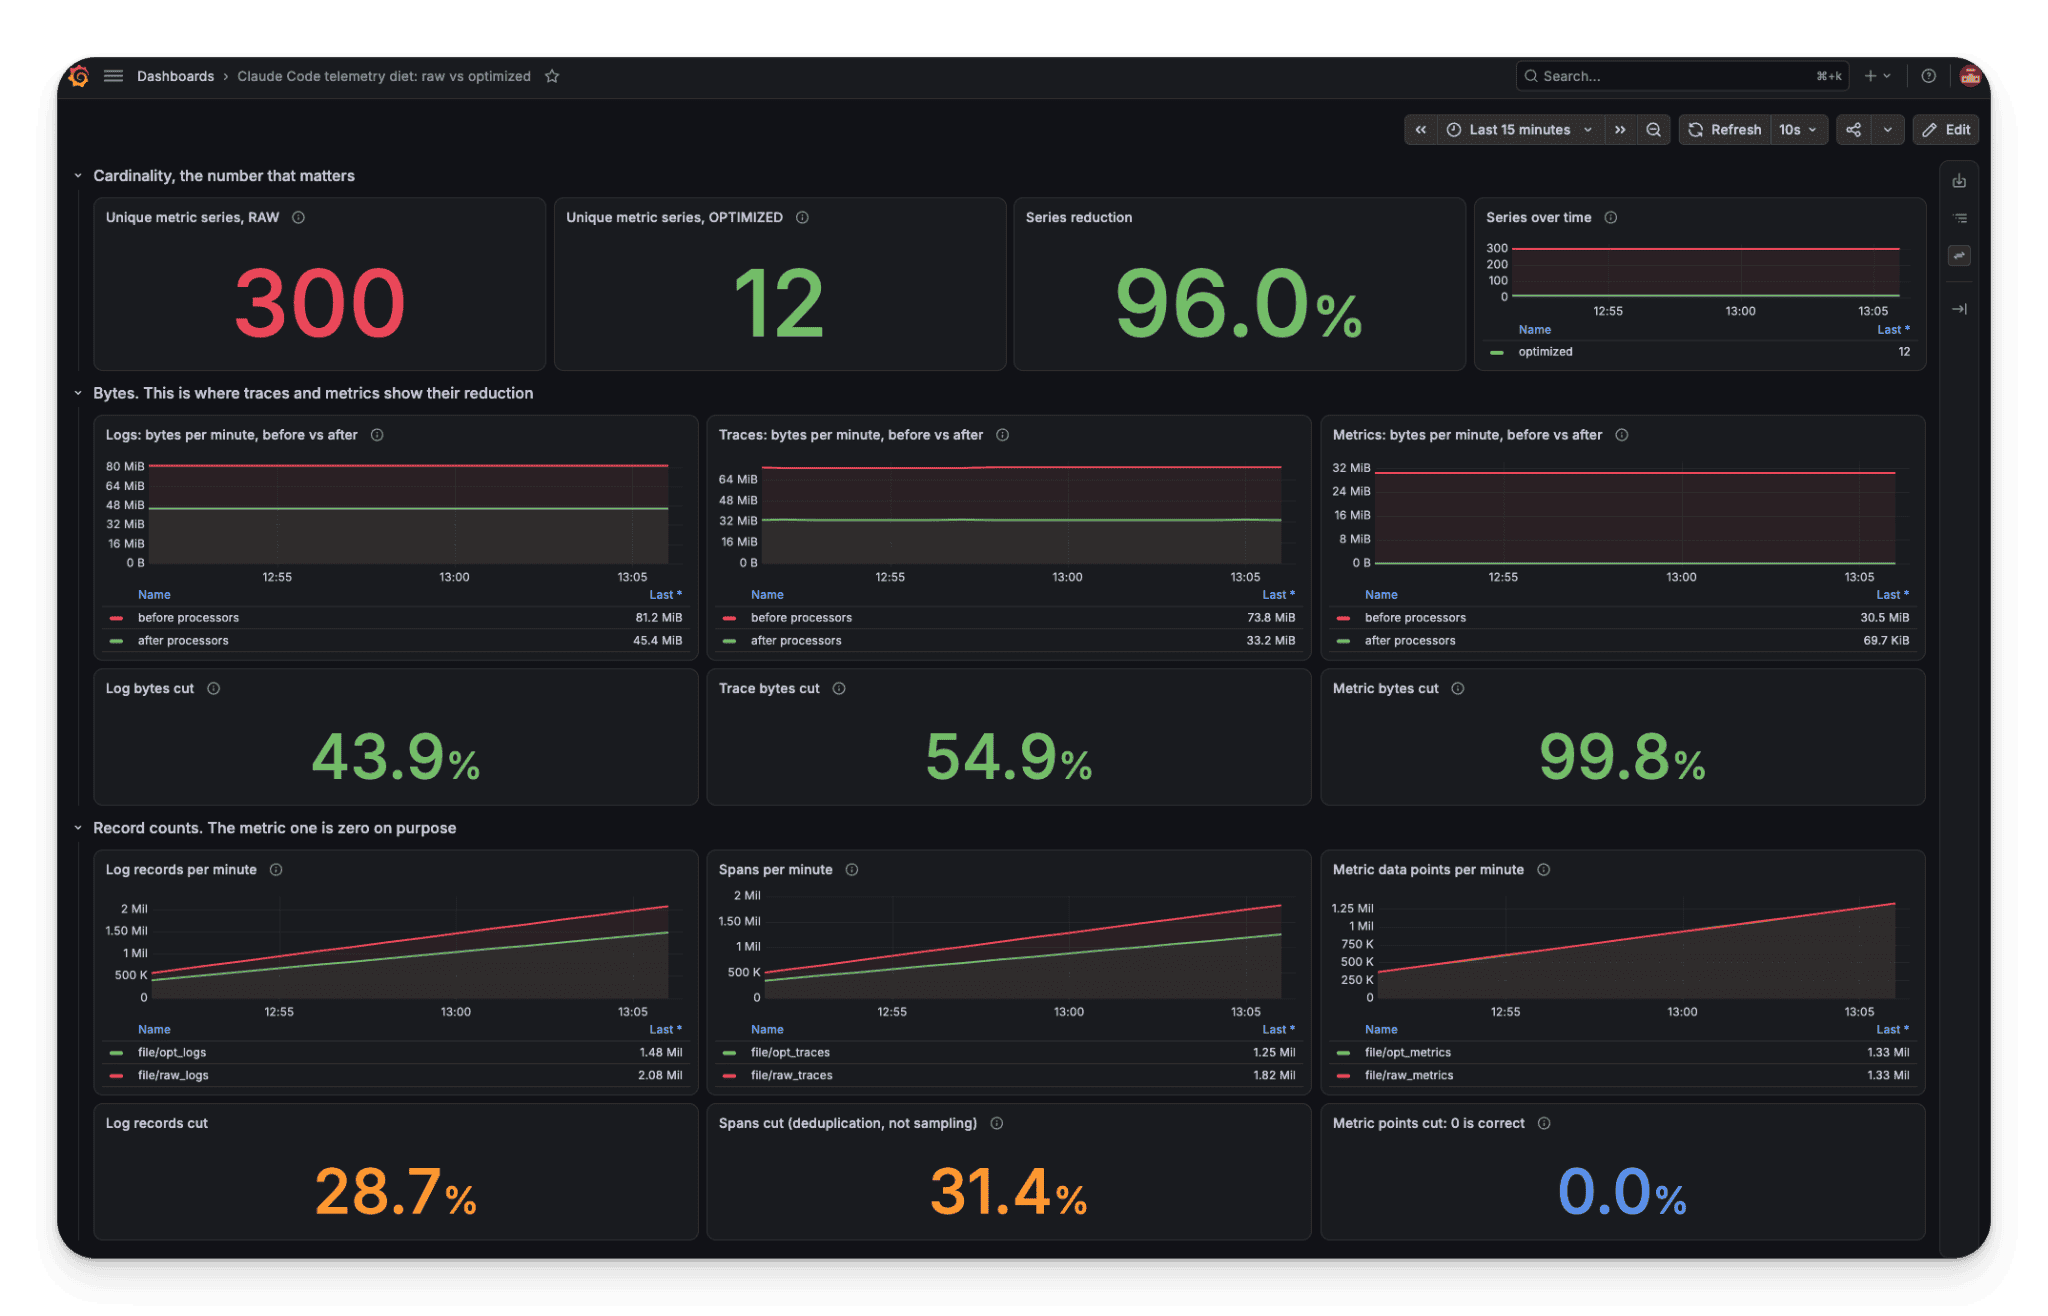
Top row, cardinality. 300 raw, 12 optimized. In a real fleet the red line climbs with every session. Green is flat because there’s no per session dimension left to grow along. Middle row, bytes per minute per signal. The gap is what you stop paying for. Bottom row, record counts. Logs lose api_request, traces lose successful tool.execution, metrics arrive pre-summed. None of it is sampling.
The second dashboard reads only the optimized stream and asks the six questions.
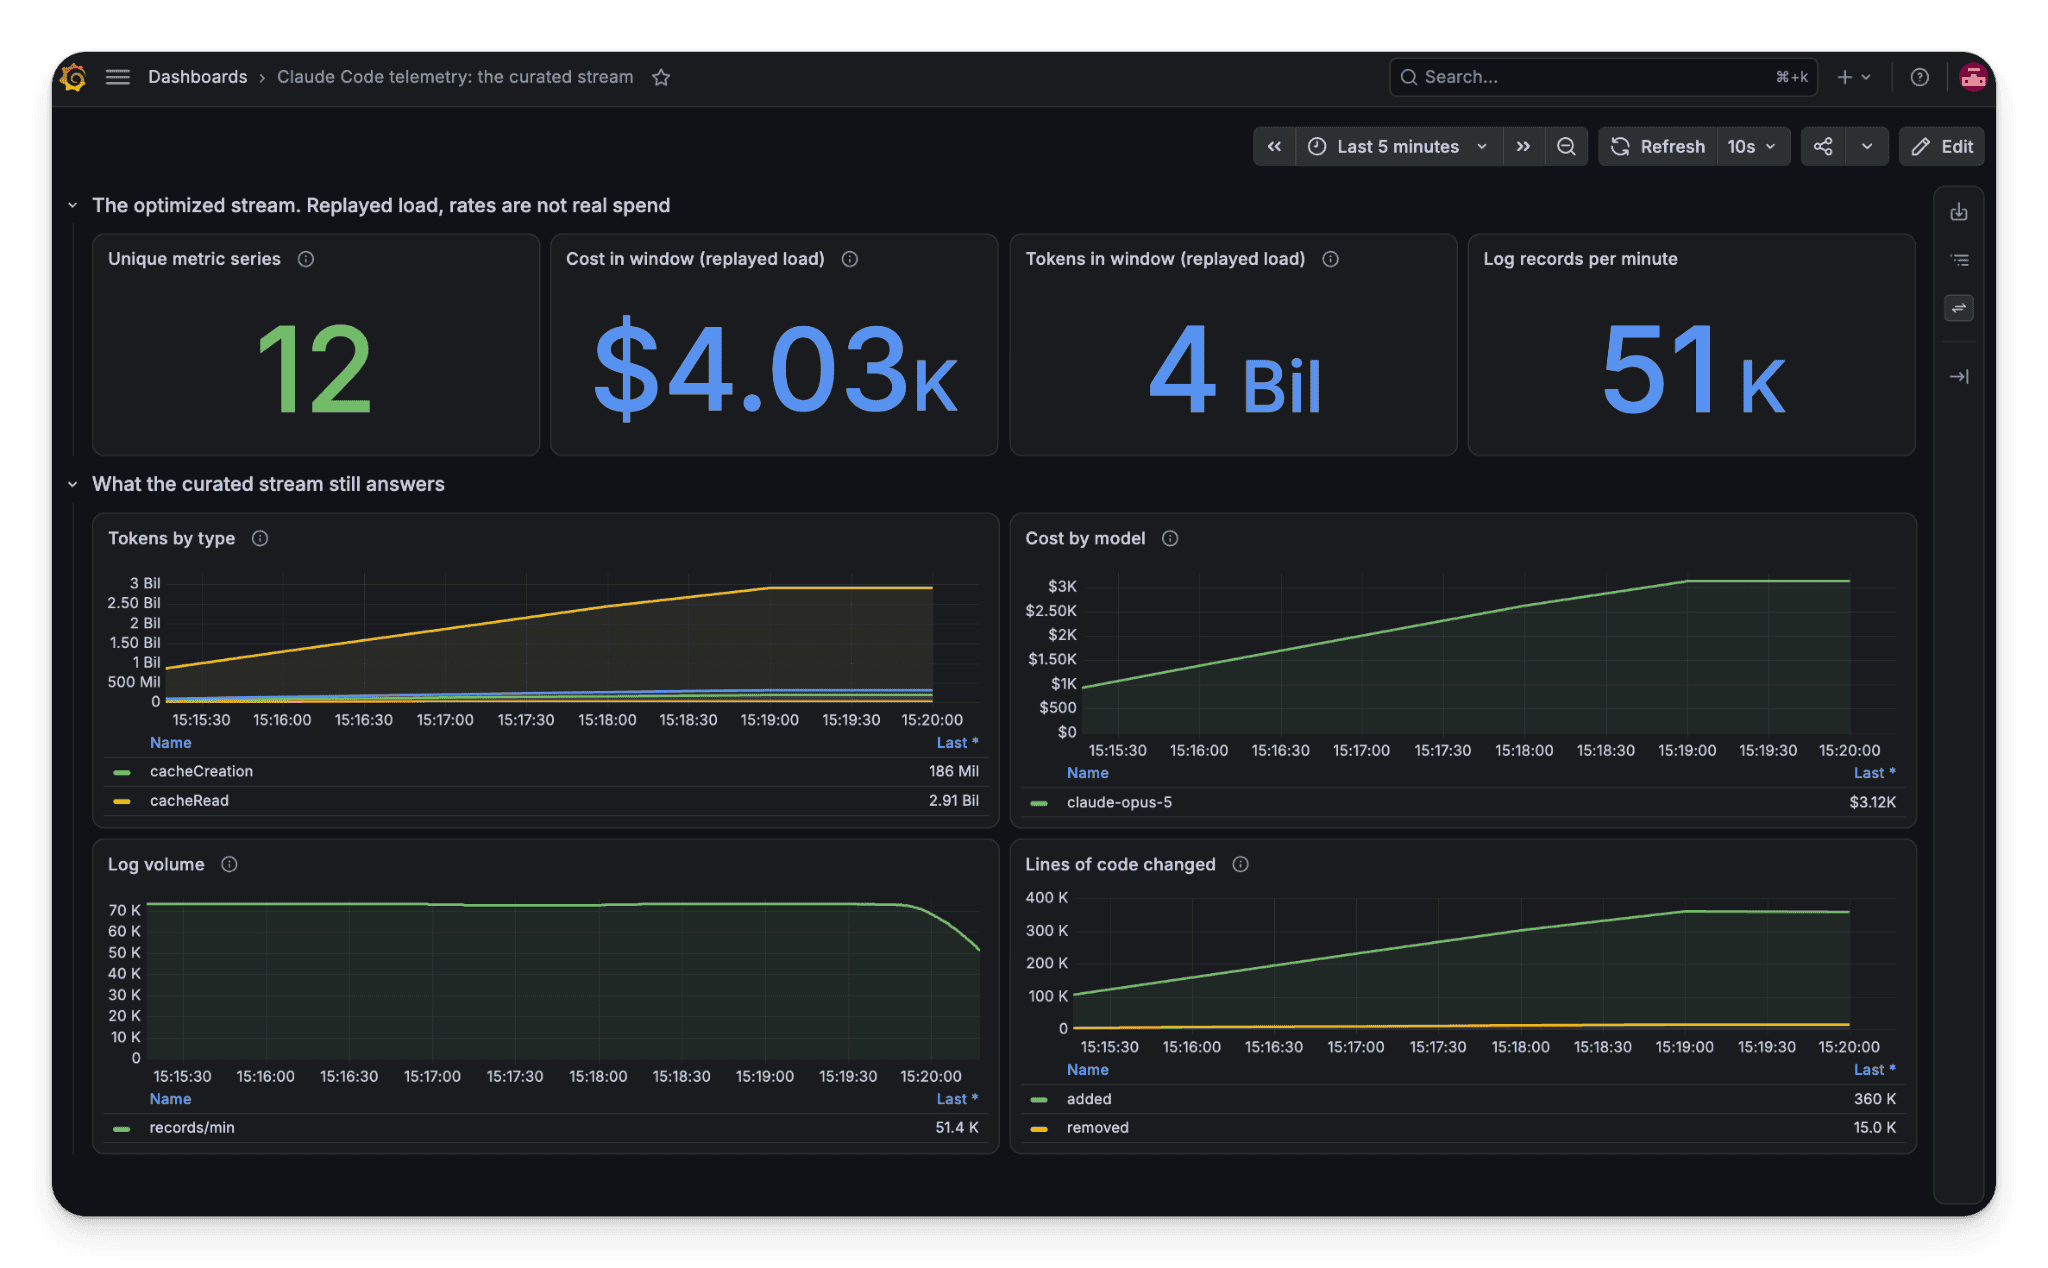
Tokens by type, cost by model, log volume, lines added and removed. Twelve series, every panel populated, and all my questions answered.
What’s next?
If you’ve written off agent telemetry as “all prompts, nothing to dashboard,” the constraint is narrower than it looks. You don’t need the transcript in your backend. You need six answers. Use the layout above to configure processing and start cutting storage costs right away.