


If you run GPU workloads on Kubernetes — vLLM, Triton, training jobs, or the newer agentic inference stacks — you’ve probably hit a familiar problem: the default autoscaling path still reasons about CPU and memory, while the GPU that is actually doing the work stays hidden. That mismatch wastes expensive accelerator capacity, pushes up inference latency, and creates unnecessary power draw at exactly the point where enterprises are trying to scale LLMs and Agentic Ops responsibly.
I wanted KEDA to scale on the signals that matter for GPU workloads: utilization, memory, temperature, and power draw. In practice, this is not only a cost problem. It is also a GreenOps problem, because wasted GPU cycles translate directly into wasted energy and higher Scope 3 emissions.
Turns out, that is harder than it sounds.
The problem
KEDA is built with CGO_ENABLED=0. The NVIDIA Management Library (NVML) – the standard way to read GPU metrics – requires CGO. So you can’t just add a GPU scaler to KEDA core the way you’d add a Prometheus or Kafka scaler.
There’s a second problem too. KEDA’s operator runs as a single deployment. NVML calls are local — they read metrics from the GPU on the same node. You can’t query GPU 0 on node-A from a pod running on node-B.
So a native KEDA scaler was off the table. I needed something that runs on every GPU node and exposes metrics over the network.
The architecture
To solve this, we can build a custom DaemonSet (you can view my reference implementation here: keda-gpu-scaler) that runs on GPU nodes. In this architecture, each pod:
1. Calls NVML via [go-nvml] to read local GPU metrics.
2. Serves them over gRPC using KEDA’s ExternalScaler interface.
3. KEDA operator connects to the scaler and drives HPA decisions.
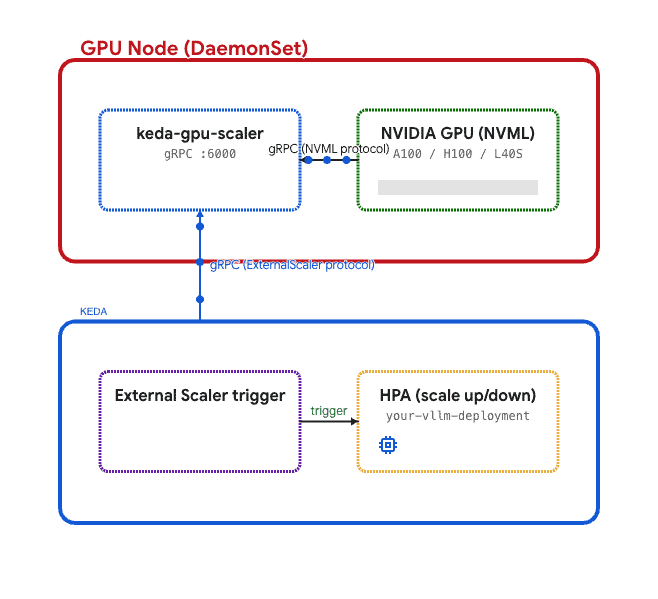
This is the same pattern Kubernetes uses for device plugins and the metrics server — a per-node agent that collects local hardware data.
What you can scale on
The scaler exposes these metrics per GPU:
- gpu_utilization – SM (compute) utilization percentage
- memory_utilization – memory controller utilization
- memory_used_percent – VRAM usage as a percentage
- temperature – GPU die temperature in celsius
- power_draw – current power consumption in watts
For multi-GPU nodes, you pick an aggregation: `max`, `min`, `avg`, or `sum`. Or target a specific GPU index.
Pre-built profiles
Most people run one of a few GPU workload types, so I added profiles that set sensible defaults:
triggers:
  - type: external
    metadata:
      scalerAddress: "keda-gpu-scaler.gpu-scaler.svc.cluster.local:6000"
profile: "vllm-inference"| Profile | Metric | Target | Activation | Use Case |
| vllm-inference | memory_used_percent | 80% | 5% | LLM serving, scale-to-zero |
| triton-inference | gpu_utilization | 75% | 10% | Triton model serving |
| training | gpu_utilization | 90% | 0% | Training jobs, no scale-to-zero |
| batch | memory_used_percent | 70% | 1% | Batch inference, aggressive scale-down |
You can override any value. Or skip profiles entirely and set metricType, targetValue, activationThreshold directly.
Quick start
Install with Helm
helm install gpu-scaler deploy/helm/keda-gpu-scaler \
  --namespace gpu-scaler --create-namespace
The chart deploys a DaemonSet that targets nodes with nvidia.com/gpu.present=true and tolerates the nvidia.com/gpu taint. It uses the NVIDIA container runtime by default — if your cluster doesn’t have that, set nvmlHostMounts.enabled=true to mount the device files directly.
Create a ScaledObject
apiVersion: keda.sh/v1alpha1
kind: ScaledObject
metadata:
  name: vllm-gpu-scaler
spec:
  scaleTargetRef:
    name: vllm-deployment
  minReplicaCount: 0
  maxReplicaCount: 8
  triggers:
    - type: external
      metadata:
        scalerAddress: "keda-gpu-scaler.gpu-scaler.svc.cluster.local:6000"
        profile: "vllm-inference"
That’s it. KEDA will now scale your vLLM deployment based on GPU memory usage, including scale-to-zero when idle.
Testing without GPUs
The scaler has a mock collector mode for testing. The e2e test suite spins up a real gRPC server with fake GPU data and exercises the full IsActive → GetMetricSpec → GetMetrics flow. 11 tests covering profiles, error paths, streaming, aggregation modes. All run in CI without any GPU hardware.
go test -v -tags=e2e -race ./tests/e2e/What’s next
Building custom external scalers is a powerful way to extend the CNCF ecosystem. It shows how a graduated project like KEDA can remain flexible, allowing engineers to build custom DaemonSets that fit newer AI infrastructure patterns without forcing every workload into the same abstraction.
The code snippets and repository shared above serve as an open-source reference implementation of this architecture. If you’re running GPU workloads on Kubernetes and want autoscaling that natively understands GPU metrics, exploring KEDA’s ExternalScaler interface is a fantastic place to start.
GitHub: [keda-gpu-scaler]