
As cloud-native architectures continue to mature, observability has become a foundational requirement rather than an optional add-on. According to the Cloud Native Computing Foundation, OpenTelemetry continues to grow its contributor base and remains the second highest velocity project in CNCF, becoming the “kubernetes” of the o11y world. Its rapid growth and strong community momentum reflect accelerating adoption among Kubernetes and cloud-native teams.
As organizations standardize on OpenTelemetry, one architectural question consistently arises: should telemetry be collected using an OpenTelemetry Collector, an agent, or a combination of both? In this guide, we demystify the OpenTelemetry Collector vs. agent debate, explain how each fits into the OpenTelemetry architecture, and help you choose the right approach for building efficient, scalable observability pipelines.
What are the main components of the OpenTelemetry architecture?
Before exploring the OpenTelemetry Collector vs agent differences, it’s essential to understand how both components function within the OpenTelemetry architecture.
What is the OpenTelemetry Collector?
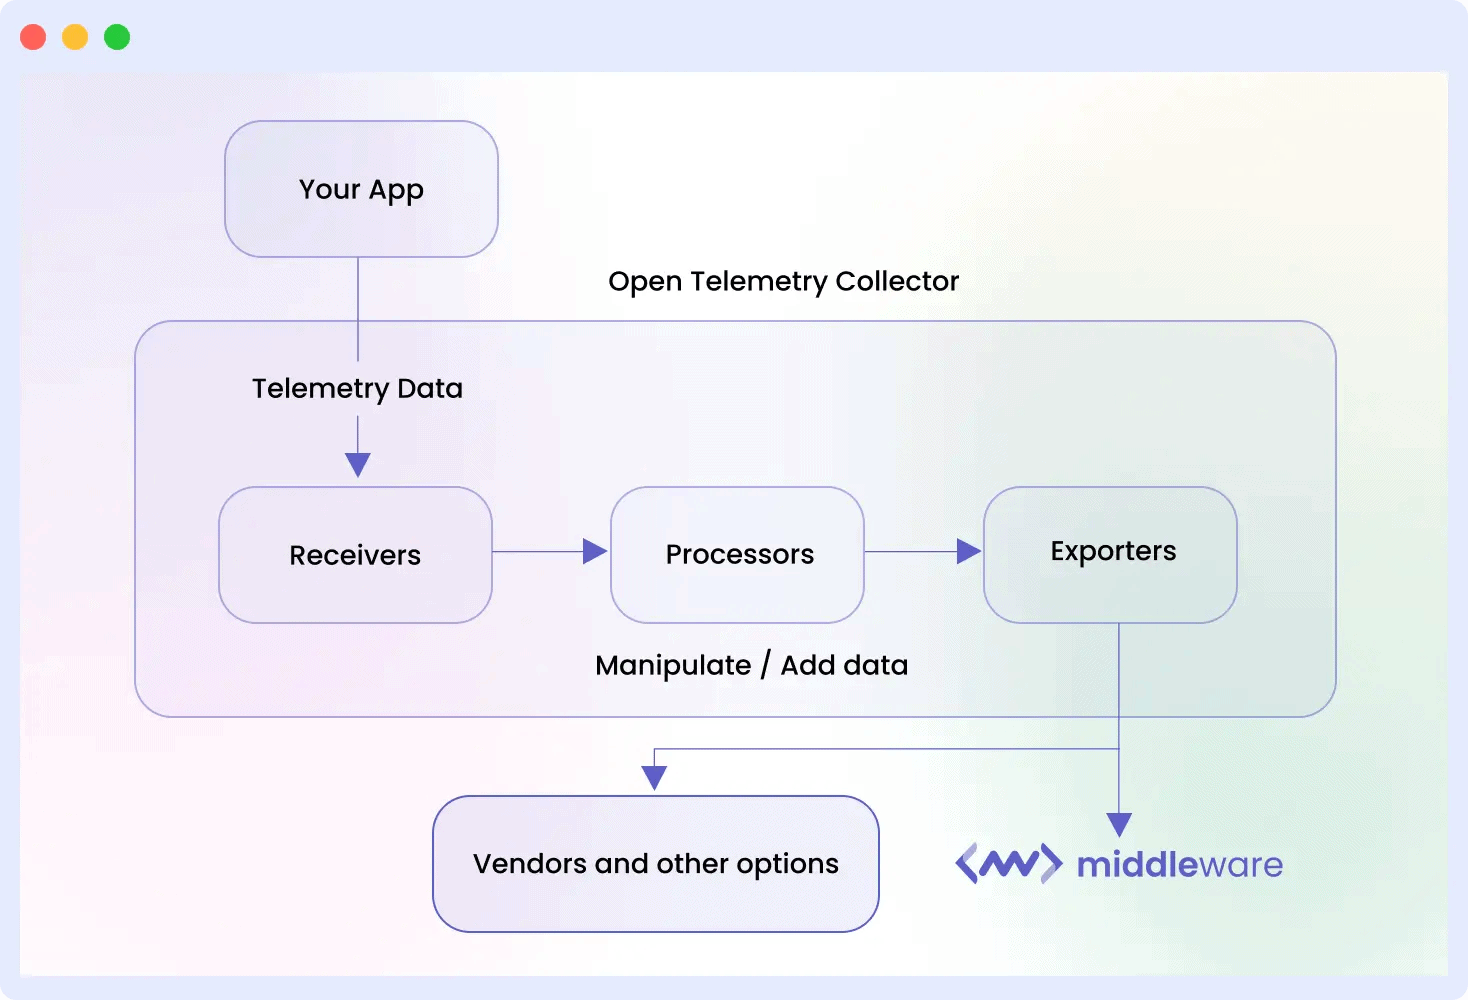
The OpenTelemetry Collector acts as a centralized service for managing telemetry data. When comparing the OpenTelemetry Collector vs agent, the Collector serves as the central processing hub for telemetry pipelines.
It is one service that collects traces, metrics, and logs from your applications, sorts them, and then sends them to the observability tools or backends you employ. In a sense, it is the center of your monitoring environment.
Instead of your apps talking directly to monitoring backends, the Collector sits between them. It normalizes and prepares all data before forwarding it to the destination.
Collector: Central hub for telemetry aggregation, transformation, and export.
What makes Collector so useful?
- Data Collection: The Collector can receive telemetry from various sources through receivers, including OpenTelemetry SDKs, agents, and other observability tools.
- Data Processing: This step allows you to clean up the data before it is stored. You can filter out the junk you don’t need, batch it up for better efficiency, or tweak it in other ways. You can also add helpful context (metadata) and reduce noise before sending it off.
- Data Exporting: Once the data is processed, this feature takes over. It uses exporters to send the data to your storage and analysis tools (backends). The big benefit here is that it doesn’t matter what observability tools you’re using this makes the data compatible with your entire stack.
What is the OpenTelemetry agent?
The OpenTelemetry agent is a lightweight process that runs alongside your applications to collect telemetry data locally with minimal overhead before forwarding it to a Collector or backend. You can think of it as a lightweight sidecar or daemon that runs along with your app and collects telemetry data from it directly.
Agent: Lightweight sidecar for data capture at the application level.
Its main job is straightforward: capture and forward. The agent collects traces, metrics, and logs emitted by your app and sends them (often to a Collector) with minimal processing.
Where does it differ from the Collector?
- The agent focuses on local data collection, which captures telemetry as close to the source as possible.
- It performs minimal data processing, keeping overhead low to minimize impact on app performance.
- It’s ideal for containerized or microservices environments, where deploying an agent alongside each service ensures complete visibility and control.
Within the OpenTelemetry ecosystem, the agent, Collector, and SDKs integrate with observability tools such as Prometheus, Jaeger, and Grafana. Together, they form a complete pipeline for metrics, logs, and traces across Kubernetes and hybrid cloud environments.
Together, the agent and Collector form the foundation of an observability pipeline.
Feature-by-feature comparison
The key difference between the OpenTelemetry Collector and OpenTelemetry agent lies in their scope: the agent collects data locally, while the Collector aggregates and processes telemetry data centrally before exporting it to backends.
Here’s a breakdown:
OpenTelemetry Collector vs. agent
| Feature | OpenTelemetry Collector | OpenTelemetry agent |
| Deployment model | Runs as a centralized service (standalone, gateway, or clustered) that gathers telemetry from multiple sources. | Deployed alongside applications (as a sidecar or daemonset) to collect telemetry data locally. |
| Primary role | Acts as a data pipeline receives, processes, and exports telemetry data to various observability platforms. | Functions as a lightweight collector focused on capturing and forwarding raw data from application instances. |
| Data processing capabilities | Offers advanced processing such as batching, filtering, sampling, and transformation before exporting. | Performs minimal processing, prioritizing speed and low overhead. |
| Scalability | Highly scalable, capable of handling data from hundreds of services or instances. | Scales naturally with the number of application instances each handles its own telemetry. |
| Performance impact | Offloads heavy processing away from apps, reducing runtime load. | Very lightweight minimal impact on application performance. |
| Flexibility and customization | Extensive customization via multiple receivers, processors, and exporters. Easily integrates with diverse observability tools. | Simpler configuration with limited customization, ideal for consistent deployments. |
| Security & Compliance | Requires proper access control, TLS encryption, and authentication for centralized communication. | Operates within the application’s trusted boundary, reducing exposure but limited to local scope. |
| Integration and compatibility | Compatible with multiple backends (Prometheus, Jaeger, Elastic, etc.) and supports hybrid or multi-cloud setups. | Tightly integrated with OpenTelemetry SDKs and supports major programming languages. |
| Best fit | Ideal for centralized, large-scale environments that need data aggregation and transformation. | Best for application-level observability and containerized or distributed architectures. |
Key takeaway:
Use the Collector when you need centralized control and scalability; use the agent when you want localized, low-overhead telemetry capture near the source.
Final recommendations
The right choice between the OpenTelemetry Collector and agent depends on your system’s size and observability goals.
- Use the Collector for centralized data aggregation and transformation across multiple services.
- Use the Agent for lightweight, local telemetry collection near your applications.
- For most setups, combining both delivers the best performance and scalability.
This Member Blog was originally published on the Middleware blog and is republished here with permission.