

Kubernetes and unexpected cloud spend: taming, not riding, the tiger
Cloud spending has jumped dramatically with the arrival of Kubernetes, and while most organizations lack a clear insight, they are taking firm steps towards establishing cost control.
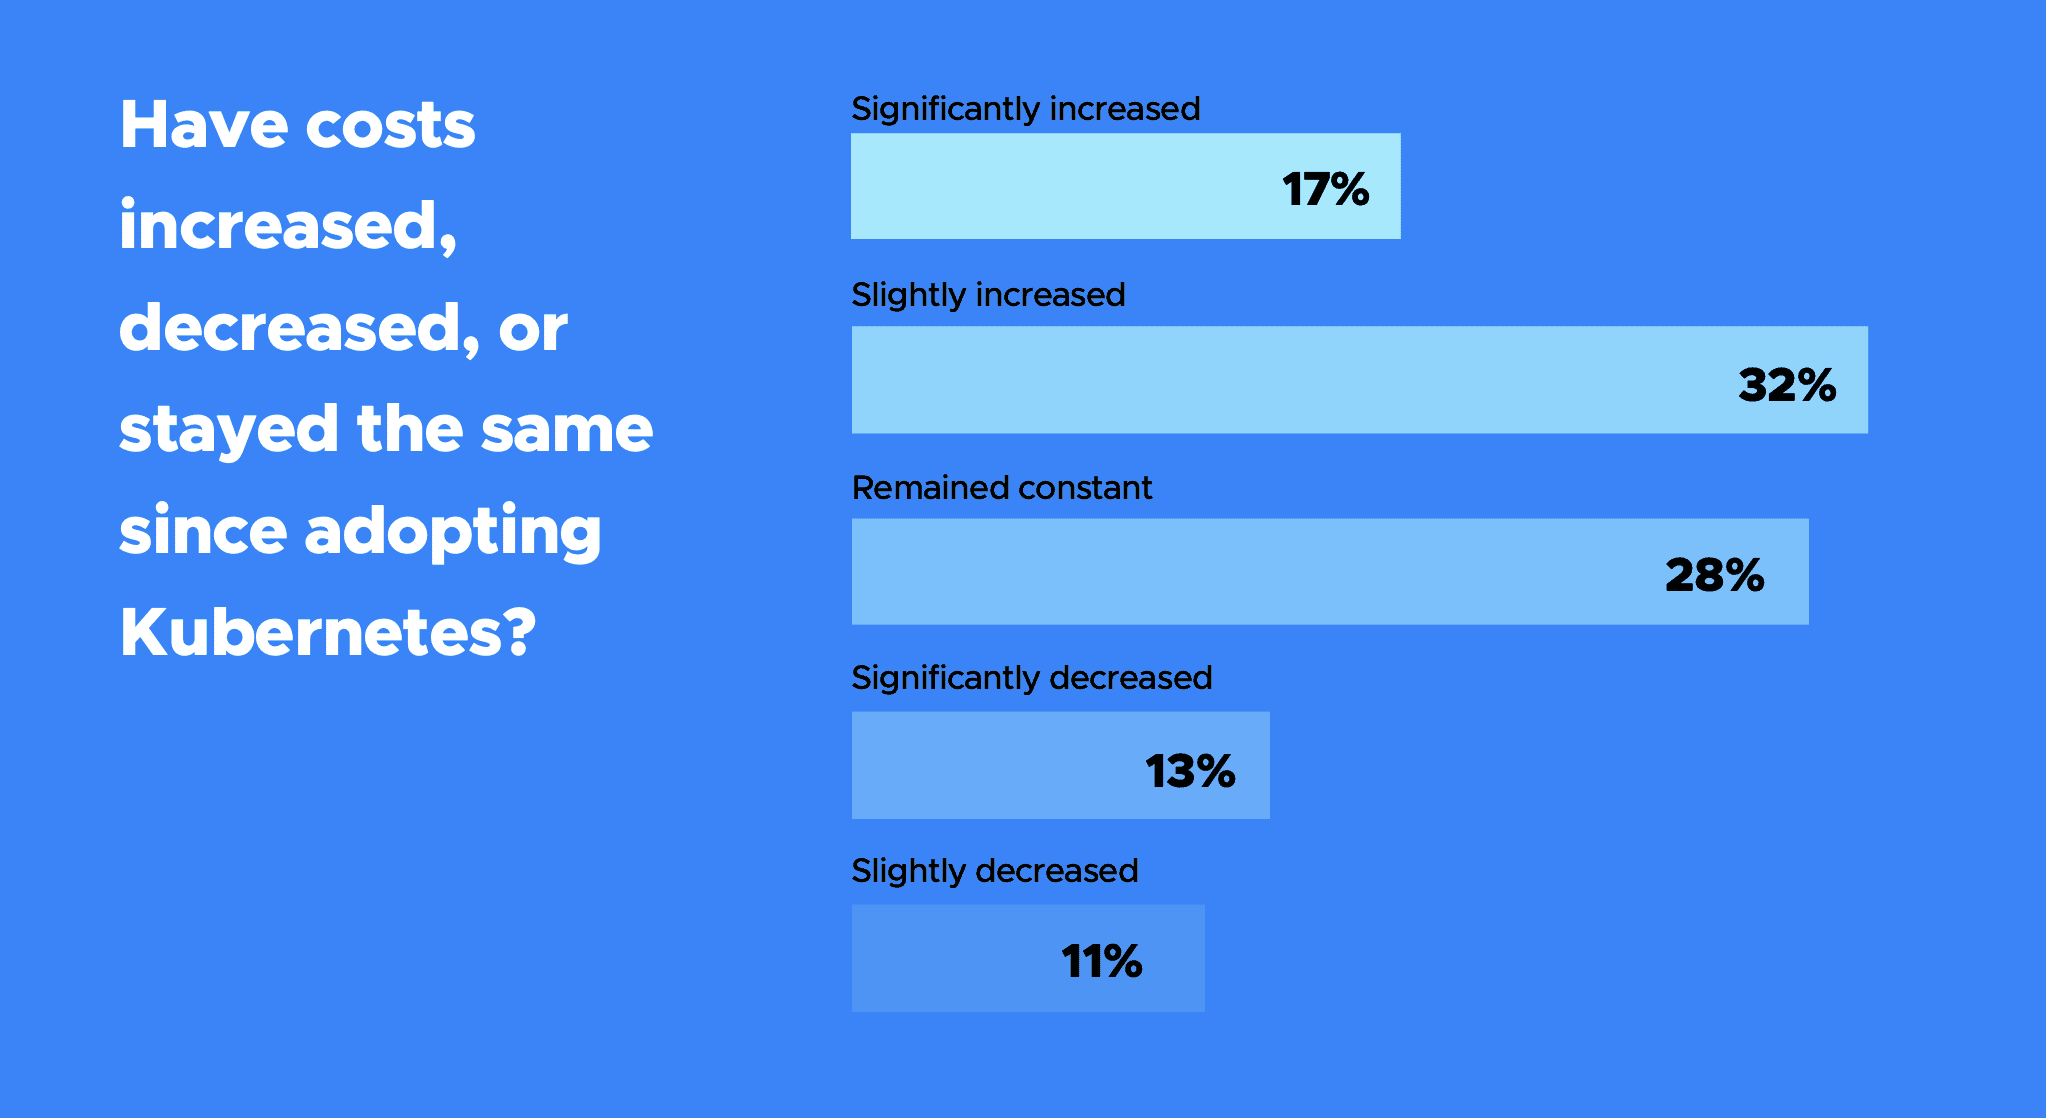
Kubernetes has driven cloud spend up for nearly half (49%) of those surveyed in CNCF’s latest microsurvey report on cloud native FinOps and cloud financial management (CFM).
Respondents told us their costs had increased slightly or significantly after implementing the popular orchestration platform. Just under a third (28%) said their costs were unchanged.
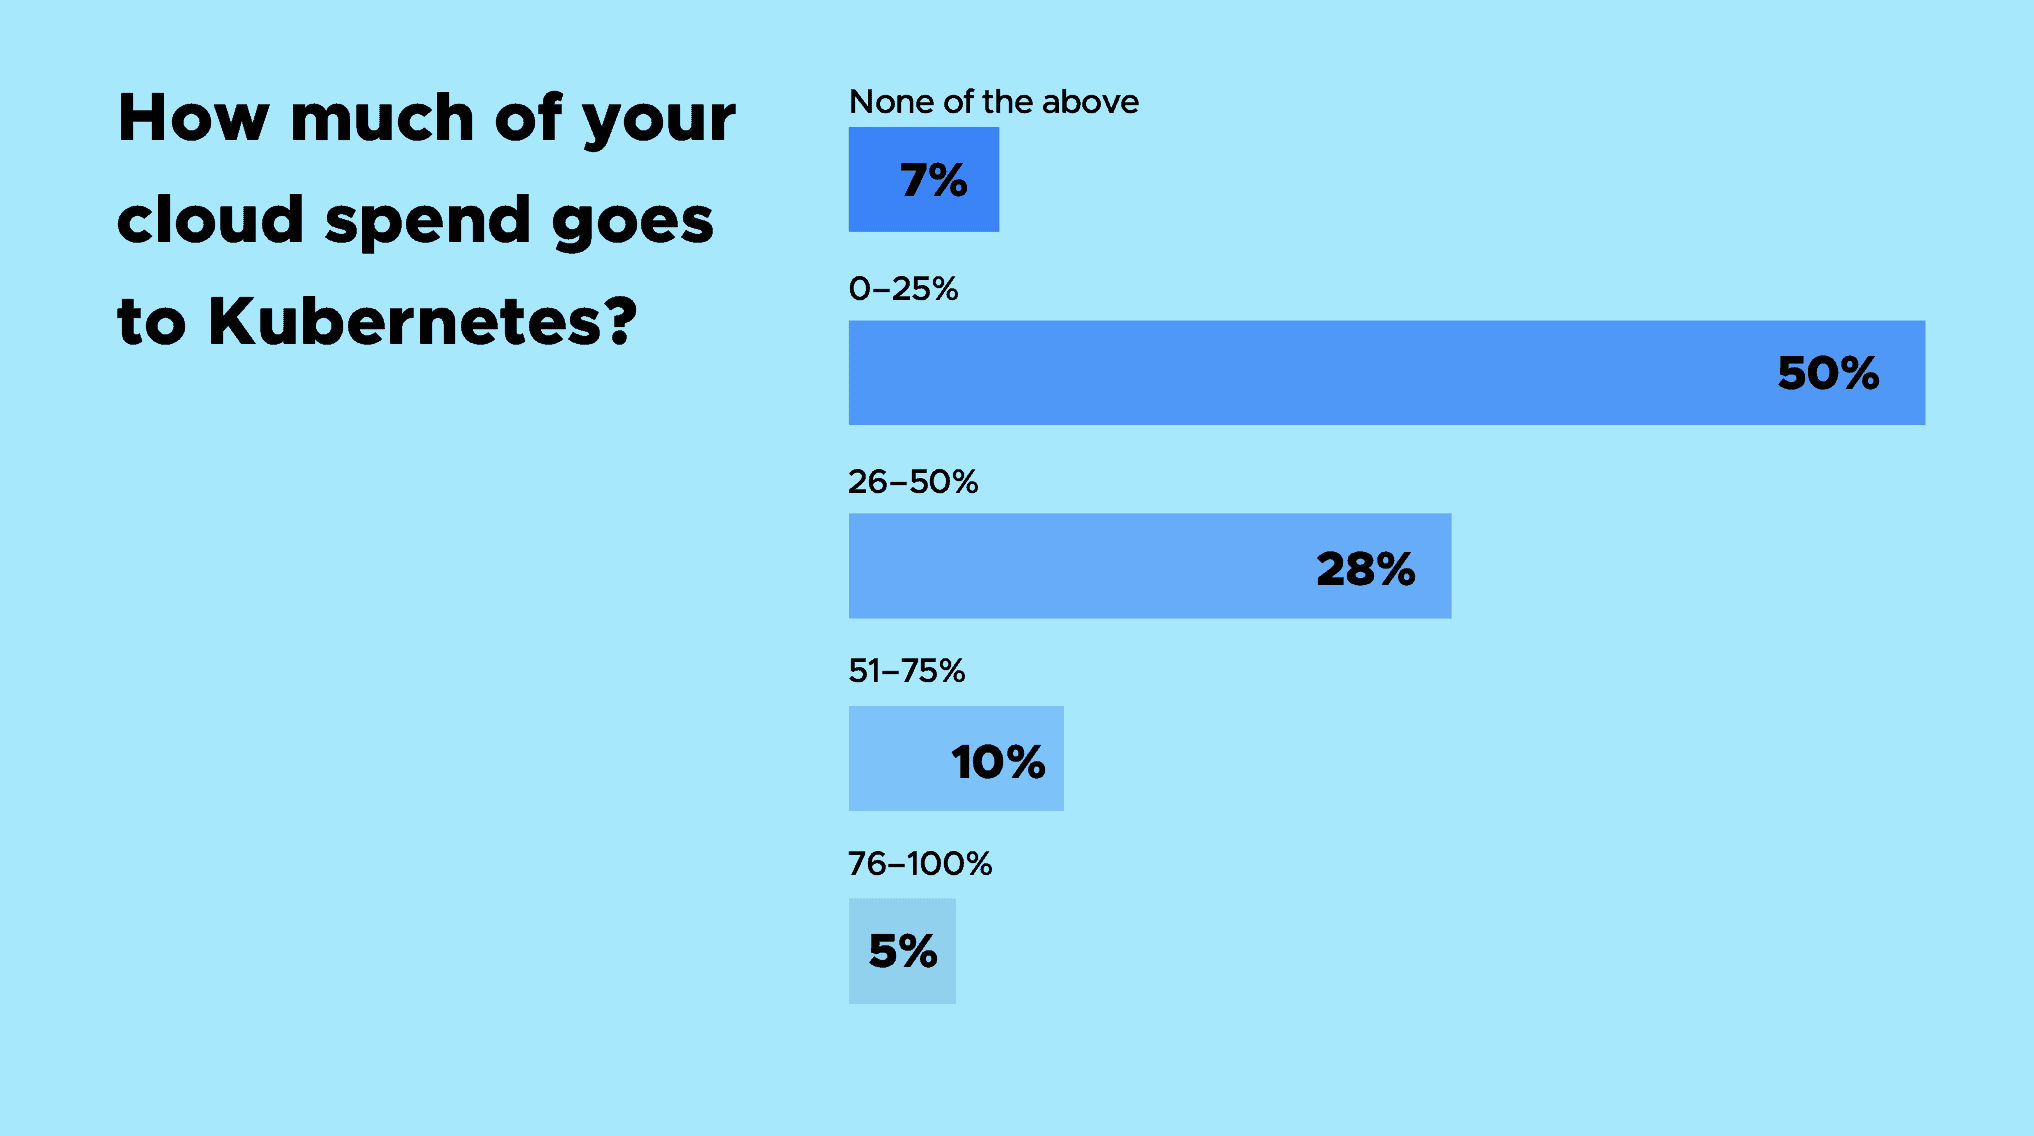
Kubernetes is taking different-sized bites out of cloud budgets across the board. Half, the largest group of respondents, said they are spending up to a quarter of their budget on Kubernetes, but for a decent number, this figure was higher. Some 28% of respondents said Kubernetes is taking up to half their budget, while for 10%, that figure was up to 75% and for a slim 5%, Kubernetes took up everything.
What do those figures look like in reality? Our survey provided some hints.
The largest group, 26%, is spending up to $50,000 per month on cloud, but the second biggest (22%) is paying 20 times that figure and, therefore, more than anybody else at upwards of $1m per month. That figure dropped significantly for the third biggest group, with 21% spending less than $10,000 per month on cloud.
What are Kubernetes users spending on?
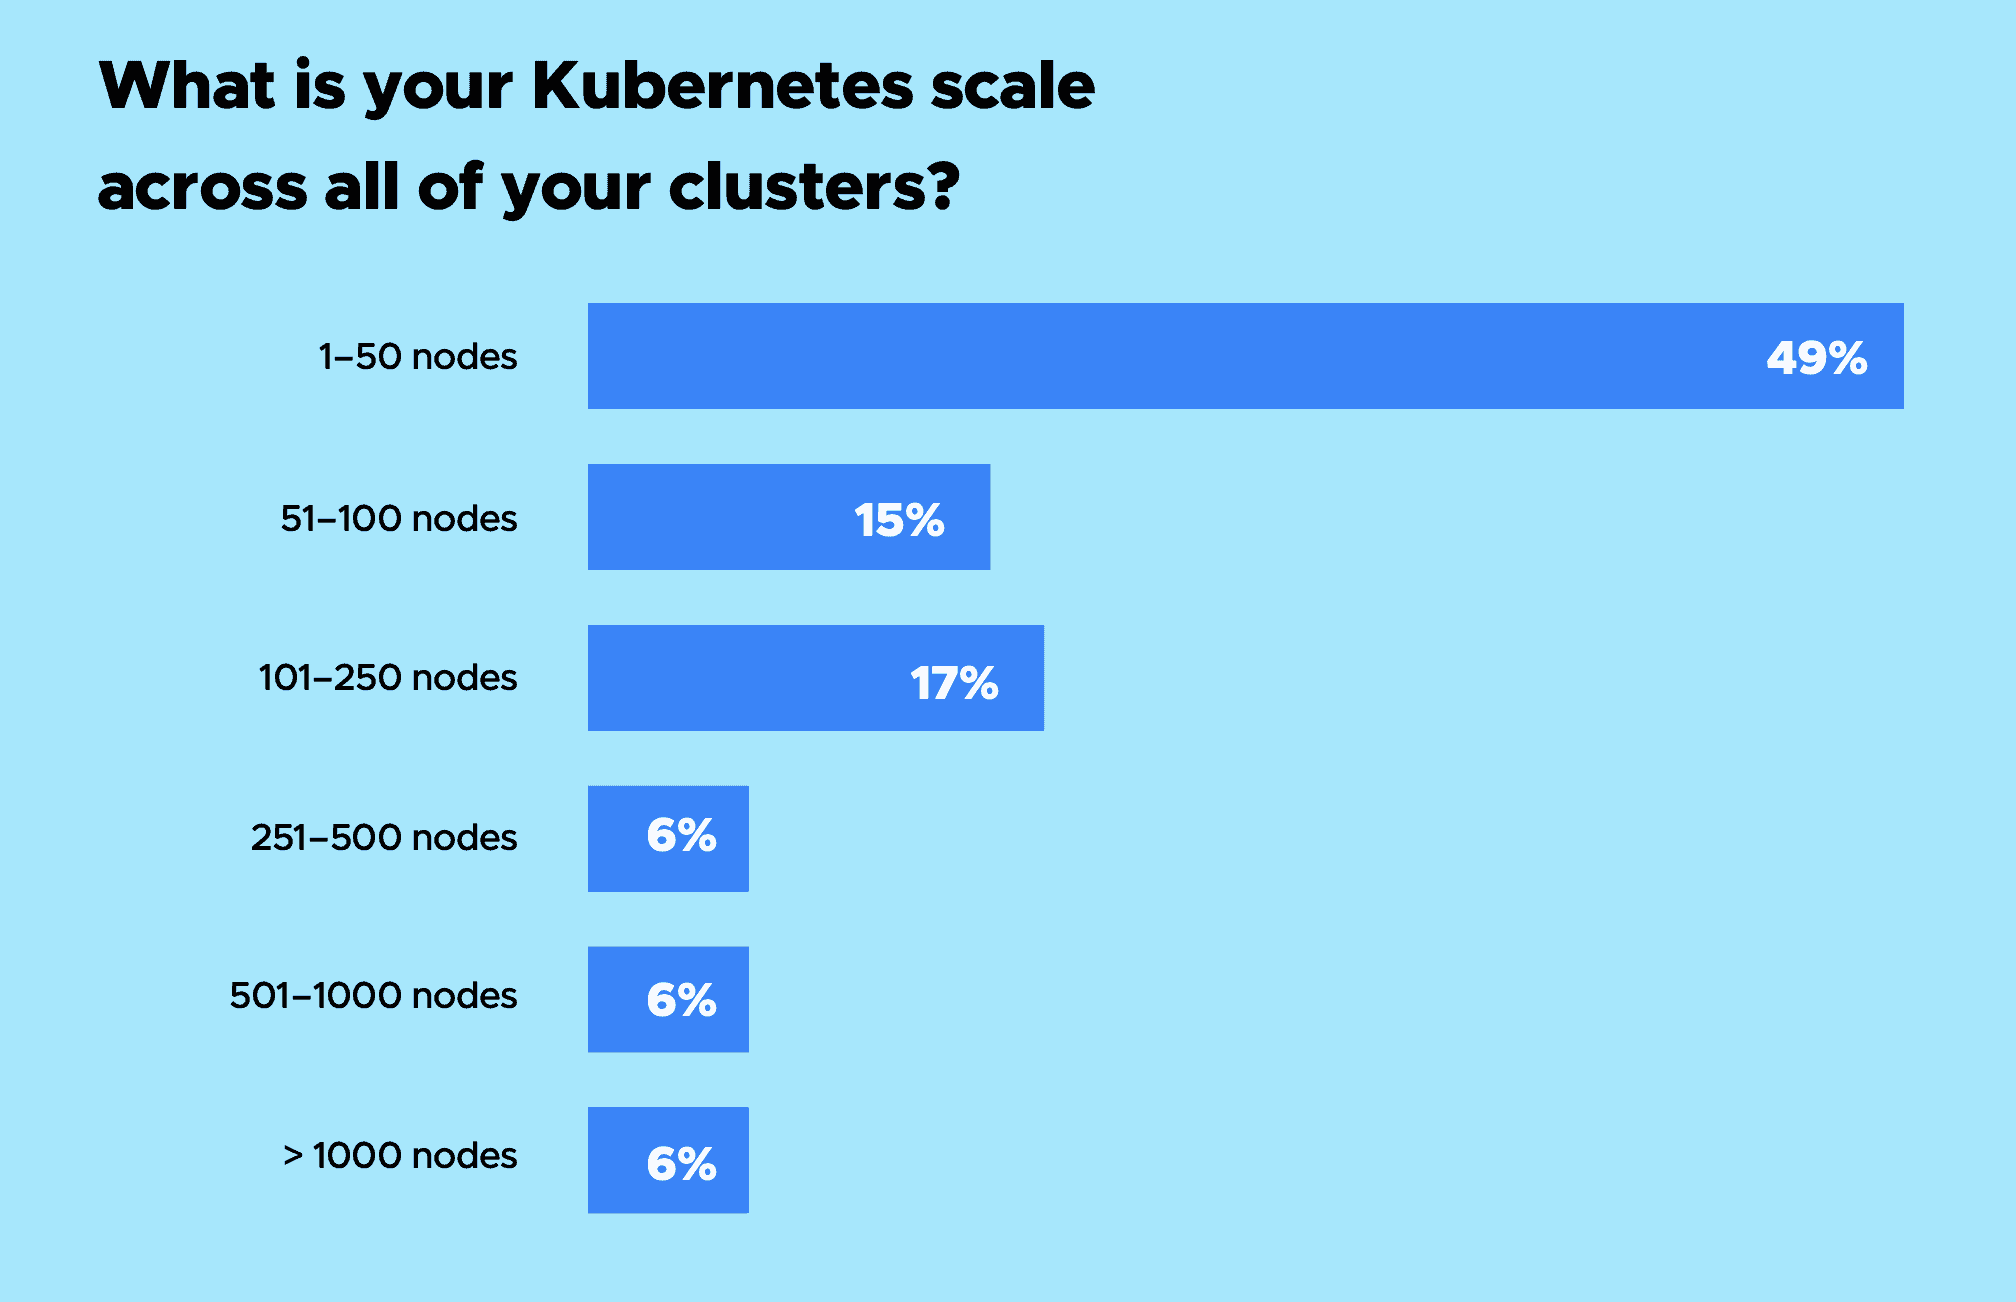
The size of Kubernetes infrastructure varies, with the sweet spot at the low end and a long tail at the larger end of the scale. Nearly half, 49%, have up to 50 nodes, while 17% are running 101-250, and the third largest group, 15%, has 51-100 nodes. On the long tail, estates range from 251 to 1,000-plus that, added together, account for 19% of respondents.
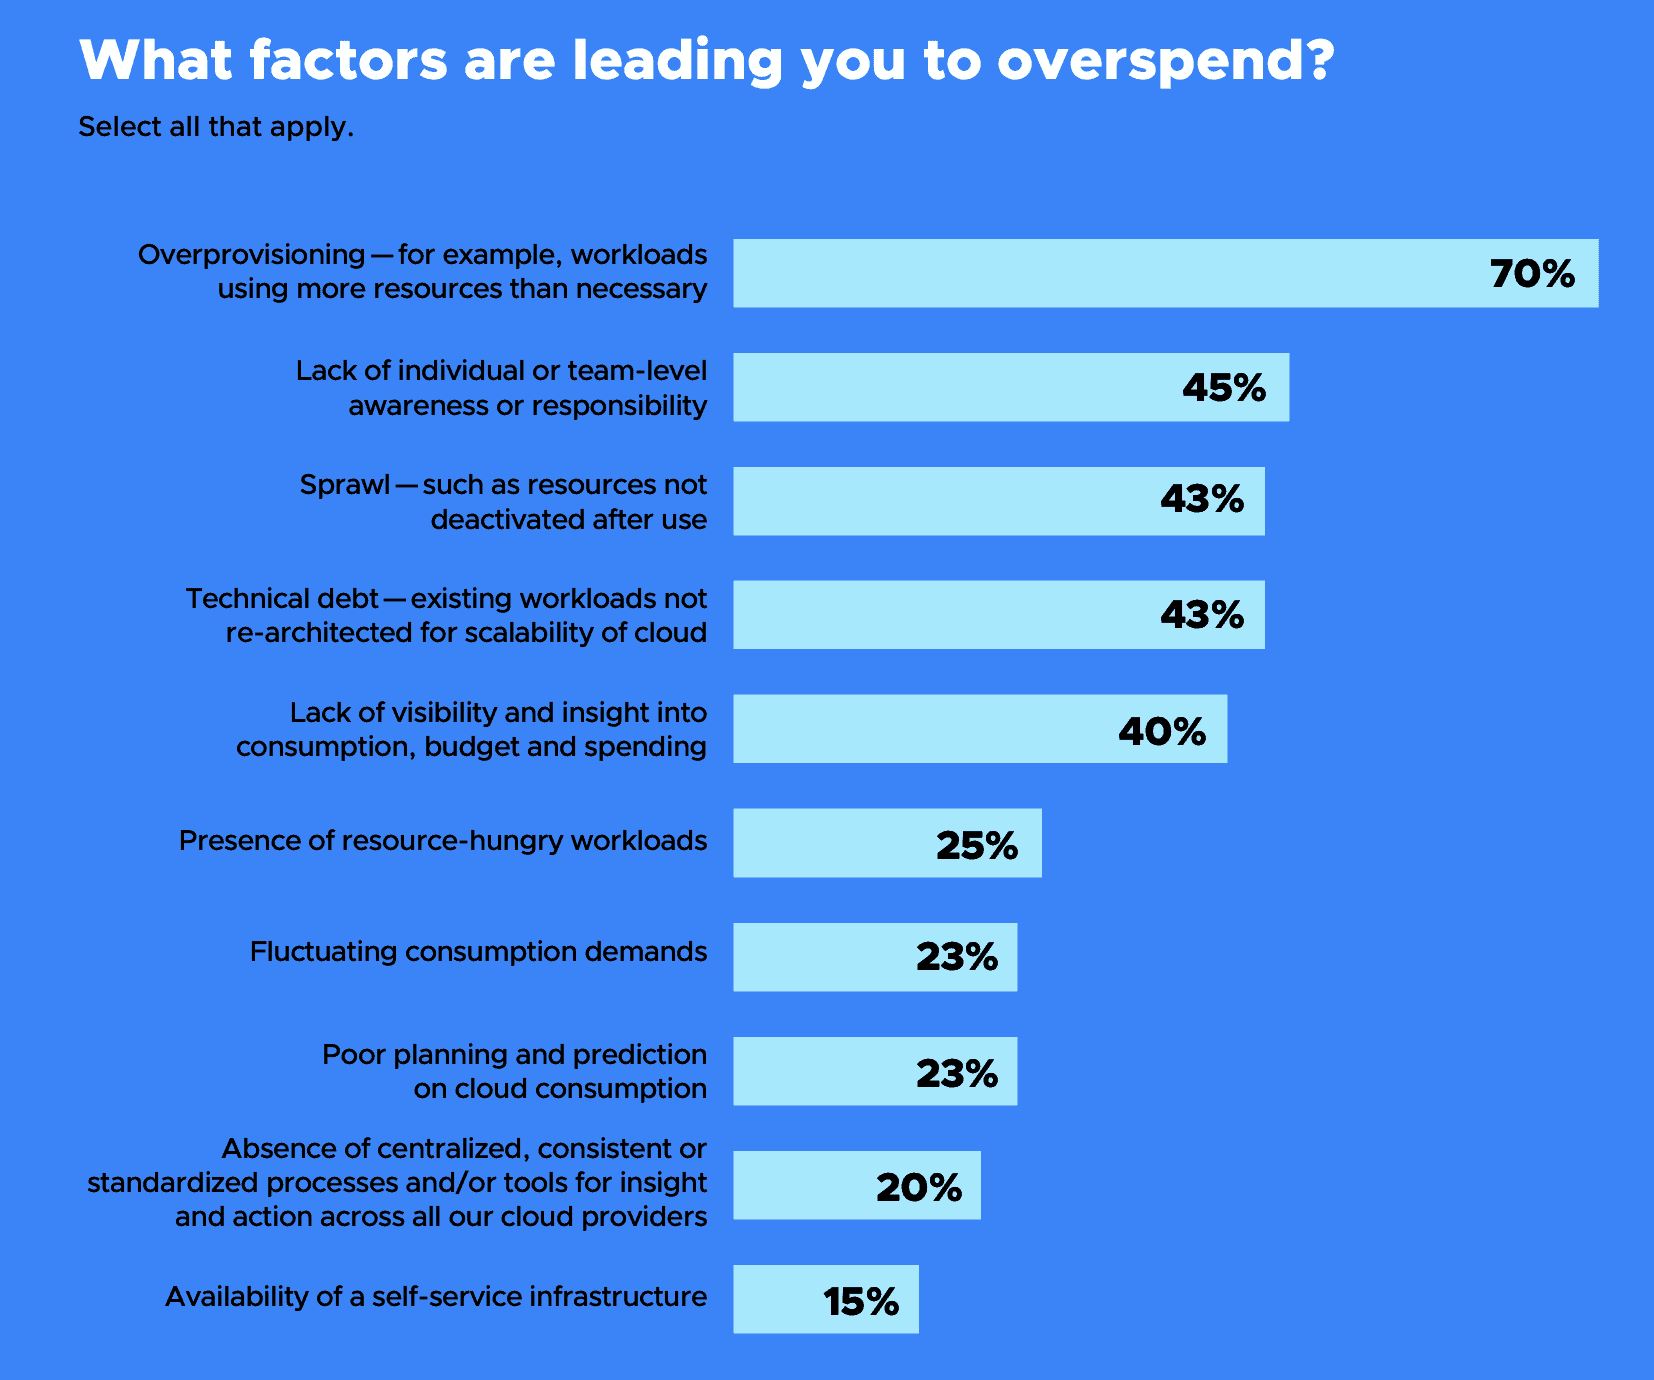
A number of human and technology factors were blamed for the increase in both spend and unwanted and unexpected costs in cloud environments. Over-provisioning came first by a long way at 70%, with a lack of awareness of responsibility at an individual or team level coming second at 45%. Failure to deactivate resources after they’d been used and the presence of technical debt – defined as workloads that had not been re-architected to take advantage of the scalability of cloud native environments – tied for third place at 43% each.
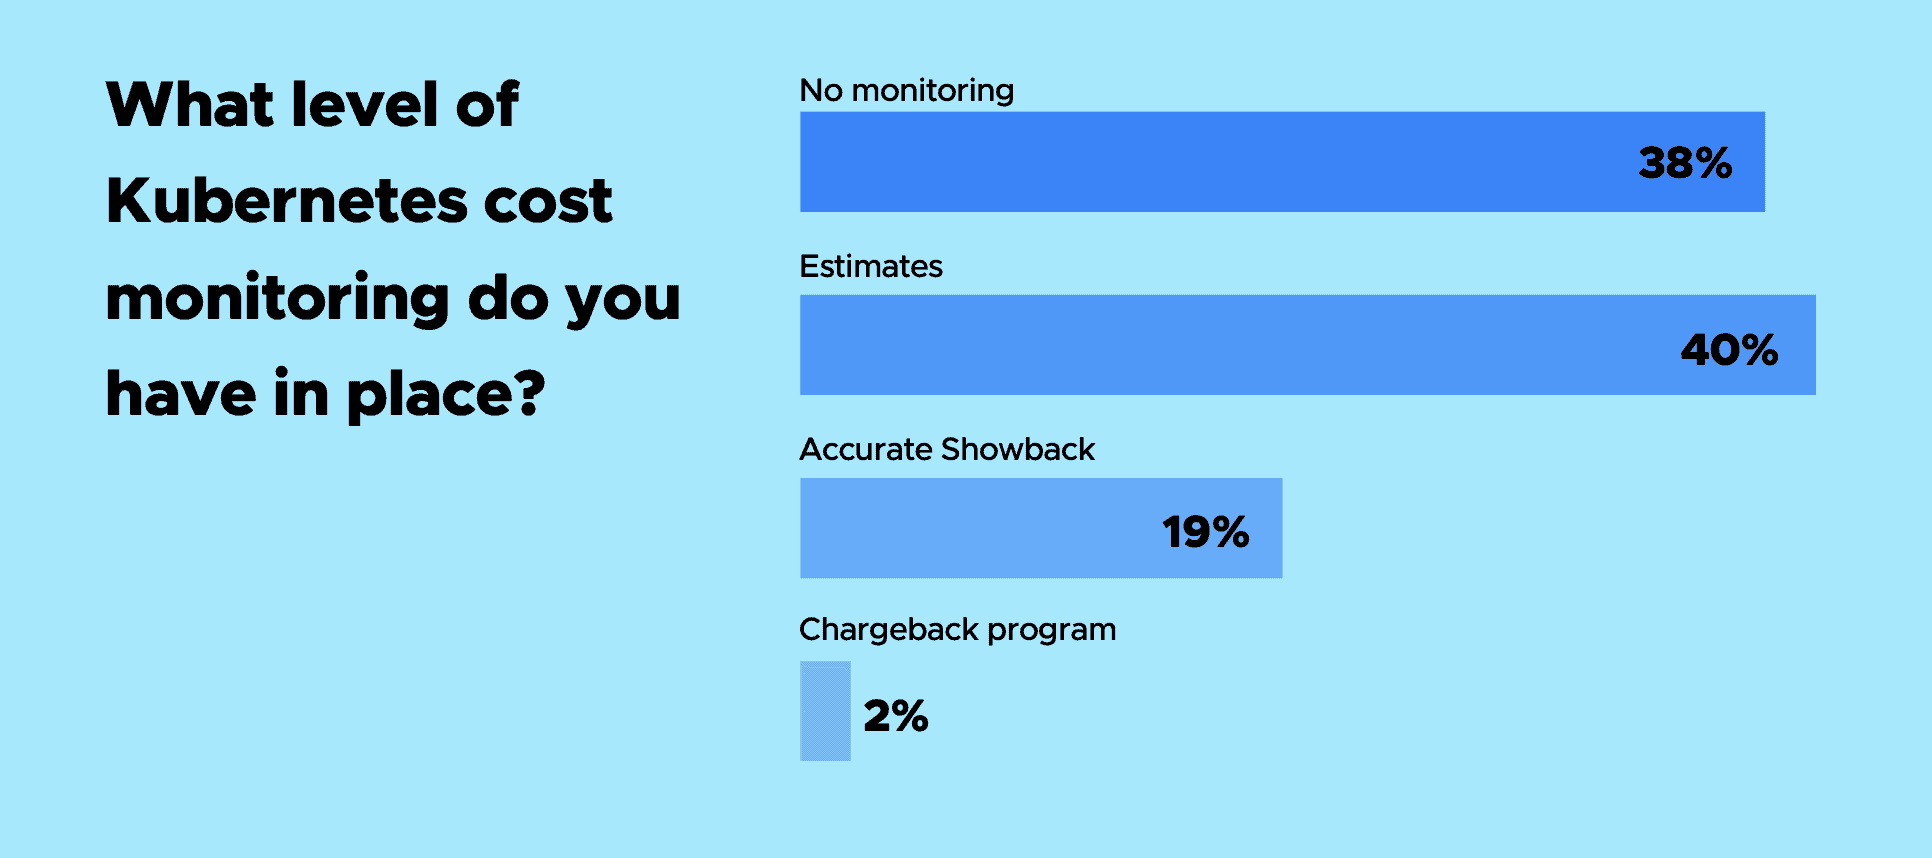
We saw a range of tools and approaches employed overall to understand and manage cloud spend. These included billing analysis and monitoring and dashboards with alerts. Kubernetes saw less evolved approaches: just under a fifth (19%) had access to accurate information, while 40% said they estimated their Kubernetes costs. There was no monitoring in place for 38%.
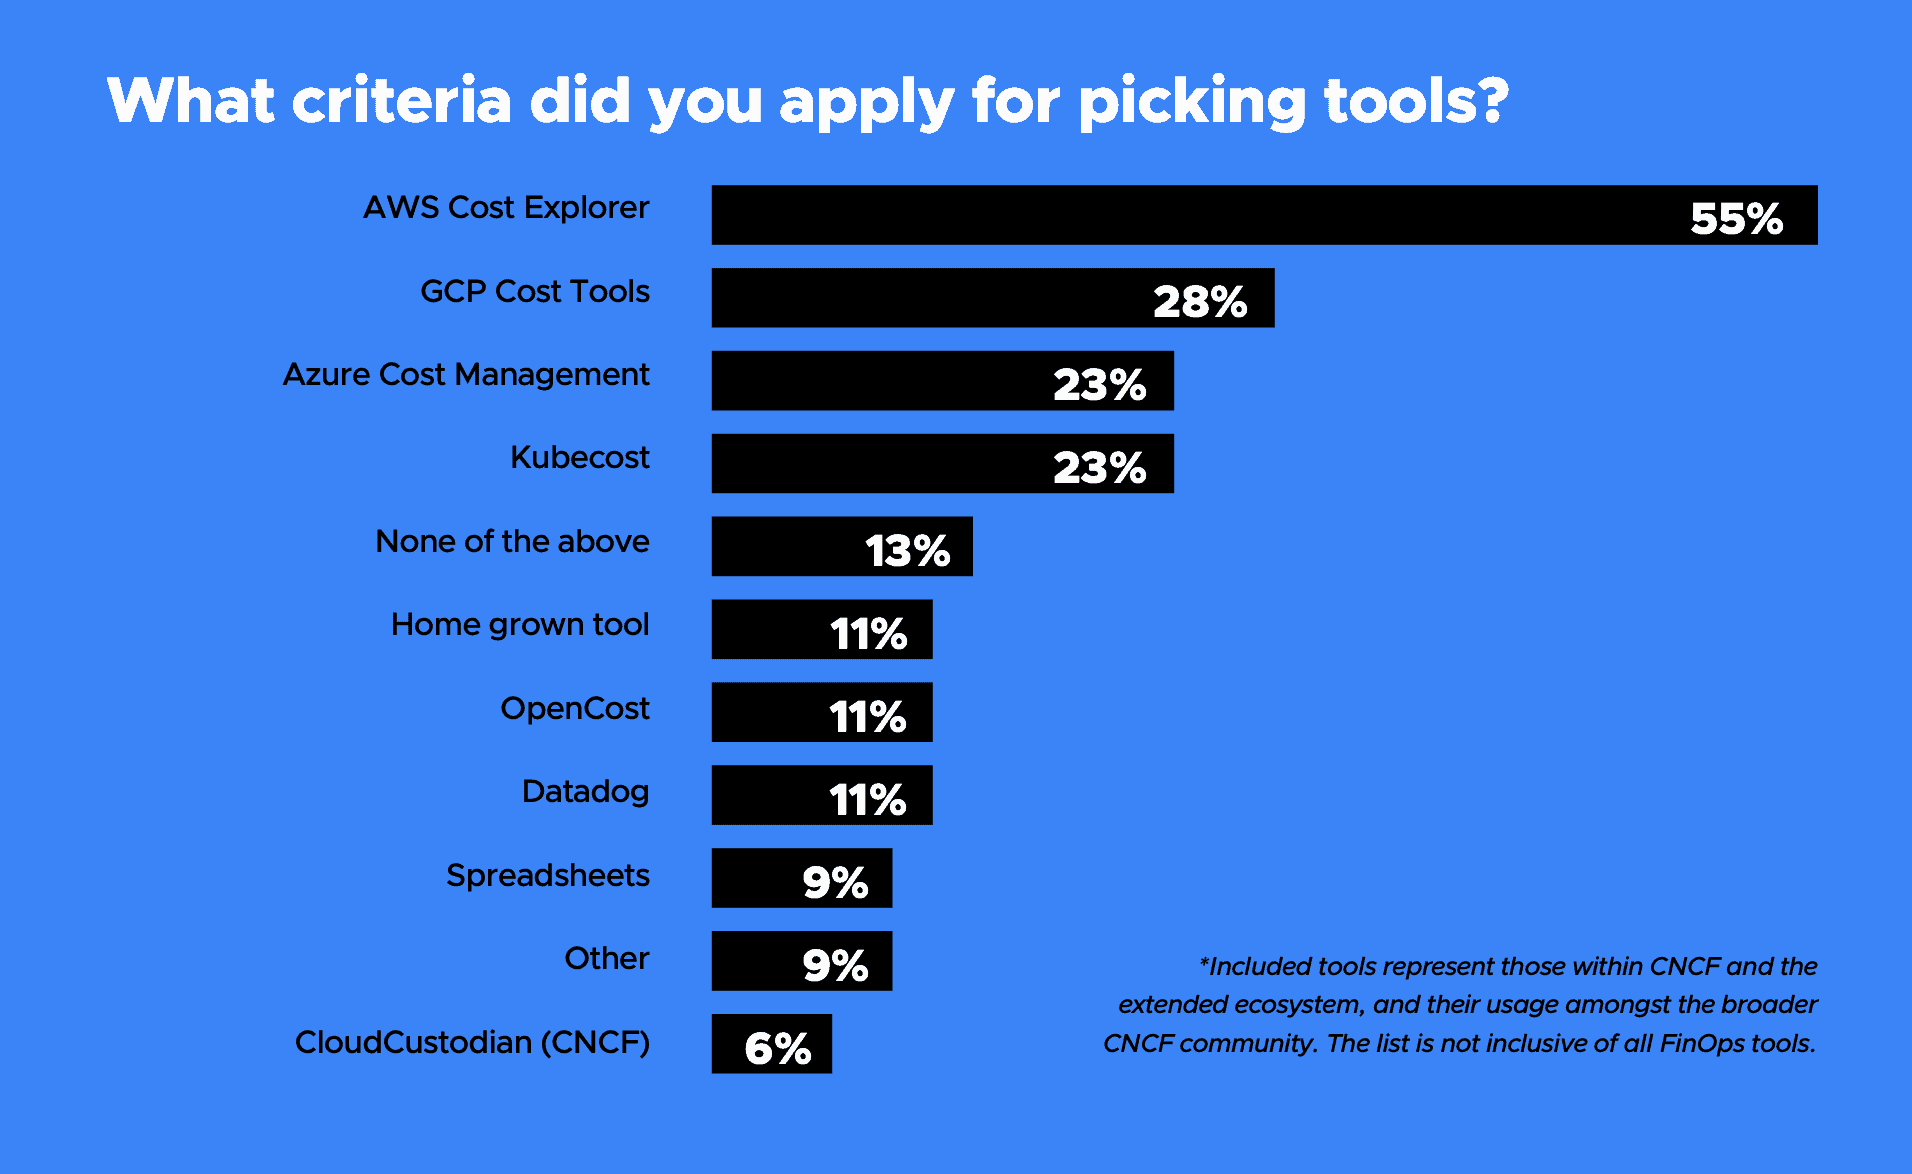
Where participants are using cost and budgeting tools, the data appeared to reflect overall cloud service providers’ market share. AWS Cost Explorer was the most widely used tool (55%) by our respondents, followed by GCP Cost Tools (28%), with Azure Cost Management (23%) in third place. Microsoft tied for third place with independent cost monitoring provider KubeCost.
Another 11% report using homegrown tools, and 11% use the open source OpenCost tool, a vendor-neutral CNCF Sandbox project for measuring and allocating cloud infrastructure and container costs in real time. Kubecost, RedHat, AWS, Adobe, SUSE, Armory, Google Cloud, Pixie, Mindcurv, D2IQ, and New Relic are all founding contributors to the OpenCost project, and it offers integrations with AWS, Azure, and GCP billing APIs OpenCost recently appeared in the top 30 CNCF project velocity list for the first time, demonstrating continued growth alongside the rise of the FinOps movement worldwide.
Given our findings on the factors driving up spending and costs, a connection emerged on the best way to reign these in and gain control. The majority, 68%, believed it would help to make individuals and teams aware of their spending responsibility and increase their understanding of costs. Improved collaboration and communication on spend and consumption came second at 58%. Tying for second place, also at 58%, were best practices that could be followed and implemented at an individual and team level. Half said leadership at an executive level with the adoption of standardized tools and practices would help. Rounding out the results, 48% identified standardized tools for monitoring and optimizing resources, forecasting and accounting.

Overall, there was a belief that individuals and teams should and would be willing to play a part in the bigger financial picture. A resounding 98% said it was important that engineers, development, and product teams pay attention to spend and participate in cost controls, while 75% expected they could get these teams to play a part.
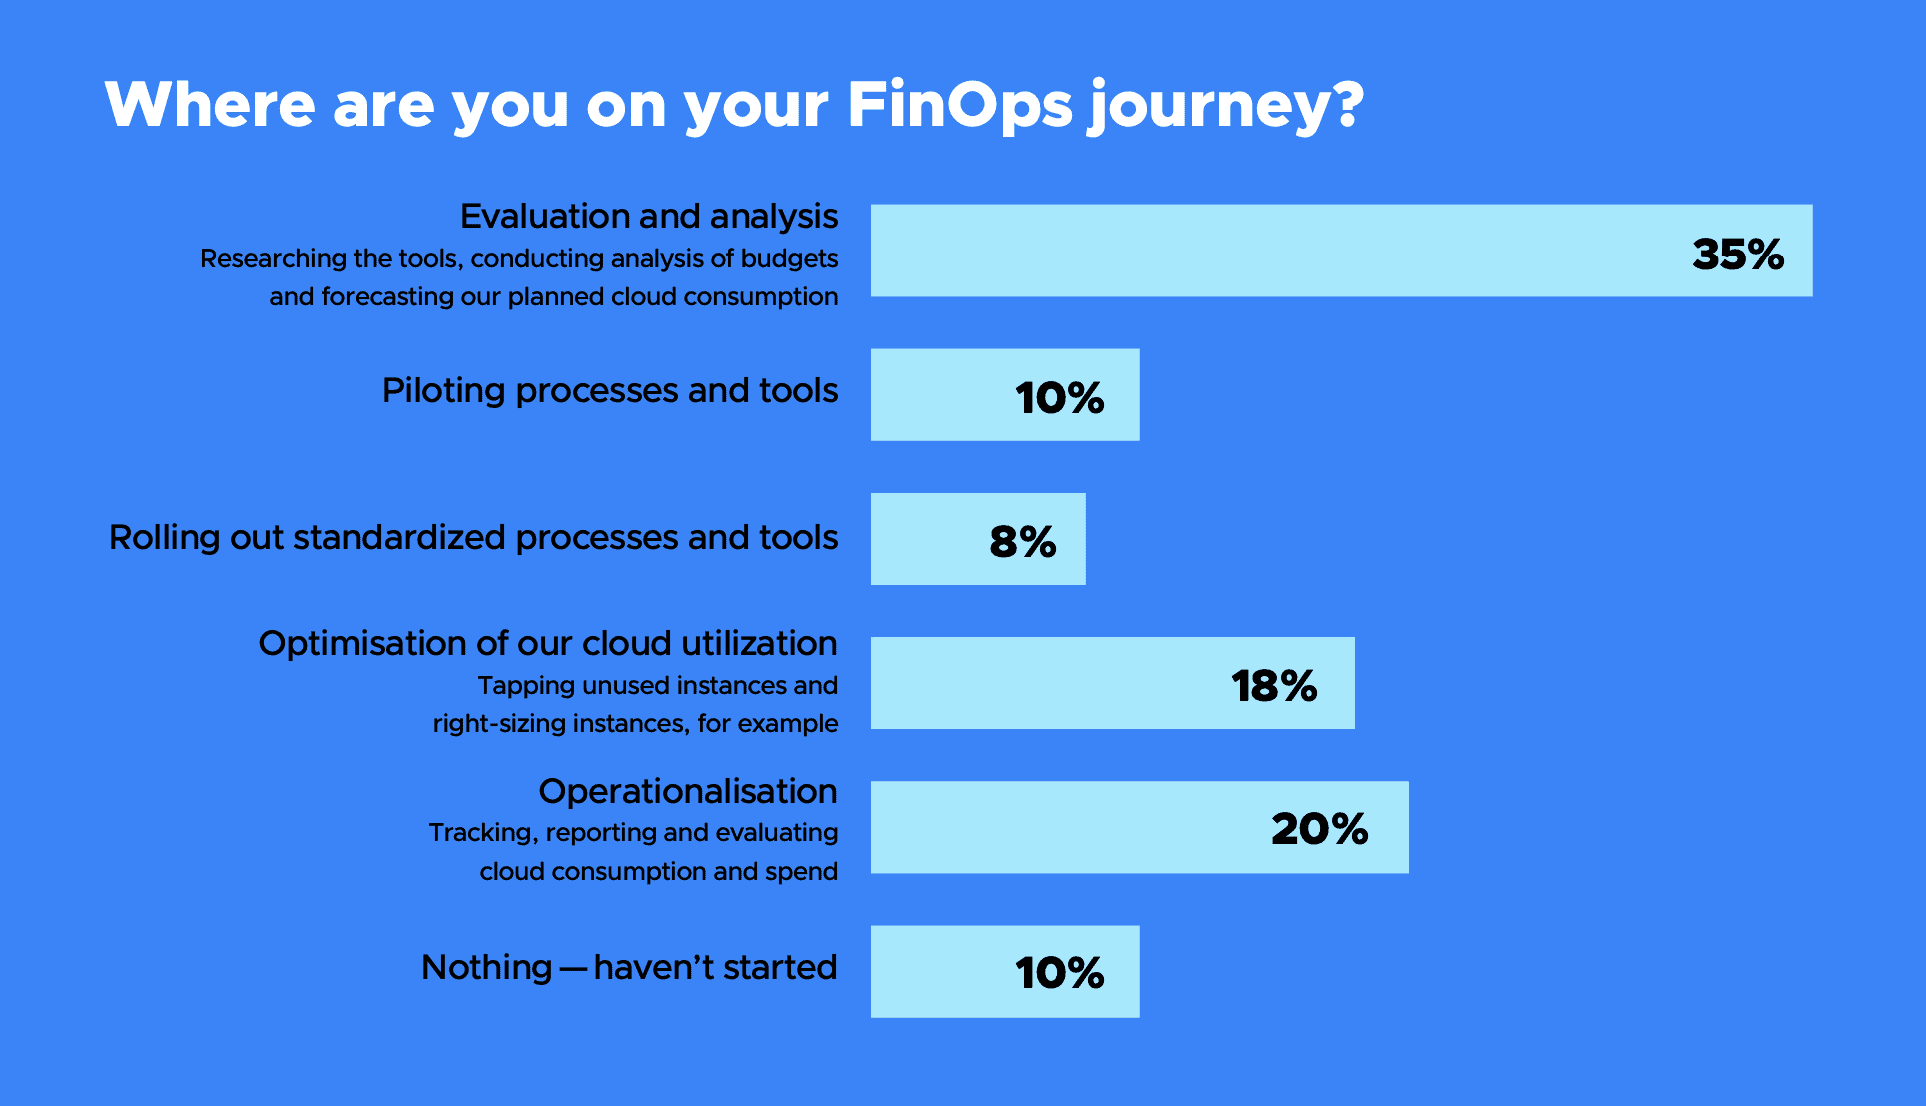
It is no surprise, therefore, that we found survey participants at different stages in the adoption of FinOps tools and practices. 35% are researching and evaluating the tools for budget analysis and forecasting, 20% have moved to tracking, reporting, and evaluating consumption and spend, while 18% have started to optimize their infrastructure – taking steps such as tapping unused instances and rightsizing.
The microsurvey was designed by CNCF with help from members of the OpenCost team. It was conducted between June and November 2023 and received a total of just over 100 responses.
The full survey data can be found on GitHub. You can download the full report here.