2020年CNCF中国云原生调查
At CNCF, we regularly survey our community to better understand the adoption of open source and cloud native technologies. For the fourth time, we conducted the Cloud Native Survey China in Mandarin to gain deeper insights into the pace of cloud native adoption in China.
CNCF定期进行社区调研,以便更好地了解开源技术和云原生技术的应用情况。本次是在中国进行的第四次云原生调查,以期更加深入地掌握中国云原生实施的步伐和速度。
The survey was conducted in December 2020 and January 2021, with 91% of the 439 respondents from Asia. 本次调查于2020年12月和2021年1月完成,调查对象439人中91%来自亚洲。
Key Takeaways of Cloud Native Survey China 中国云原生调查的主要结论:
- Containers continue to grow dramatically. 68% of organizations use containers in production, a 39% increase over last year and a 240% increase from two years ago. 容器持续迅猛增长。68%的机构在生产过程中使用容器,比去年增长了39%,相比2年前增长240%。
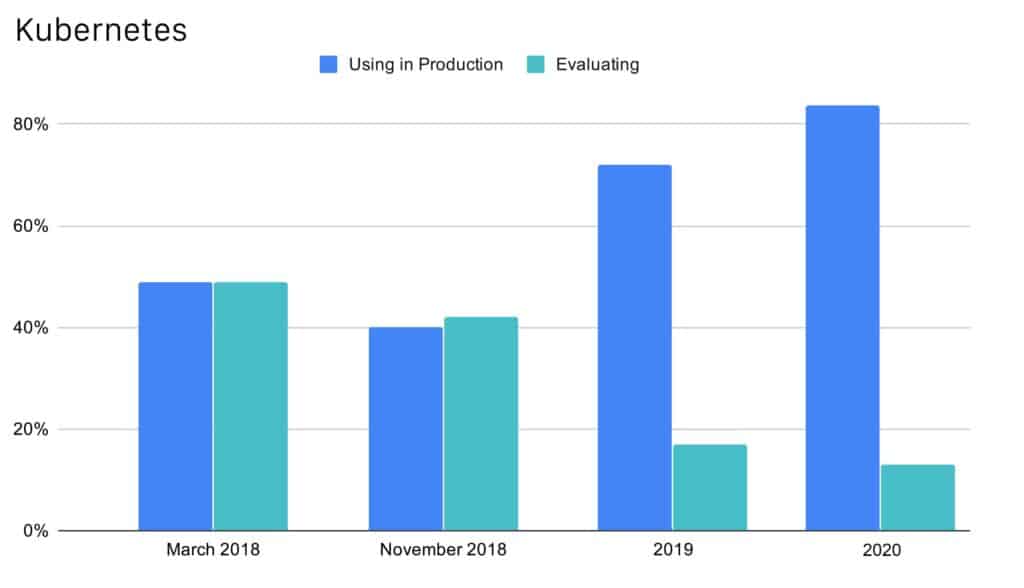
- Kubernetes is becoming ubiquitous. The use of Kubernetes in production has increased to 82% from 72% last year. Kubernetes 已经无处不在,生产中使用 Kubernetes 的比例已从去年的72% 增长到了82%。
- Public cloud is back on top. 46% of respondents use public cloud, up from 36% last year but down from 51% in 2018. 公有云重回榜首,46% 的调查对象都使用公有云,比去年的36%高, 但比2018年的51%低。
- Automation is increasing. 30% use automated release cycles and 73% run CI/CD pipelines in production. 自动化程度持续提高。30% 调查对象生产使用自动化发布周期,73% 运行 CI/CD 流水线。
- Observability tools are used widely. 95% of organizations use monitoring tools, 94% use logging, and 86% use distributed tracing. 可观察性工具被广泛使用。95% 的单位使用监控工具,94% 使用日志,85% 使用分布式追踪。
Containers 容器
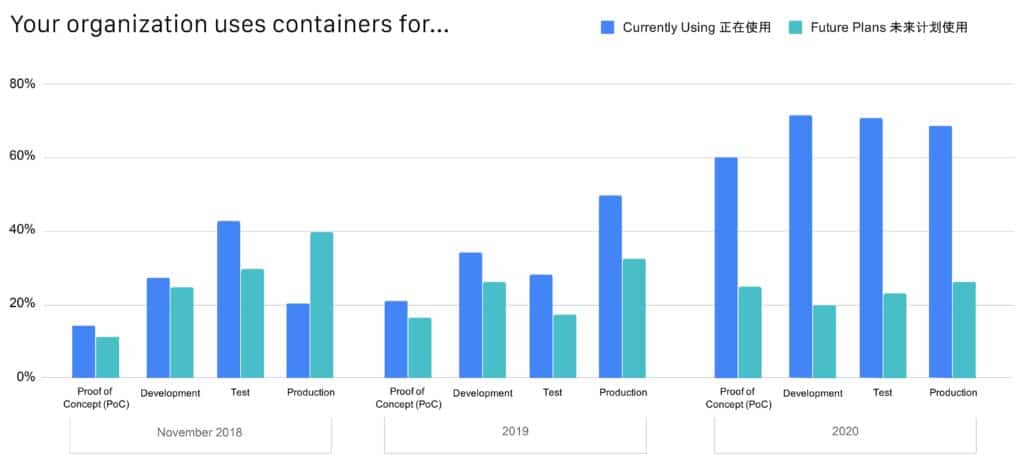
The use of containers continues to increase dramatically. This year it has increased across all categories: test, proof-of-concept (POC), development, and production. 94% of respondents now use containers in at least one stage. Of those using containers, 68% use them in production, up 39% from last year. Since we started surveying the community in China in 2018, there has been a 240% increase in container use in production. 容器使用量持续大幅度增长。今年容器使用在所有应用类别中都有增长,包括测试、概念验证(POC)、开发和生产。目前,94% 的调查对象至少在一个阶段使用容器。在使用容器的调查对象中,68% 在生产中使用,比上年增长 39%。自我们 2018 年开始对中国社区进行调查起,生产阶段使用容器的比例已经增长了 240%。
There has also been a 150% increase over last year in organizations using containers in test environments, meaning the growth of containers in development and production will only continue. The number of organizations using containers in development has jumped from 34% last year to 72%, and POC from 21% to 60%. 测试环境中使用容器的单位相比去年,已经增长了 150%,意味着开发和生产中容器的使用将会持续增长。开发阶段使用容器的单位已经从去年的 34% 跃升至 72%,POC 阶段的容器用户也已由 21% 增长到 60%。
Organizations are also running more containers. Last year, 31% of respondents said their organization was using fewer than 50 containers. This has flipped this year, with 31% saying their organization is using more than 5,000. Overall, nearly half (48%) of organizations are running 1,000 or more containers. 各单位容器使用的数量也在增加。去年,31% 的调查对象称其所在单位使用的容器数量不足 50 个。这种情况今年发生了变化,31% 的人称其单位的容器使用量已经超过了 5,000 个。总体约有一半(48%)的单位使用 1,000 个或更多容器。
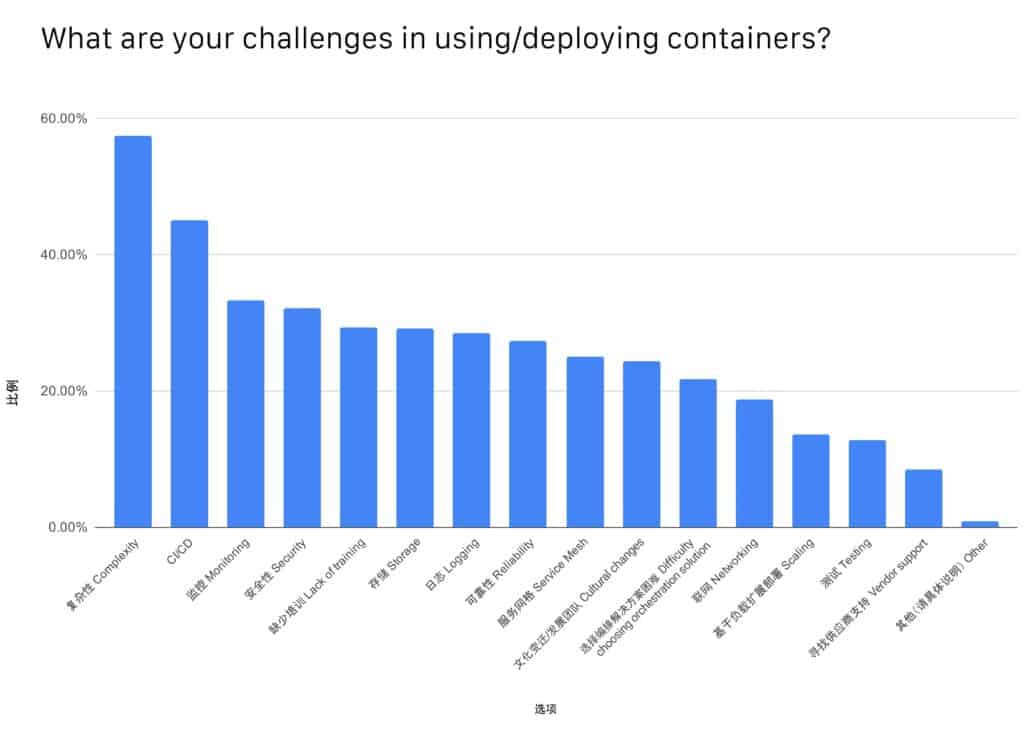
In terms of container challenges, complexity was ranked as the top challenge in using and deploying containers for a third year running. CI/CD was next as organizations look to add more automation to their deployments. 在容器带来的问题中,运行中使用和部署容器的复杂性第三年位居榜首。在用户寻求部署过程更高的自动化程度时,CI/CD成为仅次于复杂性的第二大问题。
Kubernetes
Kubernetes has become the de facto container orchestrator in China, with 82% of organizations using it in production. This is an increase from 72% in the last survey. 在中国,Kubernetes 已经成为约定俗成的容器编排器。82% 的单位在生产中使用 Kubernetes,和上一次调查的72%相比有所增长。
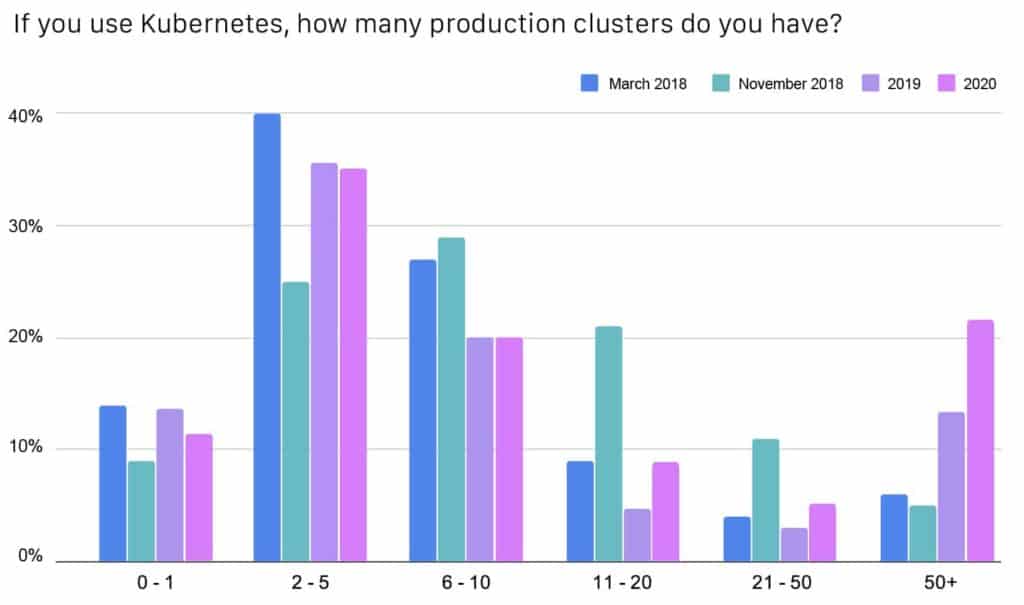
Organizations are also using more Kubernetes clusters. Between 2-5 Kubernetes production clusters was the most popular choice by survey respondents, chosen by 35% this year and last. There has been growth in those using more than 50 containers, which increased to 21% from 13% in 2019 and by 320% from 2018. 各单位使用 Kubernetes 集群的数量也在增加。调查对象最倾向于选择2-5 个Kubernetes 生产集群,今年和去年35% 的用户都选择了 2-5 个的生产集群配置。使用 50 个以上容器的单位数量也有增长,从 2019年的13% 增长到21%,比 2018年增长了320%。
Separating Kubernetes Applications 分隔 Kubernetes 应用程序
In organizations using Kubernetes, 84% of respondents use namespaces to separate applications, up from 71% in 2019. 58% use separate clusters, up from 42% in 2019. 26% use only labels, which is in line with last year. 在使用 Kubernetes 的单位中,84% 使用命名空间分隔应用程序,比2019年的71%增加了。58% 使用分隔集群,比2019年的42%增加了。26% 仅使用标签,数量与去年持平。
In organizations with multiple teams, 80% use namespaces to separate Kubernetes applications, up from 68% last year. 60% use separate clusters, up from 46%, and 22% use only labels, down from 25%. 有多个团队的机构中,80% 使用命名空间分隔 Kubernetes 应用程序,比去年的68%有所增加。60% 使用分隔集群,比去年的46%有所增加;还有22% 仅用标签,比去年的25%有所减少。
Packaging 打包
Helm is once again the most popular method for packaging Kubernetes at 64%, up from 54% last year. Helm 再次成为最受欢迎的打包 Kubernetes 的方法,成为 64% 的用户选择,比去年的54%有所增长。
Kubernetes Environments Kubernetes 环境
During local container development, 37% of respondents report that they target Docker Kubernetes. This is down from 42% last year. Cloud provider-managed Kubernetes is second with 28%, up from 14% last year. It surpassed Minikube, which was second last year, and is now third with 21%. 在本地容器开发期间,37% 的调查对象称他们愿意选择 Docker Kubernetes。与去年相比,这一数字比去年的42%有所下降。云供应商管理的 Kubernetes 成为 28% 调查对象的选择,比去年的14%有增长,且超过了去年排名第二的 Minikube,今年选择 Minikube的用户占21%,排名第三。
Autoscaling Workloads 工作负载自动伸缩
For those planning to scale Kubernetes workloads, 69% plan to autoscale stateless applications, up from 54% last year, 35% plan to scale task/queue processing, up from 26%, and 34% plan to autoscale stateful applications, up from 23%. 在计划伸缩 Kubernetes 工作负载的用户中,69% 期望自动伸缩无状态应用,比去年的54%有所增长;35% 计划伸缩任务/队列处理,比去年的26%有增长;34% 计划自动伸缩有状态应用,比去年的23%有增长。
Of those who are not using Kubernetes autoscaling capabilities, 31% have built their own solution, and 28% use a third-party solution. In the last survey, 28% did not want to autoscale any works, but this has dropped to 13% as more organizations use Kubernetes in production. 在没有使用 Kubernetes 自动伸缩功能的用户中,31% 已经建立了自己的解决方案,28% 使用第三方解决方案。在上一次调查中,28% 的用户不希望自动伸缩任何工作,但随着越来越多的单位在生产中使用 Kubernetes,这一数字已经下降到了 13%。
Cloud and Code 云和代码
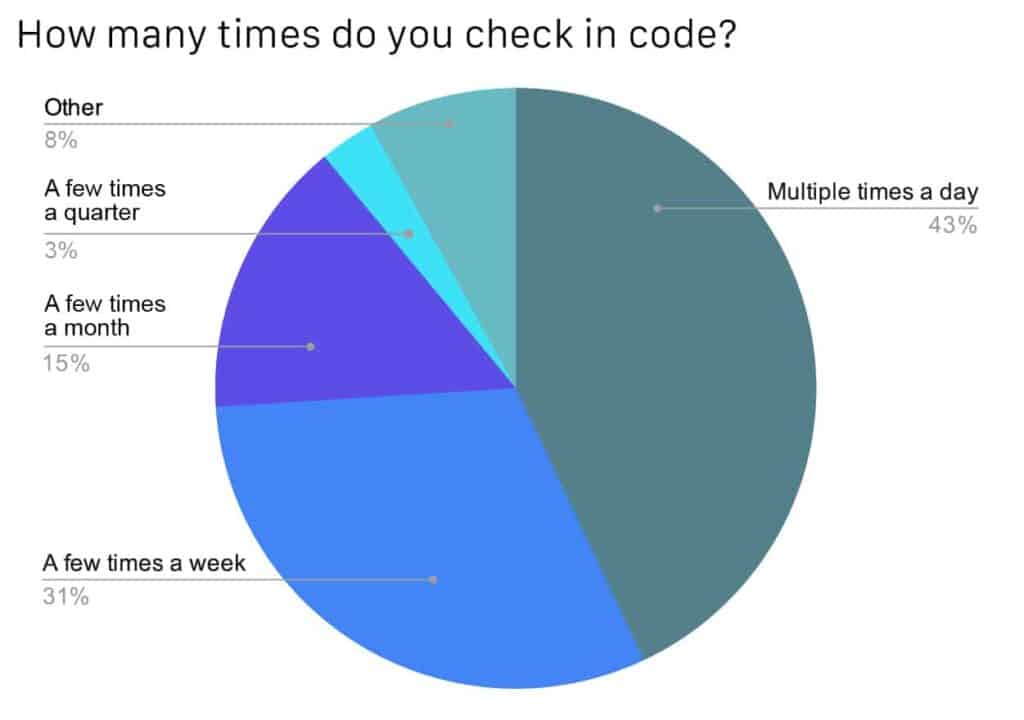
Organizations are checking in code more often. 43% of respondents noted their organization checks in code multiple times a day. This is up from 35% last year. 31% check in codes a few times a week, down from 43% last year. This means that nearly three-quarters of organizations now check in code at least a few times a week. 各单位提交代码更加频繁。43% 的调查对象称其所在单位一天数次提交代码,比去年的35%有增加。31% 一周数次提交代码,比去年的43%有所减少。也就是说将近3/4 的单位现在至少每周都要几次提交代码。
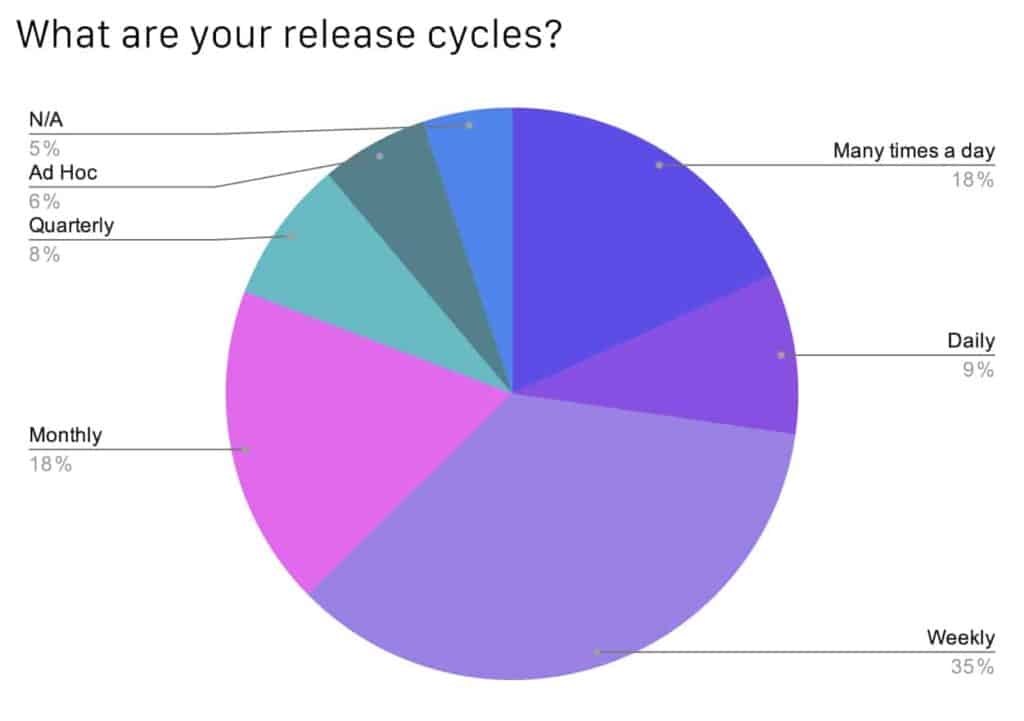
Organizations have more frequent release cycles. Those releasing daily or more often have increased to 27% from18% last year. Nearly two-thirds (62%) release software weekly or more frequently. 各单位发布周期更加频繁。每天都要发布的单位或发布更加频繁的单位从去年的18%增加到27%。将近 2/3 (62%)的用户每周都会发布软件,甚至更为频繁。
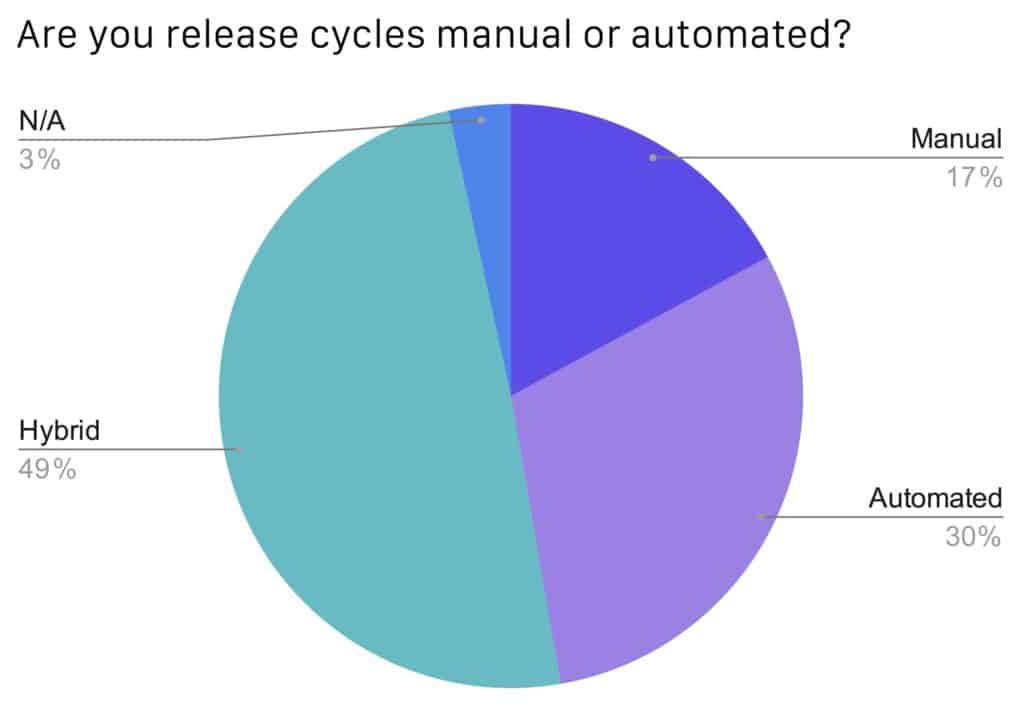
Automated and hybrid release cycles are becoming more popular. Those using manual release cycles have dropped significantly to 17% from 31% last year. 自动和混合发布周期越来越受欢迎。使用手动发布周期的用户已经从去年的 31% 下降到 17%。
Just under half of organizations have hybrid release cycles, the most popular approach, up slightly from 46% last year. Those using automated release cycles have increased to 30% from 21%, and we expect to see this growth continue as more organizations continue to adopt CI/CD tools. 少于半数的单位使用最受欢迎的混合发布周期,该方法相比去年的 46% 略有增加。使用自动发布周期的用户从 21% 增长到了 30%。随着越来越多的单位继续使用 CI/CD 工具,预期会有后续会有更多用户使用自动发布周期。
Public cloud is back on top, but hybrid and multi-cloud are poised for growth. Public cloud usage ranked No. 1, with 46% of respondents naming it as their top data center type. This is up from 36% last year, but down from 2018 when 51% were using public cloud. Private, 45% and hybrid, 42% also both had small increases over last year. The survey asked about “multi-cloud” for the first time, and it was chosen by 22% of respondents. We expect to see growth in future surveys among hybrid and multi-cloud as more organizations look to take advantage of best-of-breed solutions.公有云重回榜首,混合云和多个云蓄势待发。公有云使用排名第一,46% 的调查对象将其作为首选数据中心类别。这个数字比去年的36%有所增长,但仍然低于2018年51% 的水平。另有 45% 的用户使用私有云,42% 使用混合云,两项均比去年小幅增长。本次调查首次了解了“多个云”的使用情况,结果显示 22% 调查对象选择了多个云。未来随着越来越多的单位寻求使用最佳解决方案,混合云和多个云有望实现使用增长。
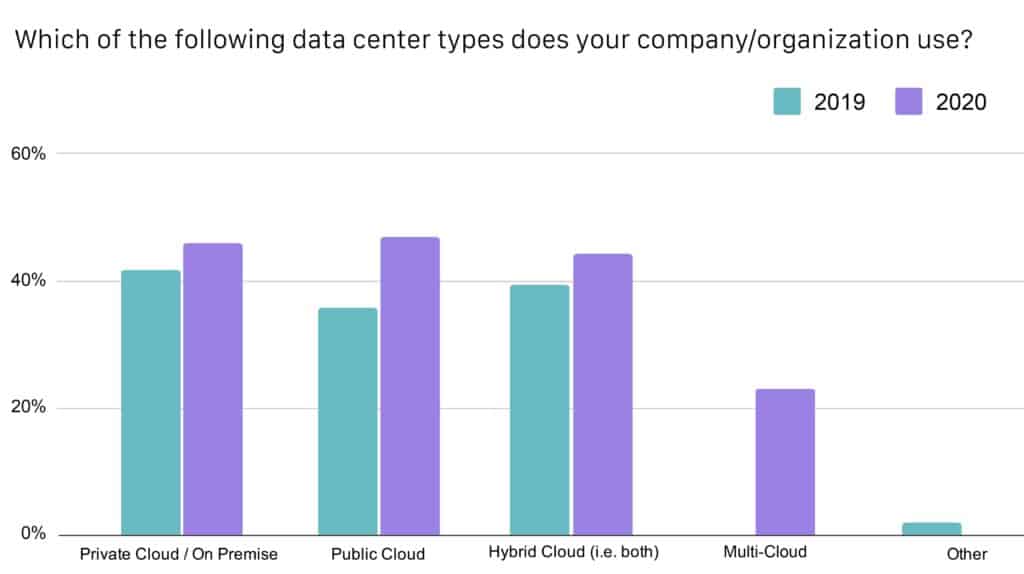
*Note that respondents were allowed to select more than one answer, which may be causing overlap. We will resolve this for future surveys. *注:允许调查对象选择一个以上答案,因此可能造成重复统计。未来调查中,我们会寻求改进。
There has been an increase in those using more than 5,000 machines. However,the most popular number isbetween 6-100 machines, as noted by 47% of respondents versus 44% last year. Only 15% of organizations have more than 5,000 machines, but that is up from 10% last year. 使用超过 5,000 台机器的用户增加。但用户使用最多的数量为 6-100 台,今年这个区间的用户占 47%,去年为 44%。仅有15% 的单位使用 5,000 台以上机器,但这一比例比去年的10%有所增长。
Cloud Native Tools 云原生工具
While there are many benefits to building cloud native infrastructure, respondents ranked the top benefits of cloud native tools as: 建立云原生基础设施能带来很多益处,调查对象对云原生工具的益处进行了排名:
- Shorter deployment time (59%) 部署时间更短(59%)
- Improved scalability (55%) 可伸缩性得到了改善(55%)
- Cloud portability (50%) 云的可移植性(50%)
- Improved developer productivity (49%) 开发者生产率提高(49%)
- Improved availability (47%) 可用性提高(47%)
CNCF Projects CNCF 项目
The use of CNCF projects in China is increasing across the board. 中国社区的 CNCF 项目使用持续提高。
There was a 64% increase in the use of graduated CNCF projects over last year. A few projects, in particular, have shown impressive jumps in production usage: 去年,毕业 CNCF 项目的使用量增长了 64%,有几个项目在生产中的使用呈现出跨越式增长。
- Those using Prometheus in production increased by 32% from 57% to 75%. 生产中使用 Prometheus 的用户从57% 增加到 75%,增长 32%。
- CoreDNS increased its usage by 83%, from 35% to 64%. CoreDNS 使用从35% 增加到 64%,增长 83%。
- The use of etcd jumped by 108% from 37% to 77%. Etcd 使用量从 37% 增加到 77%,增长 108%。
- Harbor, the first project out of China to graduate, saw a 75% increase from 27% to 47%. There are now two graduated projects born in China, Harbor and TiKV. 来自中国的第一个毕业项目 Harbor从 27% 增加到 47%,增长 75%。目前已有 2 个来自中国的项目毕业:Harbor 和 TiKV。
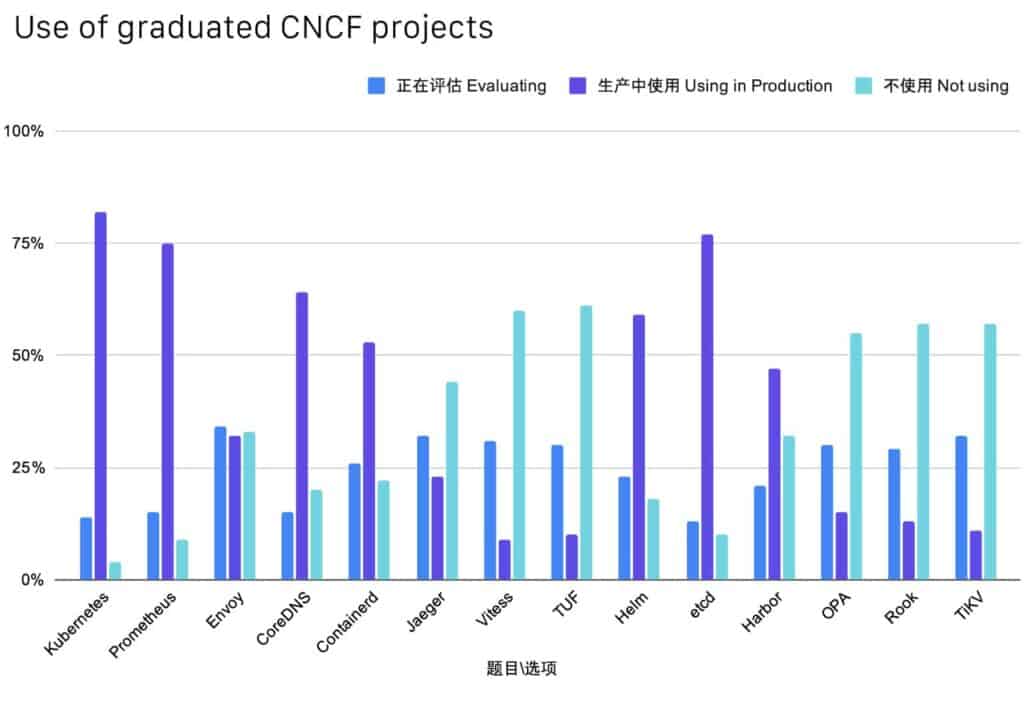
*We are missing data for Fluentd * 不包括 Fluentd 数据。
The use of incubating projects has increased by 94% since last year. Projects that have grown the most include: 从去年开始,孵化项目的使用已经增长了 94%。成长最快的项目包括:
- CNI, which saw a jump of 141%, growing from 22% to 53% of respondents using it in production. CNI 增长 141%,在生产中使用该项目的调查对象已由 22% 增长到 53%。
- gRPC, whose production usage increased by 62% from 29% to 47%. 生产使用 gRPC 已由 29% 增长到 47%,增长量达 62%。
- OpenTracing and CRI-O, which are both used by 23% of respondents in production. 生产中使用 OpenTracing 和 CRIO-O 两个项目的调查对象也占到了23%。
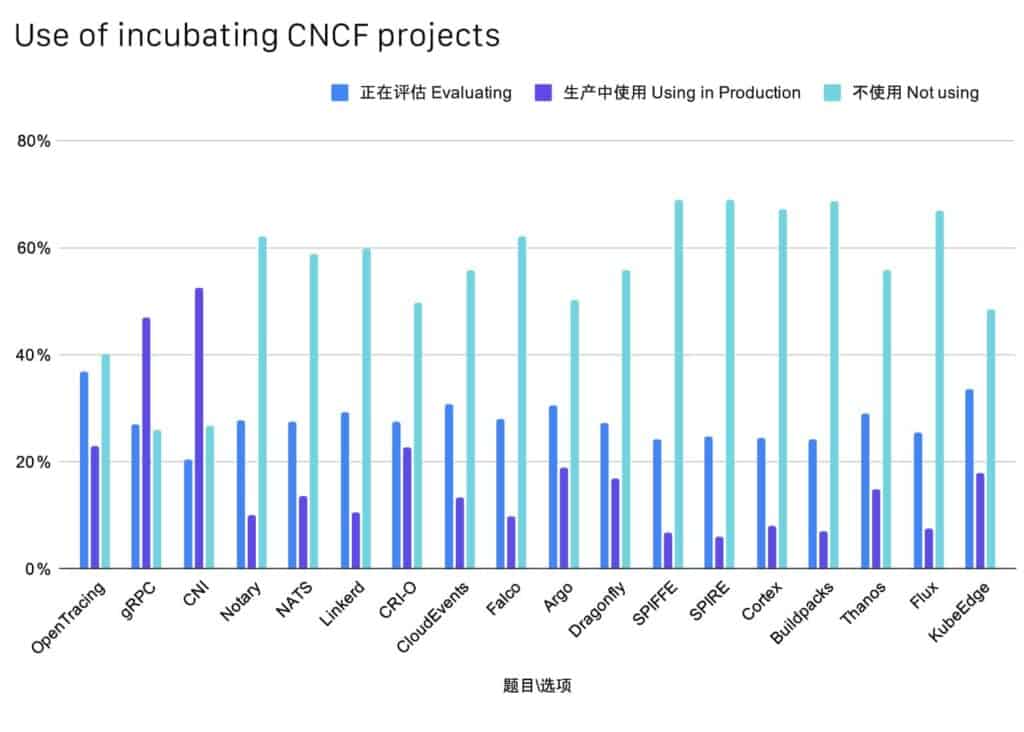
*We are missing data for Contour, Cortex, emissary-ingress, and Operator Framework, which joined after the survey was opened.*因 Contour、Cortex、emissary-ingress 和 Operator Framework在调查开始之后加入,本次调查遗漏了上述几个项目的数据。
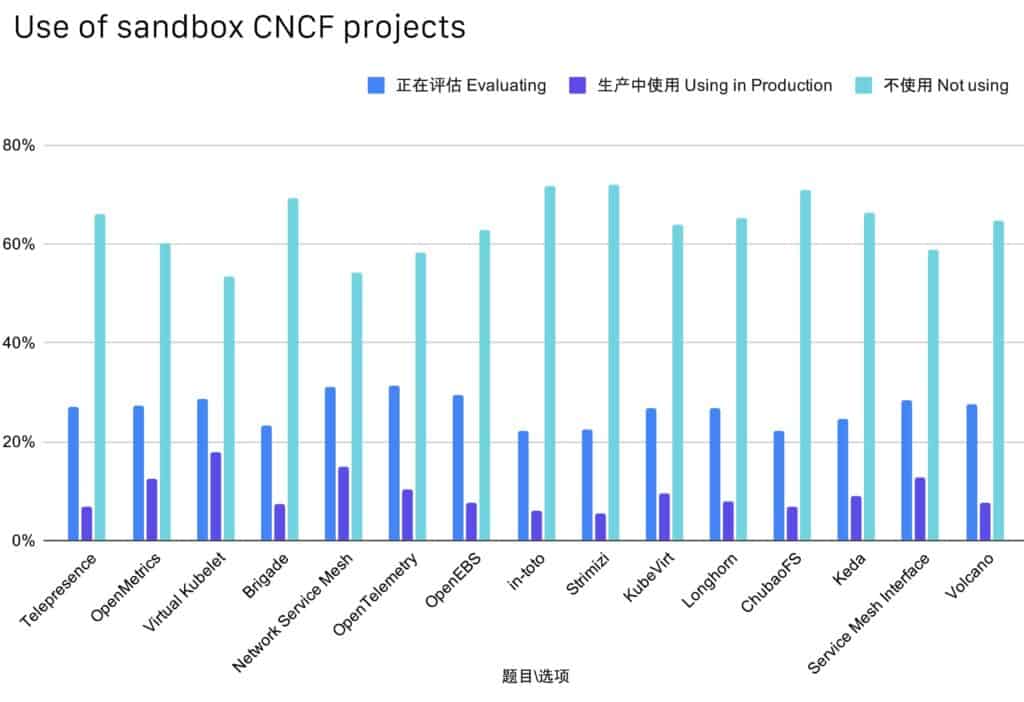
Since the last report, the TOC changed the process for accepting Sandbox projects, and we have seen a significant influx. We now have 50 Sandbox projects! Some even already have double digits numbers using them in production. 自上次报告之后,TOC 改变了接受沙箱项目的流程,至此我们已经看到大量项目加入。目前,我们拥有 50 个沙箱项目!部分项目在生产中的使用已经达到了两位数。
- Virtual Kubelet, used by 18% of respondents in production, was the most used Sandbox project. 有 18% 的调查对象已经在生产中使用 Virtual Kubelet,使其成为使用最多的沙箱项目。
- Two service mesh projects were next, Network Service Mesh, 15%, and Service Mesh Interface, 13%. 2 个服务网格项目紧随其后,Network Service Mesh赢得了 15% 用户,Service Mesh Interface赢得了 13% 用户。
CI/CD
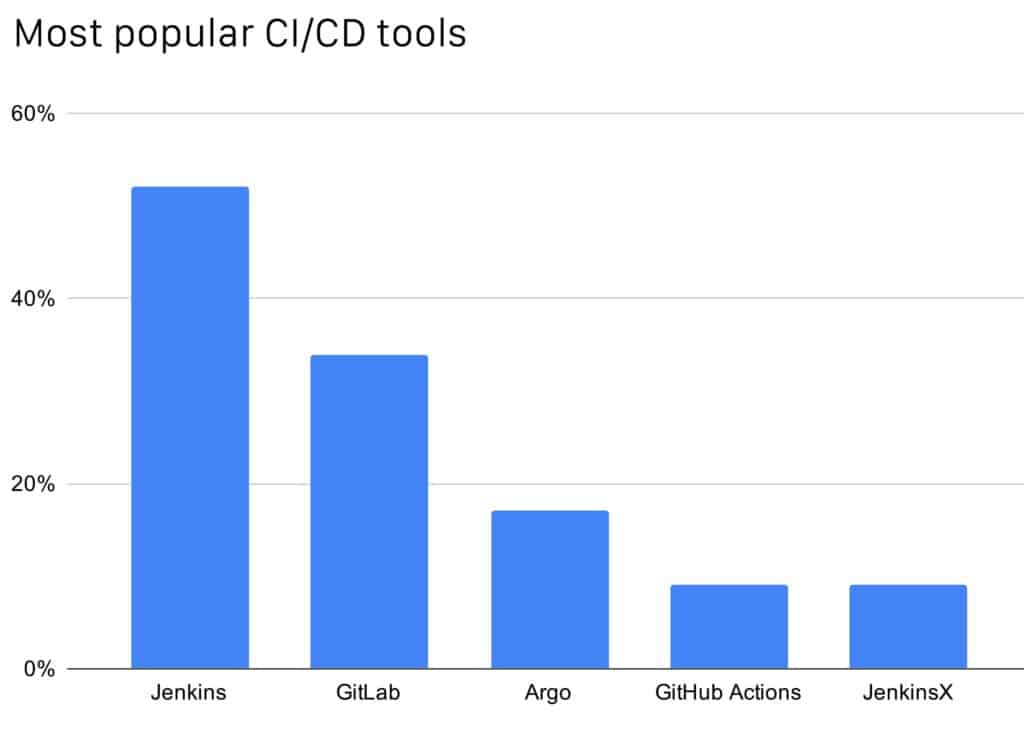
As already noted, more organizations are using automated release cycles. 73% of respondents run CI/CD pipelines in production. Another 19% are evaluating, and 5% plan to use them in the next 12 months. 如前所述,越来越多的单位使用自动发布周期。73% 的调查对象在生产中运行 CI/CD 流水线,另有 19% 调查对象在评估,还有15% 计划在未来12个月中使用。
The most popular CI/CD tool within the China community, Jenkins, is used by 52% of organizations, 35% use GitLab, and 17% use the incubating project, Argo. 中国社区中,最受欢迎的 CI/CD 工具是 Jenkins,拥有 52% 的用户;此外还有 35% 使用 GitLab,17% 使用孵化项目 Argo。
Monitoring, Logging, and Tracing 监控、日志和追踪
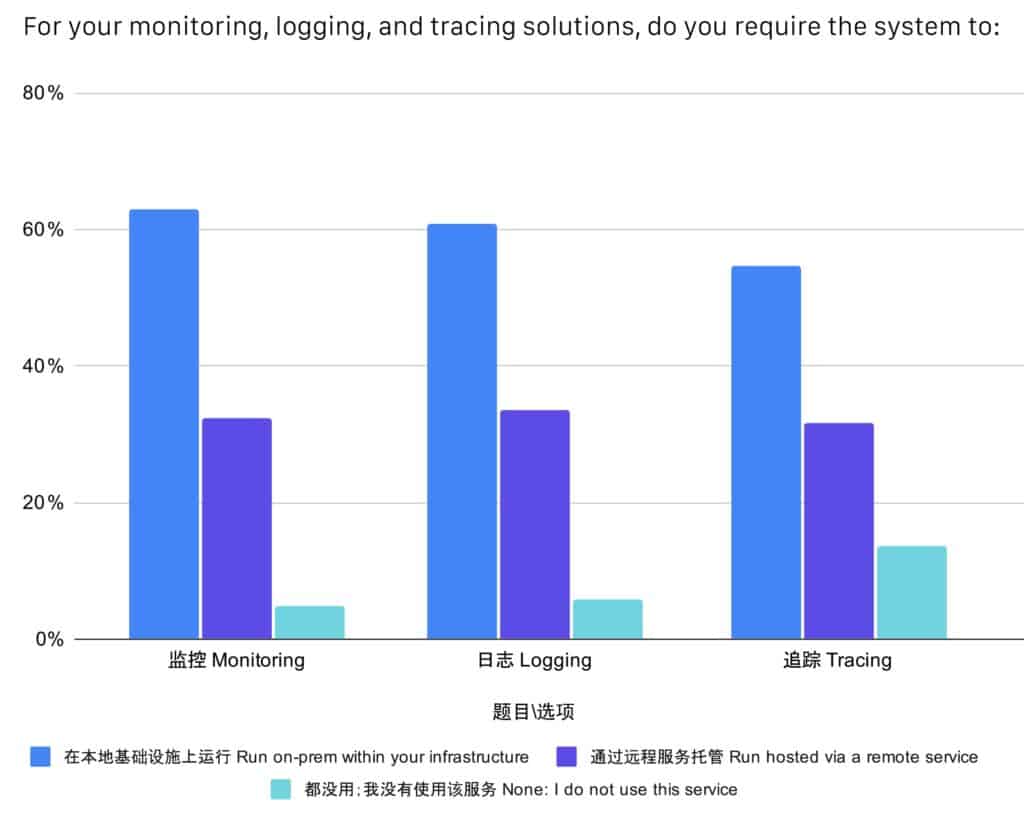
As deployments become increasingly complex, visibility is more critical than ever. As organizations realize the importance of cloud native observability, they are increasingly running monitoring, logging, and tracing tools in their deployments. 随着部署日益复杂,可见性比以往任何时候都更关键。各单位越来越多意识到云原生可观测性的重要意义,也就越来越倾向于在部署过程中进行监控、日志和追踪工具。
95% of organizations use monitoring tools, 94% use logging, and 86% use tracing. Of those using the tools, the majority run them on-premise within their infrastructure rather than hosted via a remote service. 95% 的单位使用监控工具,94% 使用日志,86% 使用追踪。在使用工具的单位中,大多数都会选择在自己的基础设施上本地运行,不会通过远程服务的方式使用托管服务。
Serverless 无服务器
Serverless still has room to grow, but we expect this growth to continue. 31% of organizations use serverless in production. 41% are evaluating—12% plan to use it in the next 12 months. 无服务器仍有增长空间,预计增长趋势会在未来持续。目前,31% 的单位在生产中使用无服务器,41% 在评估,12% 计划在未来 12 个月使用。
Of those that use serverless, 45% use a hosted platform, and 20% use installable software. 在使用无服务器的用户中,45% 使用托管平台,20% 使用可安装软件。
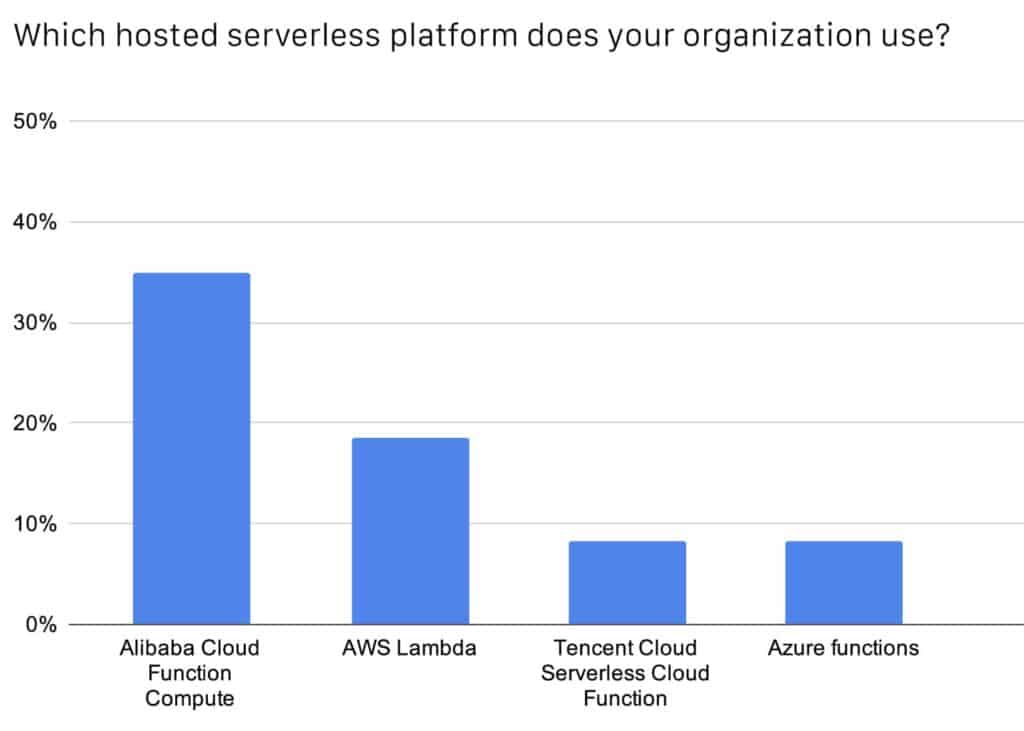
Of organizations using serverless via a ‘hosted platform,’ the most popular solutions again are Alibaba Cloud Function Compute, 33%, and AWS Lambda, 18%. Overall, responses were more distributed as new solutions emerged. 在通过“托管平台”使用无服务器的单位中,阿里云函数计算仍旧是最受欢迎的解决方案,受到了 33% 用户的青睐,另有 18% 的用户使用 AWS Lambda。总体来说,随着新的解决方案出现,用户会更多选择无服务器。
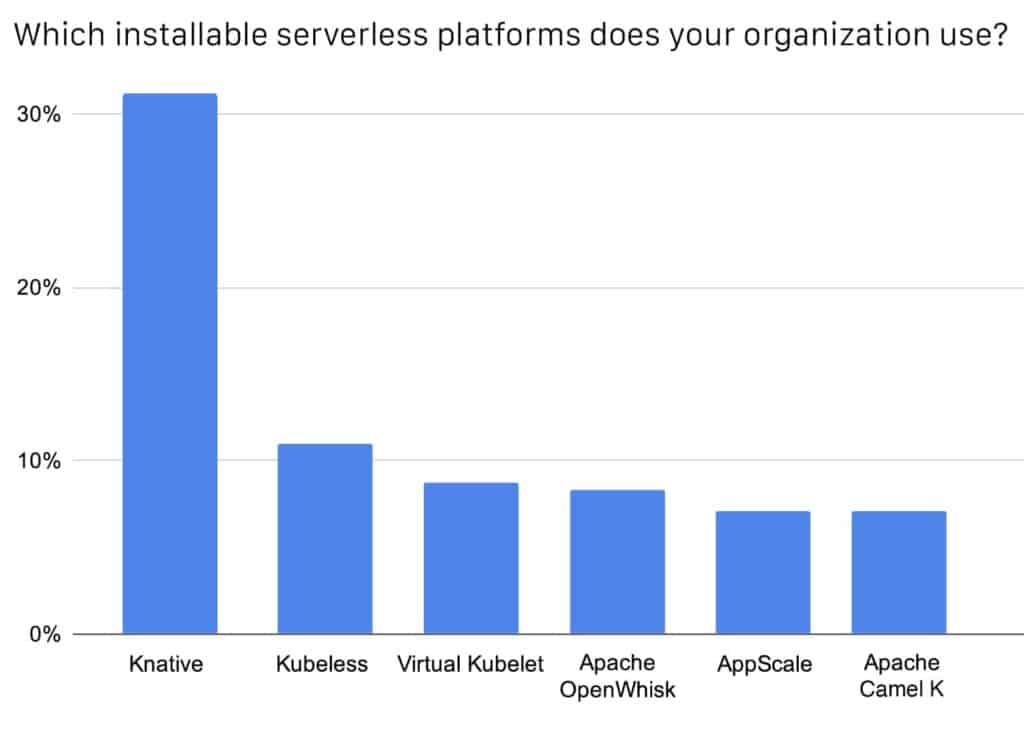
Of organizations using serverless via installable software, 29% use Knative, up from 22% in the last survey. Knative surpassed Kubeless, which dropped to 11% from 29%. Sandbox project, Virtual Kubelet came third at 9%. 通过可安装软件使用无服务器的机构中,29% 会使用 Knative,比上次调查的22%有所增长。Knative 超过 Kubeless,Kubeless 的使用量从29%下降到 11%。沙箱项目 Virtual Kubelet 以 9% 的份额位居第三。
Service Mesh 服务网格
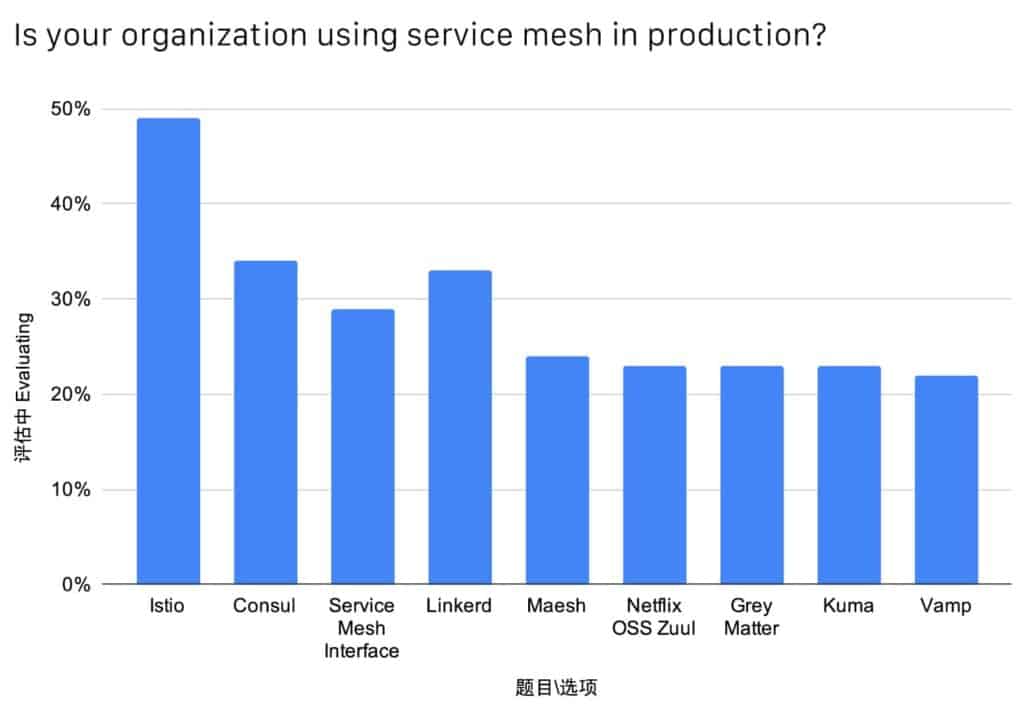
While service meshes are popular, with 38% of organizations using a service mesh in production, there is still complexity to iron out. 42% of respondents are evaluating the use of a service mesh, and 11% plan to use it in the next 12 months, so we expect this to be an area for growth in the coming years. 服务网格非常流行,38% 的单位在生产中使用服务网格,但其复杂性仍然有待降低。42% 的调查对象在评估服务网格,11% 计划在未来 12 个月使用,因此预计在未来年份中,服务网格会成为一个增长领域。
Of those using service mesh, the most popular tools are: 在使用服务网格的用户中,最受欢迎的工具包括:
Service Proxy 服务代理
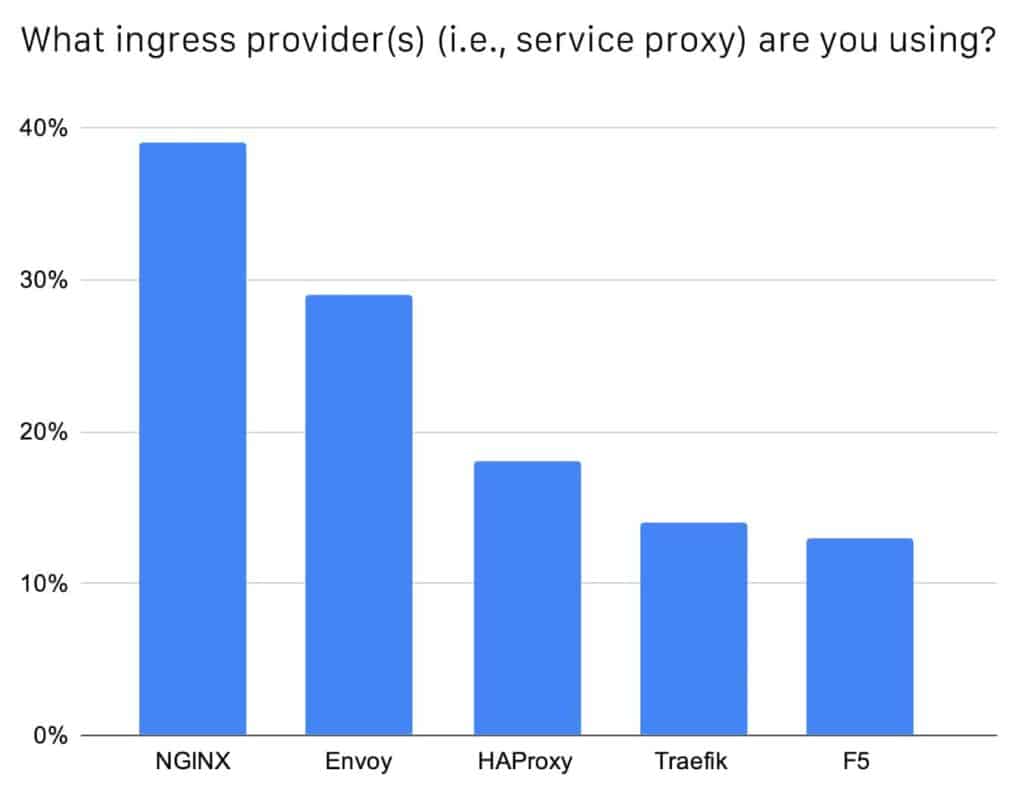
The majority of organizations, 56%, now use a service proxy in production. Another 26% are evaluating, and 7% plan to use one in the next 12 months. As service mesh usage grows, we expect ingress tools to grow as well, as they help control traffic to and from the service mesh. 目前大多数(56%)单位在生产中使用服务代理。另有 26% 在做评估,还有 7% 计划在未来12个月中使用。随着服务网格用量的增加,入口工具因可以控制往返服务网格的流量,使用有望实现增长。
Once again, NGINX (F5) was the most popular tool, but it dropped from 54% to 39%. Envoy, which was fourth last year, increased to 29% from 15%, surpassing F5 and HAProxy. NGINX (F5)再次成为最受欢迎的工具,但使用量却从 54% 减少到 39%。去年排名第四的 Envoy,超过 F5 和 HAProxy 从15%的份额增长到29%。
Storage 存储
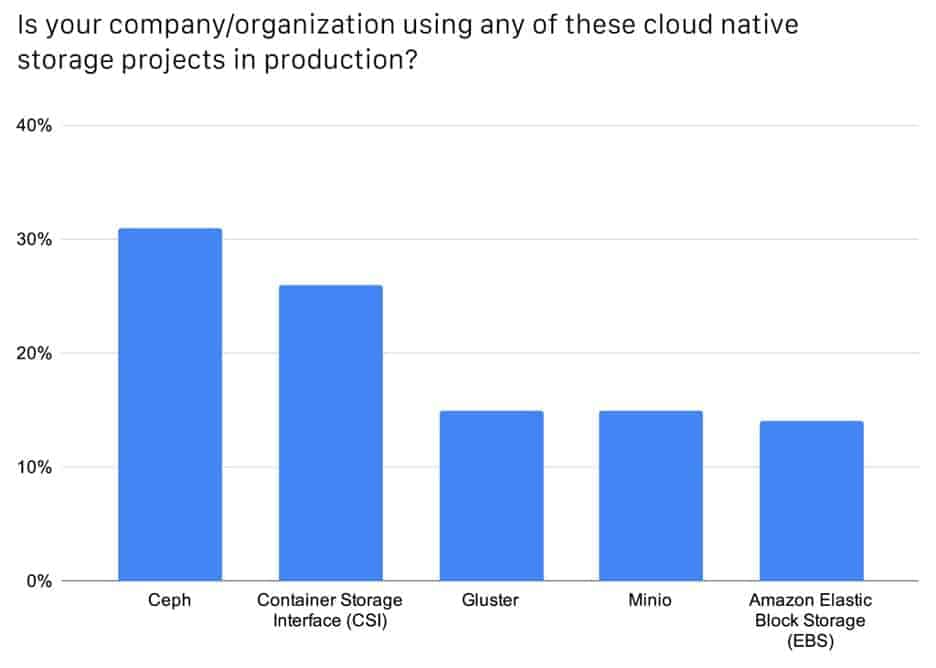
Cloud native storage tools are also popular, with nearly two-thirds, 64%, of organizations running stateful applications in production. Another 21% are evaluating, and 5% plan to in the next 12 months. 云原生存储工具人气也非常之高,将近 2/3(64%)的单位在生产中使用有状态应用程序。另有 21% 正在评估,5% 计划在未来 12 个月使用。
For cloud native storage, 31% use Ceph, 26% use CSI, 15% use Gluster, and 15% use Minio. 云原生存储中,31% 的用于选择 Ceph,26% 使用 CSI,15% 使用 Gluster,15% 使用 Minio。
The Cloud Native Community in China 中国的云原生社区
CNCF now has more than 60 members in China, representing more than 8% of total CNCF membership. China also has the third-largest contributor base to CNCF projects (contributors and committers) after the United States and Germany. Members PingCap and Huawei are the sixth and eighth-largest contributors overall, with nearly 85,000 and more than 66,000 contributions, respectively. 目前 CNCF 在中国有 60 个会员,占到全部会员总数的 8% 以上。继美国和德国之后,中国是 CNCF 项目第三大贡献者基地(贡献者和提交者)。在所有会员中,PingCap和华为分别以将近 85,000 项和超过 66,000 项贡献,位列第六和第八大贡献者。
CNCF also hosts 11 CNCF projects that were born in China: BFE (Baidu), Chaos Mesh (PingCAP), ChubaoFS (JD.com), CNI-Genie (Huawei), Dragonfly (Alibaba), Harbor (VMware China), KubeEdge (Huawei), OpenKruise (Alibaba), OpenYurt (Alibaba), TiKV (PingCAP), and Volcano (Huawei). CNCF 已有 11 个来自中国的 CNCF 项目:BFE(百度)、 Chaos Mesh (PingCAP)、 ChubaoFS(京东)、CNI-Genie(华为)、Dragonfly (阿里巴巴)、 Harbor(Vmware 中国)、 KubeEdge(华为)、 OpenKruise(阿里巴巴)、OpenYurt(阿里巴巴)、TiKV(PingCAP)和 Volcano(华为)。
Of the cloud native community in China, 94% say they would recommend CNCF projects and technologies. 中国的云原生社区中,94% 的会员称会推荐 CNCF 项目和技术。
Learn more about Cloud Native 了解云原生
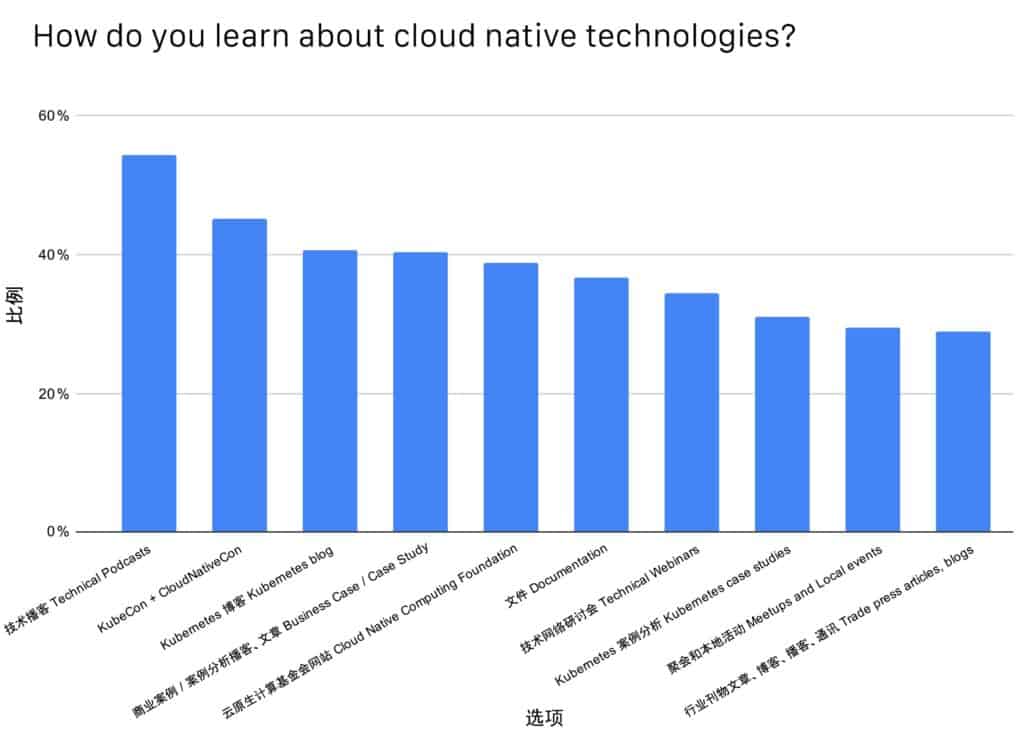
The cloud native community in China learns about cloud native technologies through many different avenues. 中国云原生社区会通过各种途径了解云原生技术。
Podcasts and Webinars 播客与网络研讨会
Technical podcasts were the most selected response for how the community learns about cloud native, chosen by 54% of respondents. 技术播客是社区了解云原生的主要途径,54% 的调查对象都会选择这一渠道了解云原生。
We recently revamped our Online Programs due to high demand and now offer both live and on-demand webinars. We also have a weekly community Livestream called Cloud Native Live. Programming is regularly scheduled for Chinese audiences. 最近应社区要求,我们修改了在线节目,目前可提供网络研讨会直播和点播服务。我们每周都会举行一次“云原生在线”社区直播。
Case studies were another popular response. Business case studies and articles were selected by 39%, and Kubernetes case studies by 31%. 案例分析也很受欢迎。39% 的调查对象选择了商业案例分析和文章,31% 的调查对象选择了Kubernetes案例分析。
We published two new CNCF case studies with Chinese End User members in 2020, including China Minsheng Bank and JD.com. 2020年,我们与中国的最终用户会员——中国民生银行 和 京东集团一起发布了 2 份新的CNCF案例分析。
Events 活动
45% of respondents selected KubeCon + CloudNativeCon events as a place where they learn about cloud native technologies. 45% 的调查对象选择 KubeCon + CloudNativeCon 大会了解云原生技术。
In 2020, we hosted our first virtual event in China, Cloud Native + Open Source Virtual Summit China 2020, which attracted 5,800+ attendees. We look forward to hosting a KubeCon + CloudNativeCon + Open SourceSummit China event later in 2021. 2020年,我们在中国主办了首次线上会议“Cloud Native + Open Source Virtual Summit China 2020”,参会人数达到 5,800 人。2021 年下半年,我们将举办“KubeCon + CloudNativeCon + Open Source Summit China”。
Another 29% selected meetups and local events. CNCF launched CNCF Community Groups in 2020 as a home for community events, including Meetups and Kubernetes Community Days. Moving forward, we expect these events to have physical and virtual components. Find a group or event near you. 还有 29% 调查对象选择聚会和本地活动。2020 年,CNCF 组建了 CNCF 社区小组作为社区活动地点,举办聚会和 Kubernetes 社区日等活动。未来我们希望举办此类线上和线下活动。寻找附近的小组或活动 。
CNCF.io and Kubernetes.io CNCF.io 与 Kubernetes.io
More than 40% of respondents learn about cloud native technologies through the Kubernetes blog, and another 37% mentioned the CNCF Website. 超过 40% 的调查对象通过 Kubernetes 博客了解云原生技术,另外还有 37% 通过 CNCF 网站。
CNCF members, project maintainers, and ambassadors are encouraged to submit vendor-neutral content to the CNCF blog to share knowledge with the broader community. 我们鼓励 CNCF 会员、项目单位和项目大使为 CNCF 博客提供供应商中立内容,在更广泛的社区范围分享知识。
CNCF, in partnership with The Linux Foundation, offers several training and certification programs. These were very popular in 2020, and 17% of KCSPs, 16% of KTPs, and 24% of Certified Kubernetes Conformance companies came from China. CNCF 与 Linux 基金会合作提供培训和认证项目。2020 年,项目受到了广泛欢迎,共有 17% KCSP、16% KTP 和 24% Kubernetes 一致性认证企业来自中国。
In partnership with Alibaba, CNCF continues to offer the free Kubernetes and Cloud Native course launched in 2019 and has been taken by more than 20,000 people. 2019 年,CNCF 与阿里巴巴合作推出了免费Kubernetes和Cloud Native 课程,目前已有 20,000 人接受了课程培训。
About the Survey Methodology & Respondents 调查方法与调查对象
A huge thank you to everyone who participated in this survey! 非常感谢所有参与本次调查的人!
The survey was conducted in December 2020 and January 2021. It was conducted in Mandarin, with 91% of the 439 respondents coming from Asia. Last year we had 300 respondents. 本次调查于 2020 年 12 月和 2021 年 1 月用中文进行,439 名调查对象中有 91% 来自亚洲。去年有 300 名调查对象接受了调查。
Almost half (49%) reported being part of the CNCF End User Community. 报告成员中,CNCF最终用户社区成员约占一半(49%)。
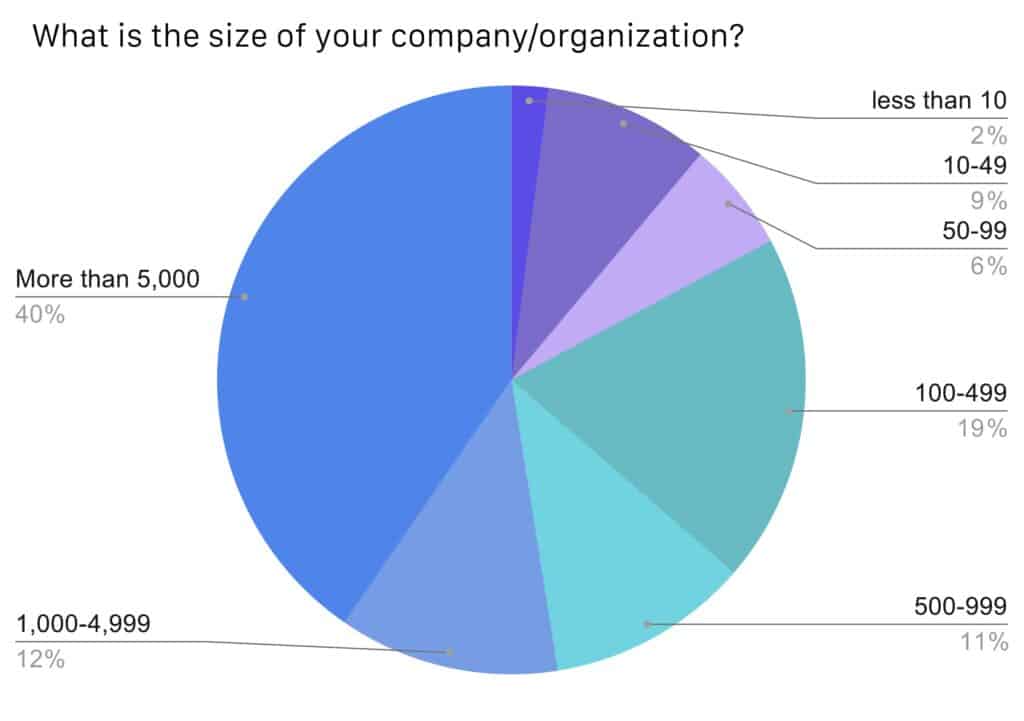
Most respondents came from enterprises. 40% were part of an organization with more than 5,000 employees, up from 23% last year. More than half were part of an organization with more than 1,000 employees, up from 40% last year. 大多数调查对象来自企业。40% 来自雇员超过 5,000 人的单位,比去年的23%有所增长。超过半数来自雇员超过 1,000 人的单位,比去年的40%有所增长。