
Guest post by Caleb Hailey, CEO at Sensu
This series is adapted from Sensu’s whitepaper on the top 7 APIs for cloud-native observability. Catch up on part 1.
In the first part of this series, I discussed the role of observability in the cloud-native journey, and how critical it is when performing any operation. I also laid the groundwork for what I’ve determined to be the top APIs for cloud-native observability, starting with the Kubernetes metrics, service, and container APIs. In this post, I’ll discuss the Kubernetes Pod and Downward APIs.
Kubernetes Pod API
- Primary/core workload API resource
- kubectl describe pod <pod name>
- Pod metadata, spec, and status
- Controller references
- Read log API (misc operation)
The Kubernetes API reference docs include the Pod API under Workload APIs. It can give you information such as the source of an image; the command you started with; which networking configuration has been applied to an individual container; execution environment variables; resource requirements; and more.
Regardless if you’re a Kubernetes expert or just getting started with Kubernetes, you have almost certainly run the command kubernetes describe pod <pod name>. This is one of the more well-known commands in the Kubernetes CLI tool. Like all the other primary, first-class resources in Kubernetes, this API gives you metadata, spec, and status information.
One interesting fact about Pods is that they are the core building block of all Kubernetes workloads, but it is unlikely that you will ever manage or configure them directly. Pods are typically created and managed via controllers. The most common workflows create Kubernetes StatefulSets, DaemonSets, Deployments, or Jobs; these controllers then create and manage one or more ReplicaSets, and ReplicaSets create and manage the actual pods.
The “Miscellaneous” API Function
As you go through the Kubernetes API reference docs, you’ll notice that every API endpoint supports your normal CRUD operations — create, read, update, and delete. Some of the API endpoints have what’s called “miscellaneous” functions, and the pod API has a very interesting miscellaneous function: to read the logs of any pod’s containers. If you’ve used the kubectl log command, you can get the very same output programmatically from the Kubernetes APIs.
Here’s a simple demo:
You can see I use kubectl to go and fetch logs from a container. I can request the logs for this particular pod, and for a specific container member of the pod. I can specify parameters to determine how much history I want to see, such as how many log lines to display, or how many seconds’ worth of logs.
If you are missing any of this context, and find yourself often running these kubectl log commands, know that you can get it all via the Pod API. Leveraging these APIs to fill gaps in your observability is a chance to learn something new.
Kubernetes Downward API
- Pod configuration directive
- Expose pod information via files or environment variables
- Alternative/complement to serviceAccount
- Useful with monitoring & observability tools
- Enhance observations with rich context
- Selectors: fieldref and resourcefieldref
- Available fields:
- metadata (labels and annotations)
- spec (nodeName and serviceAccountName)
- Status (status.podIP and status.hostIP)
The Kubernetes Downward API enables pods to expose information about themselves to containers running in the pod via files or environment variables. I find this one interesting because it’s using a different set of interfaces than we typically think of in the context of a modern API: files and environment variables (instead RESTful HTTP JSON APIs). Using files and environment variables provides access to a lot of rich context that can be exposed in backwards-compatible ways for legacy applications. You may have legacy applications that expect to consume certain information from files on disk, or from some known environment variable. With Kubernetes, you have all the tools you need to expose that very same information, dynamically, into running containers.
The Kubernetes reference documentation emphasizes the importance of gathering information about containers without coupling too tightly with Kubernetes:
Motivation for the Downward API
It is sometimes useful for a Container to have information about itself, without being overly coupled to Kubernetes. The Downward API allows containers to consume information about themselves or the cluster without using the Kubernetes client or API server.
An example is an existing application that assumes a particular well-known environment variable holds a unique identifier. One possibility is to wrap the application, but that is tedious and error prone, and it violates the goal of loose coupling. A better option would be to use the Pod’s name as an identifier, and inject the Pod’s name into the well-known environment variable.
The Downward API is actually a pod configuration directive. In your controller manifest — whether that’s a Deployment or StatefulSet or DaemonSet — you configure volume mounts or environment variables that read their contents or values from the downward API.
Some observability tools try to read directly from the Kubernetes APIs. That may not be an option for you in your environment, or if you’re operating a legacy system where you are trying to implement your monitoring or observability in Kubernetes using tools that weren’t natively designed to run there. This is an alternative way to expose richer information to those applications and your monitoring and observability tools.
The Downward API is one of the more interesting Kubernetes APIs because of the importance of high-cardinality in observability — structured events with highly variable values make for rich observations. The Downward API makes it easy to access a lot of rich context no matter what observability tools you’re using.
There are two different selectors that can be used in the Downward API: the fieldRef selector and the resourceFieldRef selector. The fieldref selector exposes most of the fields from the actual pod resource itself into a container. The resourceFieldRef selector exposes information about an individual container into the container itself. That could be context such as the CPU and memory requests, and/or limits for the container; you can expose these directly into the container using the Downward API.
The available fields in the fieldRef are the same three things that we have for managing our resources: metadata, spec, and status. “Metadata” is labels and annotations. “Spec” is things like the service account, or which underlying kubelet node this particular container is running on. That’s useful in case you need to correlate issues impacting multiple containers – are they all running on the same node? You likely already have monitoring or observability for the infrastructure that Kubernetes is running on, and if there are underlying faults, the information you get from the spec fieldRef enriches any observations or metrics you’re collecting from a container running inside a pod on a kubelet. Various kinds of status information also can be exposed.
Here’s a simple example of what it looks like to use the Downward API to expose the rich context — that is, the metadata — via files.
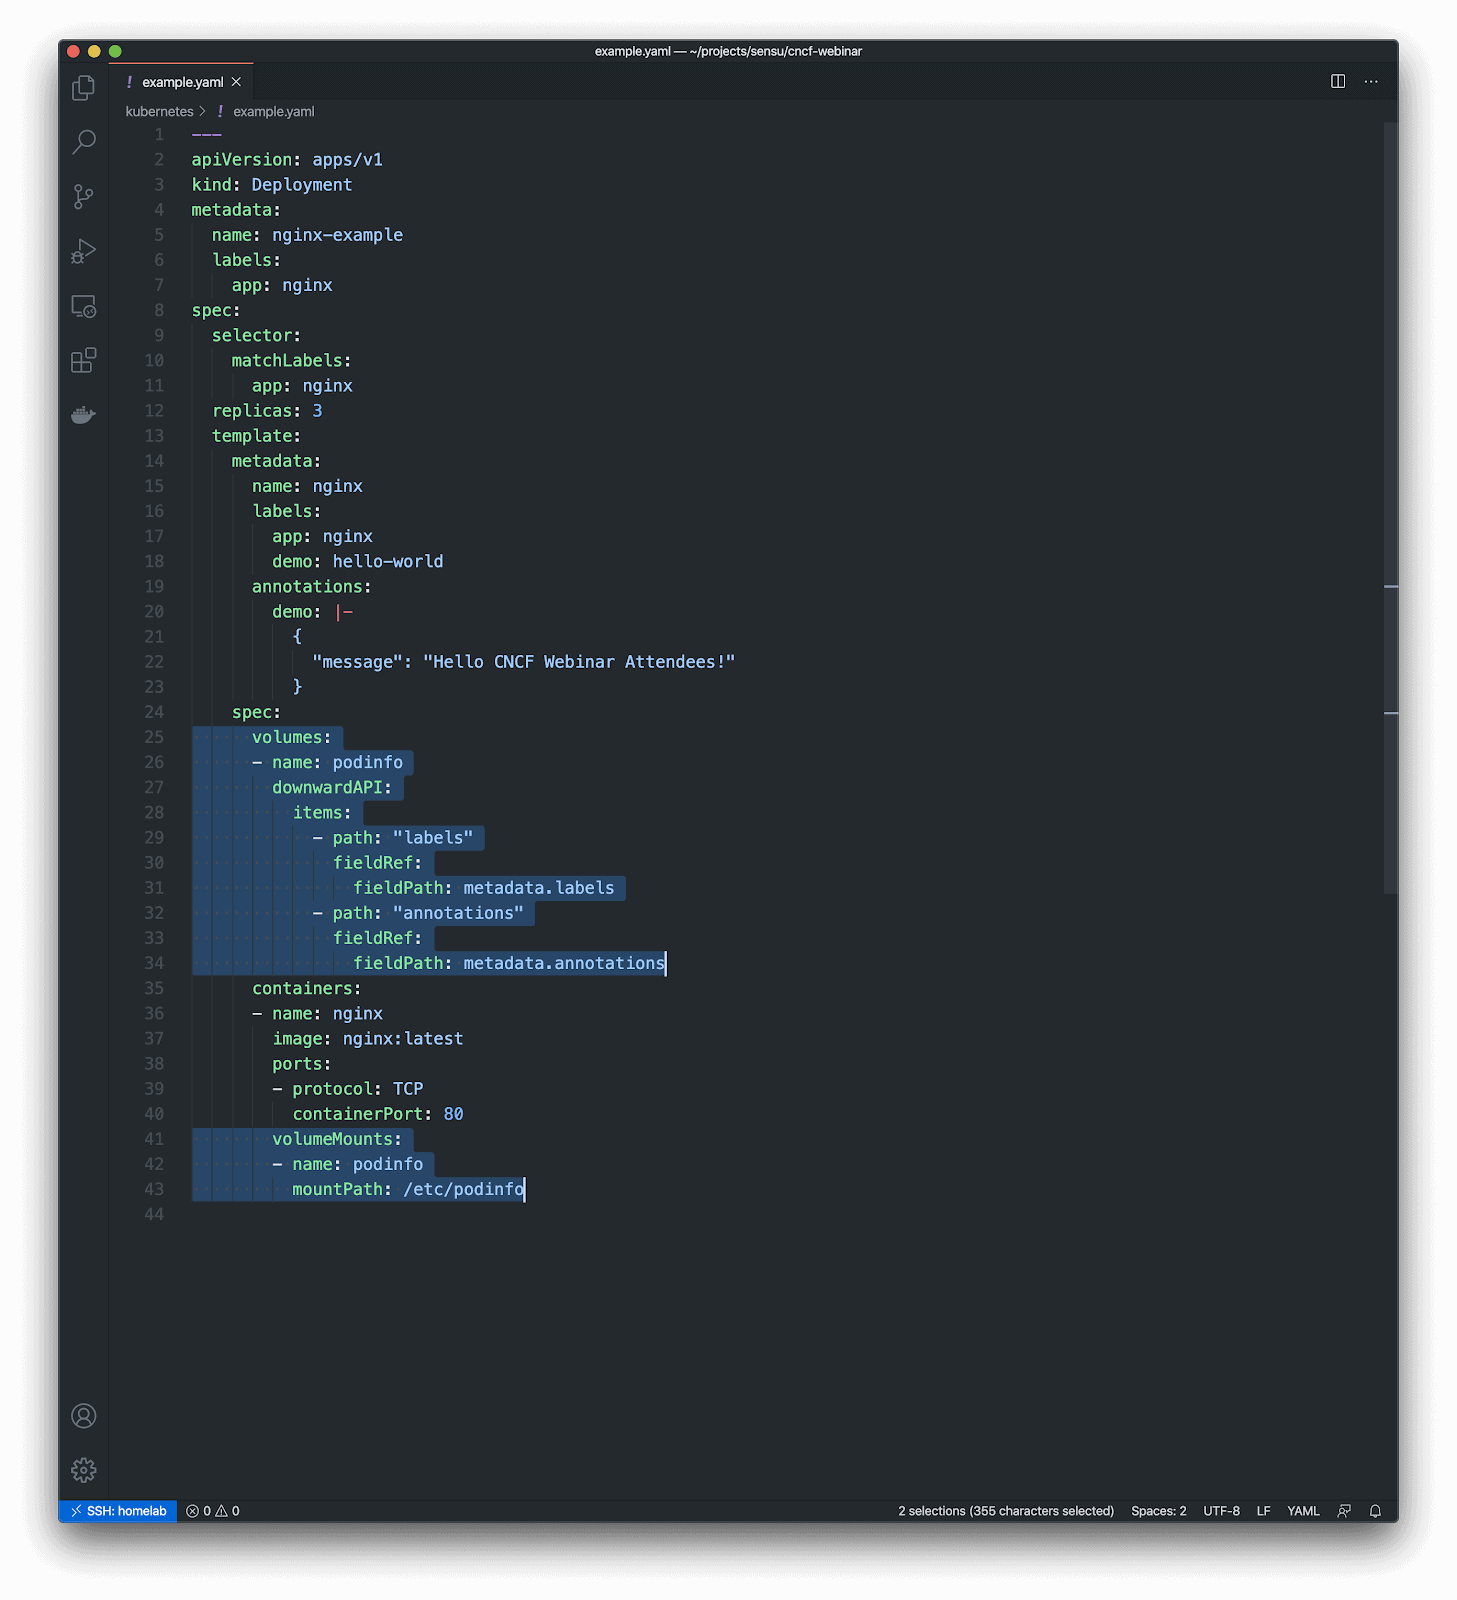
In this example I’m volume mounting files inside of a container using the Downward API. The end result will be a “podinfo” volume mounted at the path “/etc/podinfo”, with two files:
- /etc/podinfo/labels – a flat file containing all of the pod labels (in key=value format)
- /etc/podinfo/annotations – a flat file containing all of the pod annotations (in key=value format)
Alternatively, here’s a simple example of how to use the downward API to populate an environment variable value.
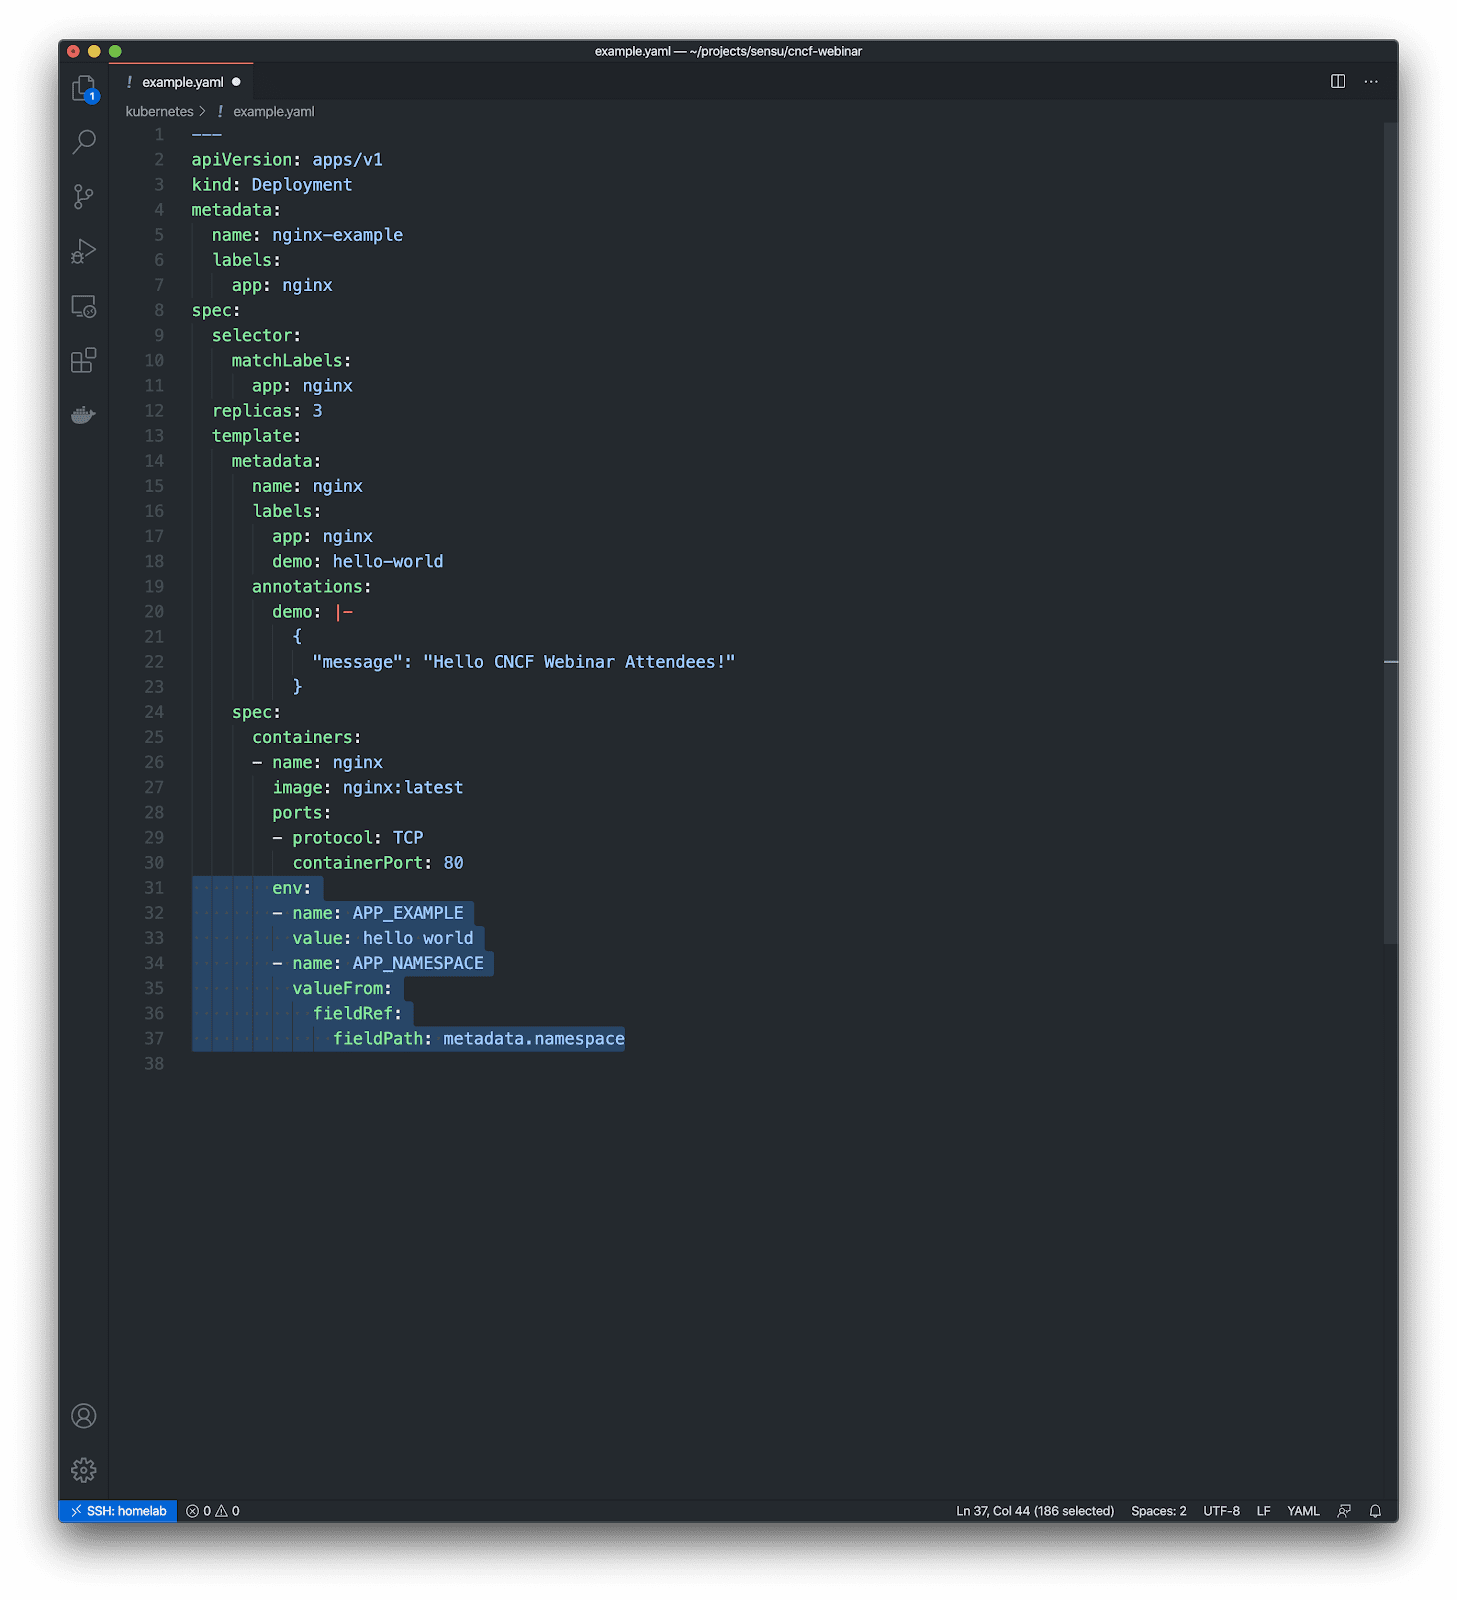
In this example I’m exposing the namespace the pod is running in as an environment variable called $APP_NAMESPACE inside the container. This is tremendously useful for exposing dynamic values to modern and/or legacy tools at predefined environment variables; e.g., if your observability tool expects an environment variable called $TOOL_SPECIAL_VALUE that should contain some value that we can extract from Kubernetes, the the Downward API is exactly the right tool for the job.
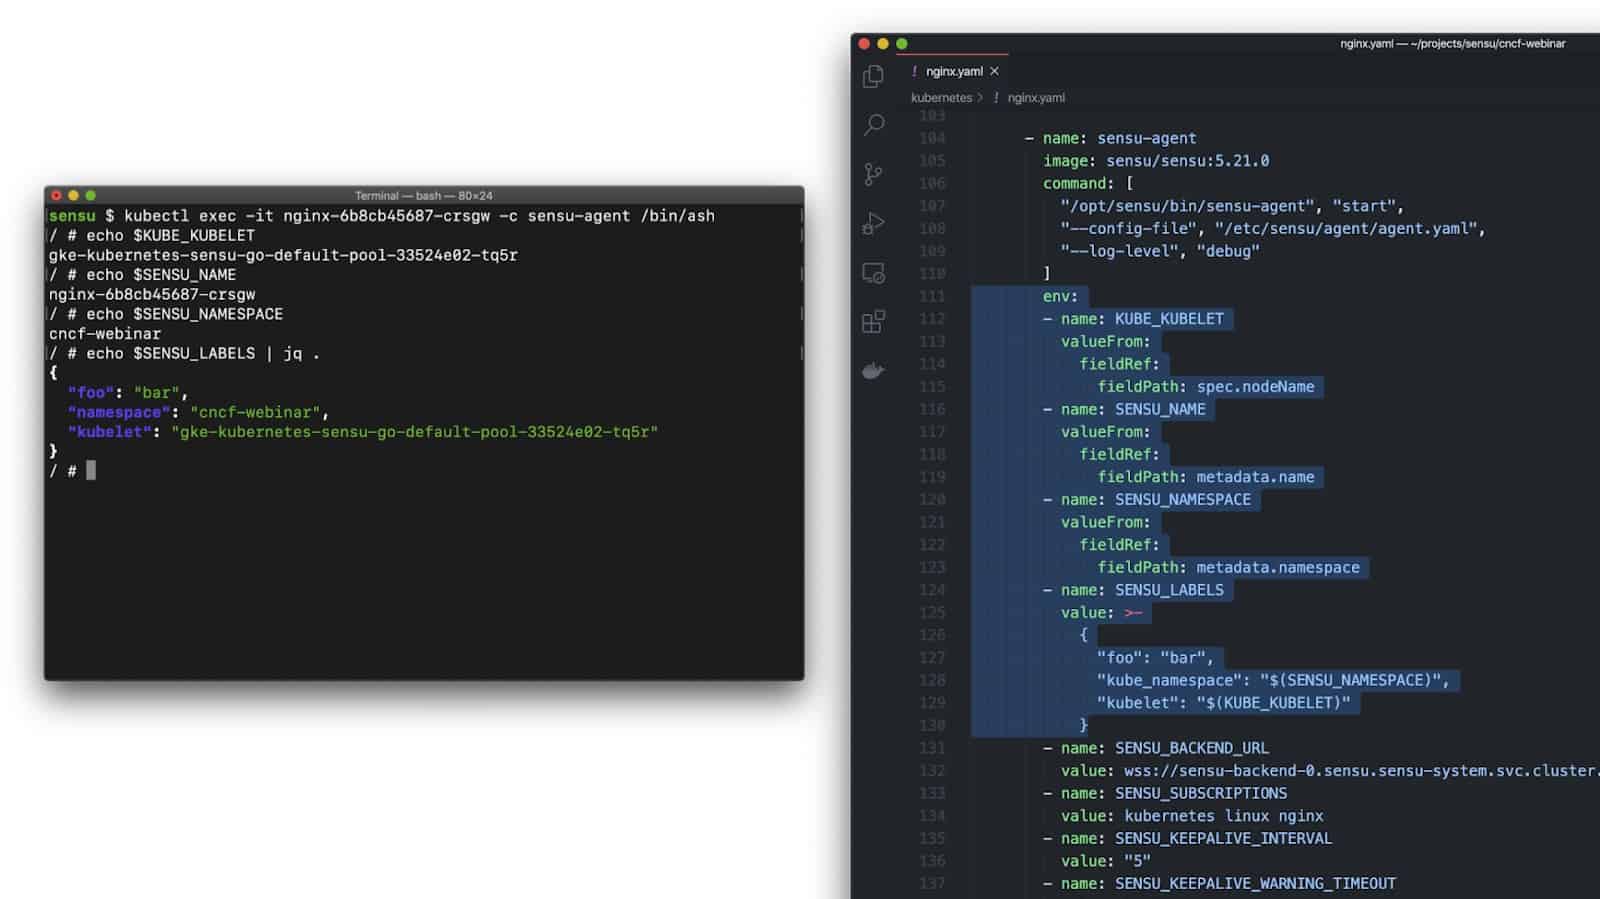
Here’s another simple demo — a live running container that was provisioned via the config file we just showed.
In this demo you can see a couple of example environment variables, and the /etc/podinfo mount path is a directory containing one file for each of the field lists – the labels file and of the annotations file. Note that it’s just one line per label or annotation, and key=value pairs, which are easy to parse from just about any programming language.
Now let’s move on to some richer examples, since one of the things that’s most interesting about the Downward API is rich context for observability.
Here are some practical examples:
- Expose the node name — the underlying kubelet node that the container is running in — as an environment variable.
- Configure your observability tooling, like Sensu, directly from your Kubernetes manifests.
- Expose Kubernetes labels or annotations — or other metadata about the operating environment — to your observability tools, so that all events produced from that pod can have this rich context.
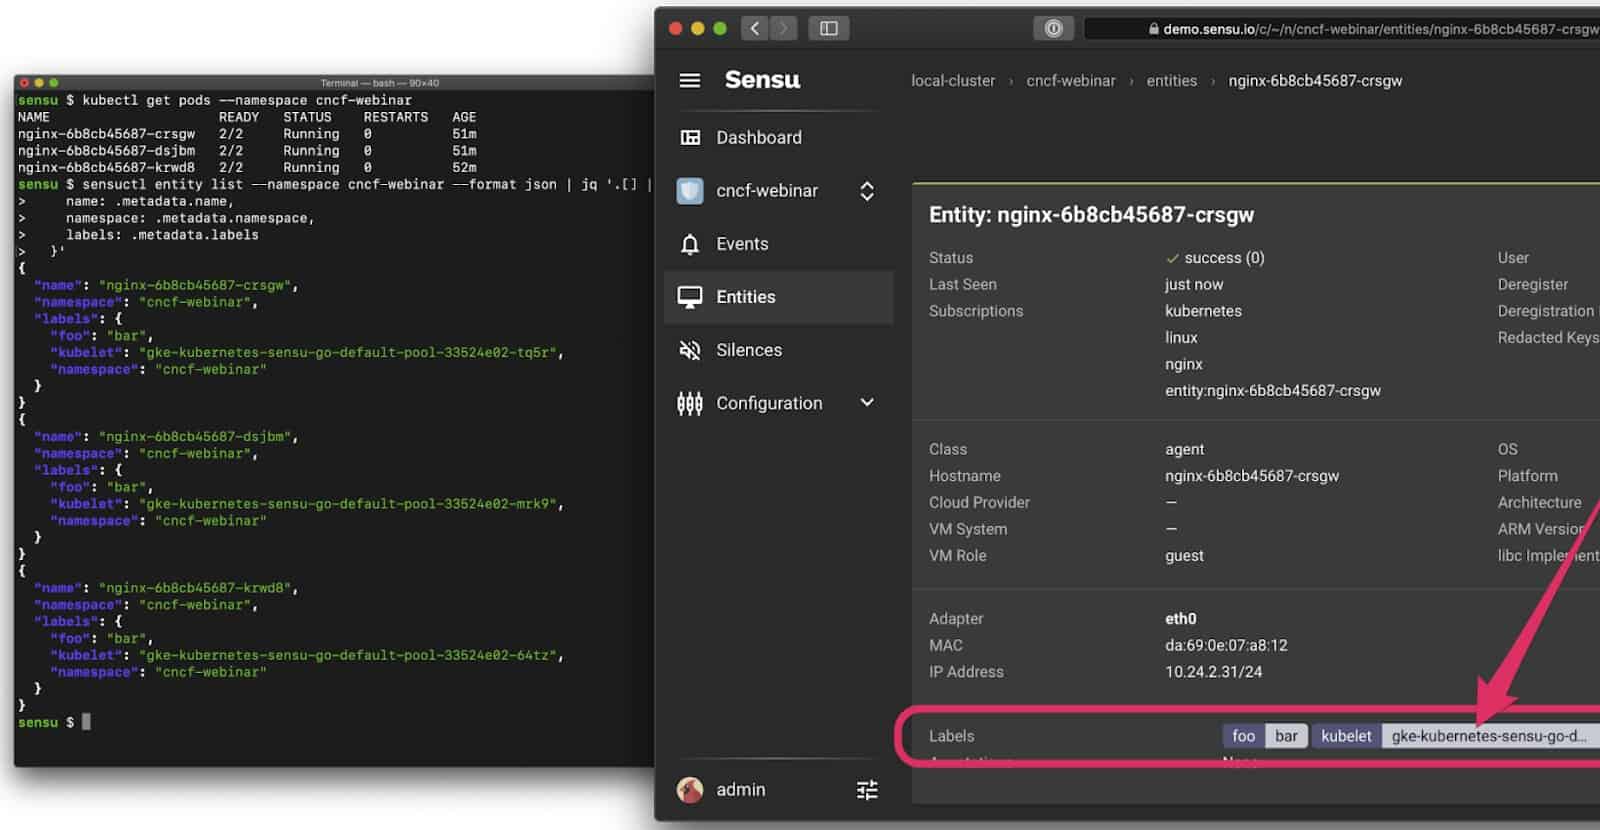
This last screenshot is particularly interesting because it’s a simple Deployment with three replicas, and when Kubernetes scheduled the Pods it ended up running one on each of my three Kubelets. I didn’t specifically ask for that — Kubernetes made that decision for me – but having that context make its way into our observations (e.g., the events produced by Sensu) is really valuable for observability, especially when troubleshooting issues in a production context.
In the third and final part of this series, I’ll discuss the Kubernetes Events API and API Watchers.