

Guest post by Caleb Hailey, CEO of Sensu (This series is adapted from Sensu’s whitepaper on the top 7 APIs for cloud-native observability)
An important early step (just after “Orchestration & Application Definition” in the CNCF trail map) in starting your cloud-native journey is picking solutions for observability, including monitoring, logging, and tracing. All of these observability tools leverage data available from Kubernetes’ comprehensive APIs. Those APIs provide insights into the events that are occurring inside of the Kubernetes platform, including answers to questions like: “What’s running in my Kubernetes cluster?”
CNCF Ambassador Chris Short and I recently co-hosted a webinar with the Cloud Native Computing Foundation on the seven most useful Kubernetes APIs for comprehensive cloud-native observability. In this three-part series, I’ll recap that webinar, walking through the various APIs that are necessary for complete visibility into your Kubernetes platform. You’ll come away with a deeper understanding of how Kubernetes works, with a behind-the-scenes look at cloud-native observability.
Observability and the cloud-native journey
Before I dive into the APIs, I want to talk about observability and its role in the cloud-native journey. At Sensu, we’re biased, of course — we think constantly about observability and monitoring. And we’re not alone. Last year I had the opportunity to sit down for dinner with Gene Kim, and I asked him why he thinks monitoring and observability are important. I loved his succinct answer:
“You can’t perform any operation without proper visibility.”
That immediately made me think of so many kinds of operations that require visibility in order to be successful — for example, driving a car (impossible if your windshield is covered in ice) or performing surgery (surgeons rely on a plethora of monitors and video scopes, depending on the type of operation). For anything you do, you have various instruments that give you information about the operation you’re performing, so you can do it correctly, and course-correct as needed.
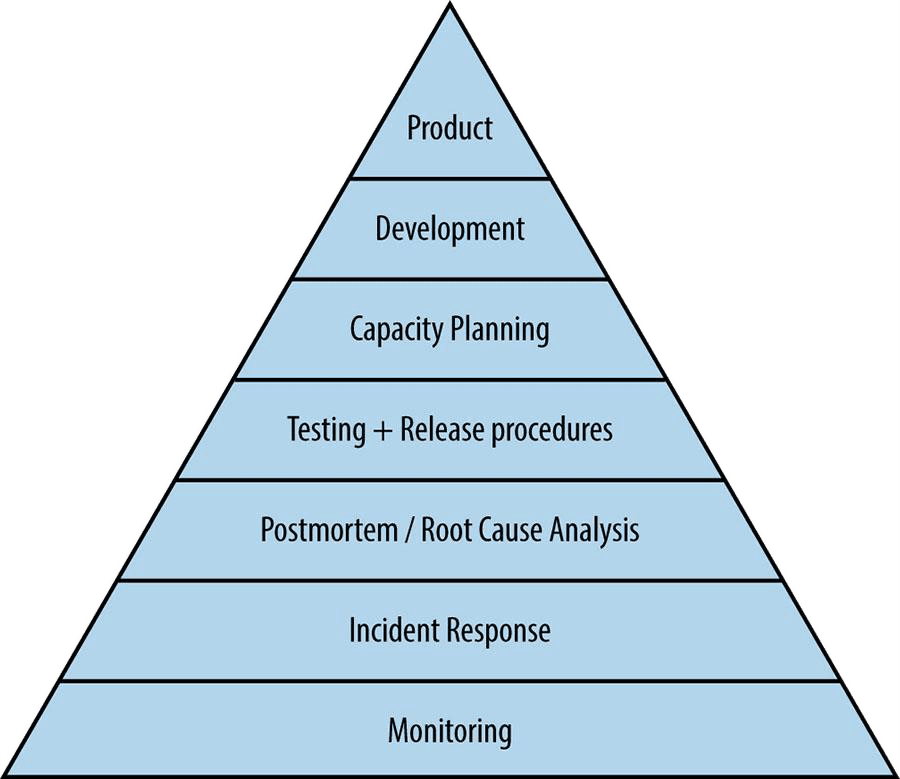
It’s exactly the same for systems. I’ve always liked the service reliability hierarchy diagram from Part 3 of the Google SRE book. You can see it places monitoring at the foot of the pyramid as the foundation for operating systems reliably.
I also like the CNCF trail map for enterprises embarking on their cloud native journey — it’s logical and easy to understand.
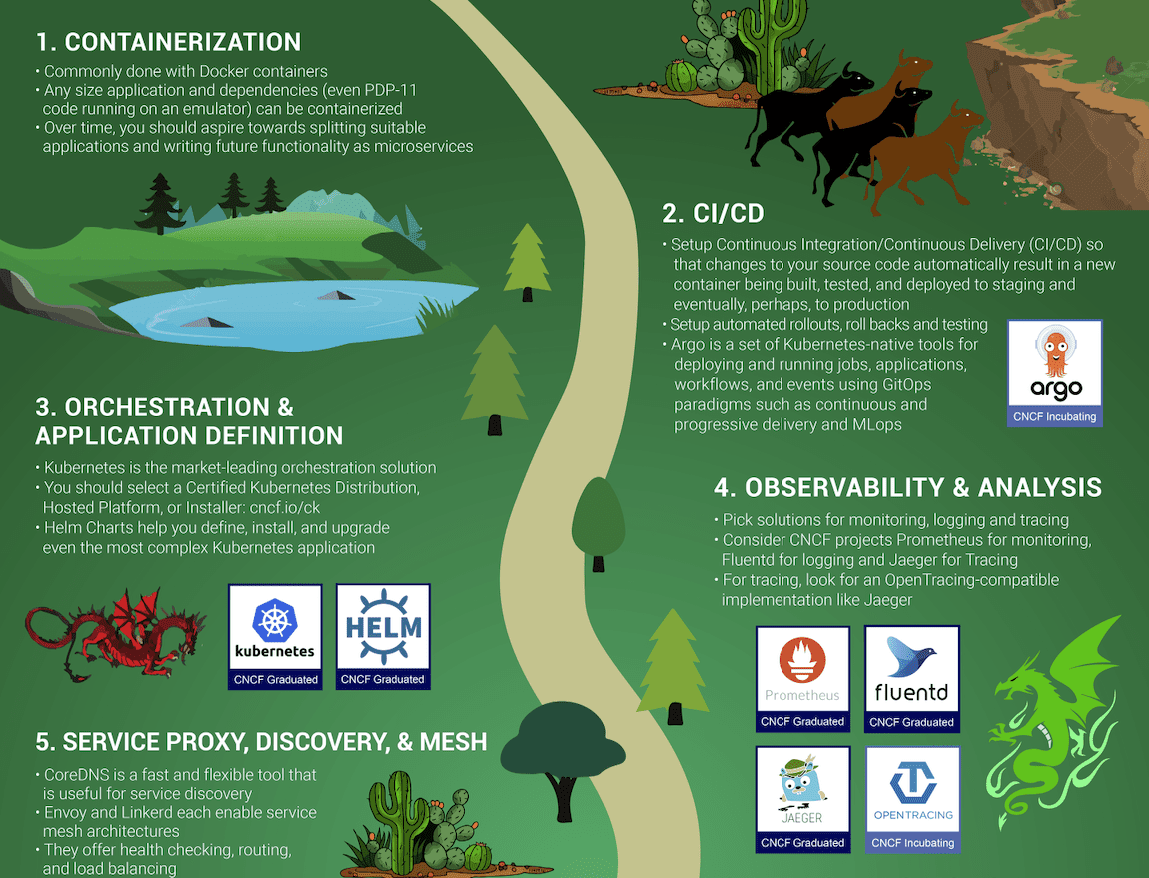
As you can see, the first step in the journey is containers. As the heart of all things cloud native, you need to understand what they are and how they work. Conceptually, a container is a tarball and some metadata; it isn’t really a technology of its own, but a collection of technologies that have been around for a long time – thanks to excellent work by Docker and others to productize the underlying technologies, containers have exploded in popularity over the past few years.
Once you understand how containers work, you need to start building container images as part of your CI/CD pipeline, with every new release of your software. Then you’ll need a container orchestration platform, and of course, the CNCF promotes Kubernetes as the natural choice (and we agree). Containers, CI/CD, and container orchestration are the foundation of your cloud native journey – but what comes next?
On the trail map, Observability & Analysis is Step No. 4, after Orchestration & Application Definition. There’s some text on the trail map that states, “everything after step #3 is optional based on your circumstance.” I don’t think this means that the CNCF believes observability is optional in production. I interpret it to mean that if you’re in a pre-production environment, in certain cases you might not need to be so concerned about everything after Step No. 3. But when you start building and operating mission-critical systems on Kubernetes — which is what we all aim to do — observability is absolutely not optional. It’s critical. Remember: “You can’t perform any operation without proper visibility.” Observability helps us improve our products and services, and it alerts us if/when things break.
Without further ado, let’s get to the top seven Kubernetes APIs for cloud-native observability.
The top 7 Kubernetes APIs for cloud-native observability
I’m listing the top 7 APIs in reverse order, from No. 7 to No. 1, because it seems like a logical way to talk about how these APIs work and how some can be used together. They are:
7. Kubernetes metrics APIs
6. Service APIs
5. Container API
4. Pod API
3. Kubernetes downward API
2. Kubernetes events API
1. Kubernetes API Watchers
These Kubernetes APIs will help you achieve a holistic view of your Kubernetes cluster’s health, delivering richer observations and the additional context you need to complement your normal metrics.
Please note that the order/rank of APIs in this list is very subjective – I’ve ranked some lower because they’re more well known and broadly supported across most monitoring and observability tools (e.g., metrics APIs and the Pod API), and others are ranked higher to raise awareness (e.g., Events API and API Watchers). In practice you’ll want to leverage all of these APIs to support an effective observability strategy, and the priority will vary depending on your needs, so keep up with this three-part series to learn more.
In this post, we’ll cover the metrics, service, and container APIs, and dive into the Pod and Downward APIs in part 2. We’ll close out the series with the Events API and API Watchers. As I get into the details of each of the APIs over the course of these blog posts, I think you’ll understand why they are all so valuable.
Kubernetes metrics APIs
- Best-known APIs for monitoring
- Built-in Prometheus exporters
- kubelet-metrics (including cadvisor)
- kube-state-metrics (cluster level)
- Consumable by most observability tools
The very core of monitoring is metrics, so you may be wondering, “Why has he put metrics APIs as No. 7 on this list of top Kubernetes APIs?” As mentioned earlier, the order of this list is subjective, and frankly, the metrics APIs are the best known and most–talked–about set of APIs for Kubernetes, I feel like they don’t need as much attention or explanation. There’s no question that metrics are critical, which is why it’s now table stakes for any modern monitoring & observability solution to collect Kubernetes metrics.
All the Kubernetes metrics are exposed as Prometheus endpoints, so anything that can consume Prometheus metrics can collect these metrics.
Kubernetes Service APIs
- Networking configuration, including Ingress, Endpoint, and Service resources
- Service metadata, spec, and status
- Service ports, internal and external IP addresses, load balancing and label selector configuration details
- kubectl describe service <service>
In a nutshell, Kubernetes service APIs are vital if you need to monitor anything more than a single pod — for example, a running application. It’s often argued that Kubernetes is best suited for microservice architectures, so if you’re using Kubernetes, you are likely going to be running disparate applications or services. And these need to be able to communicate with one another (via Kubernetes Services).
Without proper visibility into your Kubernetes Services, you could have a situation where your applications are functional and your observability data from pods themselves is not reporting any errors. But if your applications aren’t equipped to detect and/or report on network failures, and you aren’t monitoring the Services, you’re going to have some blind spots.
You may already be familiar with exploring the state of a Service via kubectl describe service commands. But in fact, you can get all that status information from the Service APIs. I’ve ranked the Service API as No. 6 on the list because it’s a well-known component of Kubernetes, but if you’re overly familiar with kubectl service commands due to frequent troubleshooting, that might be a clue that you need to improve your monitoring and observability around Kubernetes Services via the Services API.
Kubernetes container API
- Pod API resource
- Information about running containers
- Container status and details, including image source, commands, networking, execution environment, and resource requirements
In my opinion, the container API is really a kind of quasi-API. While it’s listed in the Kubernetes API reference docs, containers are not actually a first-class resource in Kubernetes. You won’t find a container endpoint anywhere in the Kubernetes API.
Because containers are actually a component or resource of a Pod, you can get information about running containers via the Pod API, including configured resource limits and resource requests (for example, CPU and memory). Earlier we mentioned that the various Kubernetes metrics APIs also include things like cAdvisor metrics (i.e., per-container resource consumption), so if your current observability solution lacks the ability to drill-down into container-level metrics and overall container health, you may need to investigate whether you’re collecting container data from the Pod API and all of the available metrics APIs (e.g., kubelet metrics).
That’s a wrap for part 1! Stay tuned for part 2, where I’ll dive into the Kubernetes Pod and downward APIs.