
Establishing unified observability and governance across hybrid platforms with OpenTelemetry
Introduction
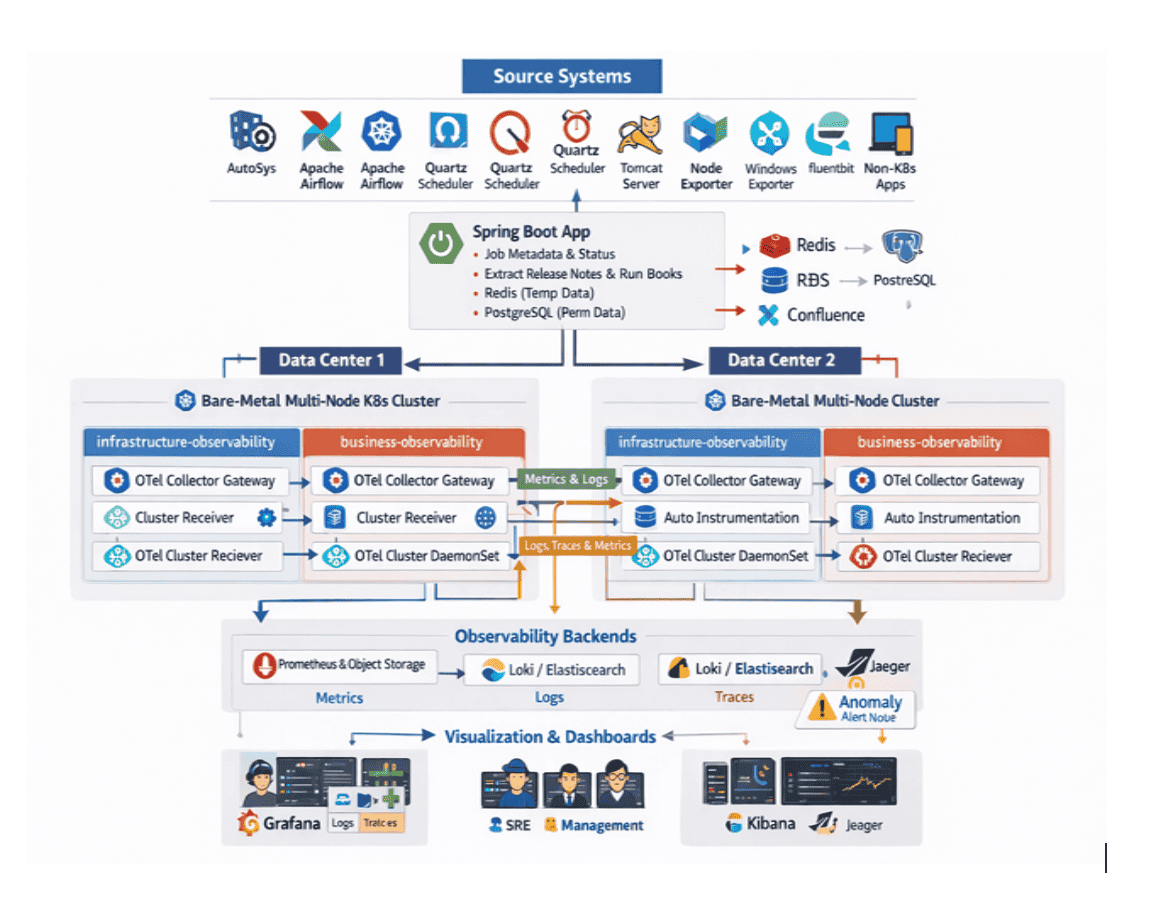
A globally renowned financial institution modernized a large application estate from mainframes and vendor platforms to cloud‑native services (including Java and Python) running on Kubernetes across private and public clouds. Applications are deployed across two geographically separated data centers for high availability, while batch processing relies on AutoSys with Job Information Language (JIL) files stored in GitHub/Bitbucket and metadata in PostgreSQL. The end-to-end customer journey depends heavily on multiple third-party systems, each operating its own monitoring or observability platform. Applications span Kubernetes and non-Kubernetes environments and expose interfaces through REST, SOAP, and command-line access, further complicating unified observability, increasing operational overhead and elongating incident timelines.


Challenges
The organization faced vendor lock‑in and rising costs from multi‑tool sprawl and uncontrolled telemetry ingestion/retention. Hybrid visibility was limited: legacy platforms and Kubernetes estates were observed separately, dashboards proliferated, and alerting was largely reactive, generating more than half of alerts as noise on legacy systems. Logs, metrics, traces, and events were not adequately correlated, pushing mean‑time‑to‑detect (MTTD)/ mean‑time‑to‑resolve (MTTR) higher during peak periods. Incident remediation depended on manual scripts and scattered runbooks (Jive/Confluence), while long‑running batch jobs exposed little intermediate state, complicating RCA across mainframe and external dependencies. There was also no synthetic monitoring for legacy or third‑party systems, incomplete service maps of end‑to‑end customer journeys, and a lack of centralized, persona‑based views with Service Level Indicators (SLIs) and Service Level Objectives (SLOs)governance.
Solution
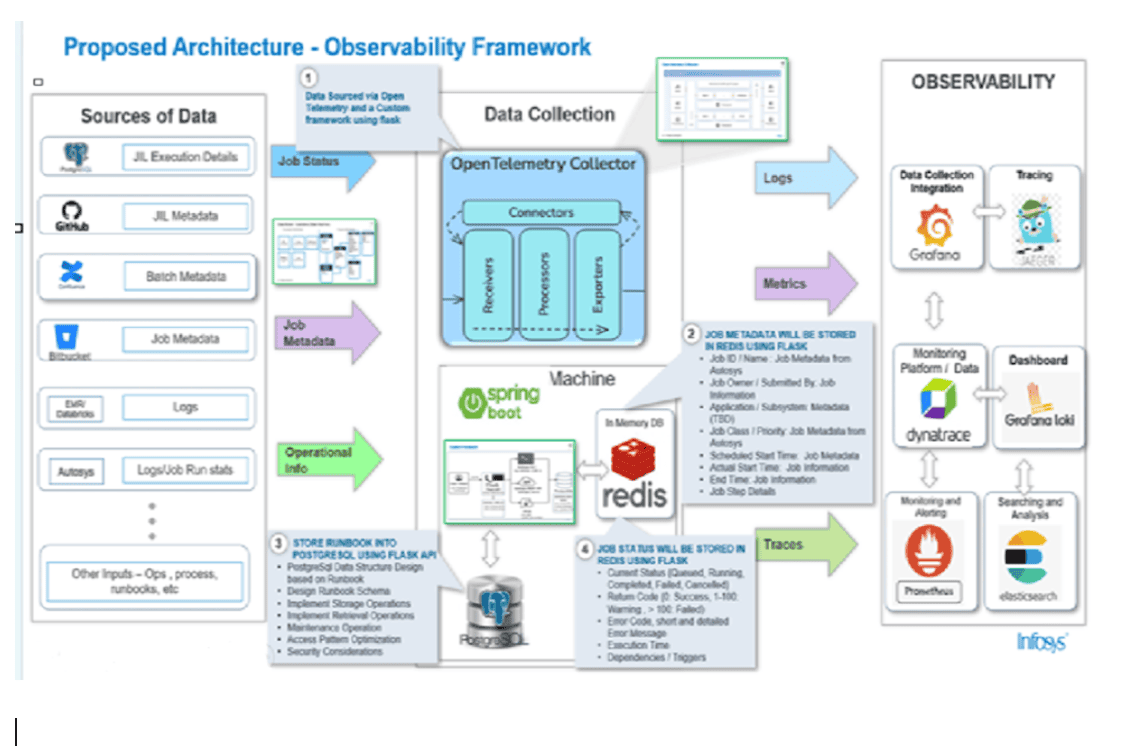
In late 2025, after repeated batch job failures across multiple technology stacks, Infosys suggested adopting a single unified observability and automation platform to replace scattered monitoring tools and manual troubleshooting. With one implementation, the team consolidated logs, metrics, traces, events, service maps, and synthetic monitoring—giving every batch system a common operational backbone.
A phased rollout enabled smooth migration from legacy and cloud environments. As visibility gaps surfaced, the team built custom instrumentation to track intermediate job states and improve correlation across mainframe and distributed dependencies.
Rolebased dashboards became the primary troubleshooting and reporting interface: executives received highlevel service health views, SREs used deep operational insights for RCA, and developers accessed steplevel failure details.
The platform also introduced autohealing by triggering predefined Ansible remediation scripts whenever known error patterns appeared, resolving many recurring issues without human intervention. With synthetic monitoring and end-to-end maps of all batch flows, failures can now be detected earlier and resolved faster than ever before.
Before/after
| Dimension | Before | After |
| Tooling | Multiple vendors with tight coupling and high license/storage costs | OpenTelemetry first pipelines with backend portability and right‑sized retention |
| Signal Correlation | Logs, metrics, and traces handled in silos | Trace ID correlation across signals and events |
| Alerting | Reactive and noisy; RCA driven by war‑rooms | Actionable alerts with noise suppression and faster RCA |
| Coverage | Either Kubernetes or legacy, but rarely both | Unified visibility across K8s, non‑K8s, batch, and third‑party |
| Dashboards | URL sprawl and non‑persona views | Centralized, persona‑based dashboards |
| Governance | Limited SLI/SLO tracking | Reliability governance with trend reporting |
Impact
By consolidating on OpenTelemetry and correlating signals end‑to‑end, the platform reduced alert noise by roughly 50%, with anomaly suppression eliminating an additional 70–85%; MTTD and MTTRmean‑time‑to‑resolve improved by about 40%, incident escalations fell by ~35%, SRE and developer productivity rose by ~30%, and overall costs declined by ~20% due to vendor‑neutral backends all while sustaining 99.99% availability across multi‑data‑center Kubernetes.
KPI Table
| KPI | Delta improvement | Measurement Source |
| Alert Noise (%) | ↓ ~50% | Alert logs, Rule hits |
| MTTD (min) | ↓ ~40% | Signal to alert timeline |
| MTTR (min) | ↓ ~40% | Incident system |
| Incident Escalations | ↓ ~35% | On‑call escalation logs |
| Platform Uptime | 99.99% | SLO dashboard |
| SRE/Dev Productivity | ↑ ~30% | Time‑on‑call, MTTK, toil surveys |
| Cost to Observe ($/month) | ↓ ~20% | Licensing + storage BOM |
Looking forward
The enterprise will continue strengthening its end-to-end observability platform by expanding capabilities across each layer of architecture. Within both data centers, the footprint of OpenTelemetry Collector Gateways and Cluster Receivers will grow to support higher volume batch workloads and provide richer instrumentation for longrunning, computeintensive processes. All telemetry logs, metrics, traces, and events will continue shift away from disparate APM tools such as Dynatrace, DataDog, and Splunk, toward a single OpenTelemetrynative pipeline backed by Prometheus, Loki/Elasticsearch, Jaeger, and a homebuilt analytical data mart for long-term storage and financial data monetization.
As the architecture matures, the initiative will deliver a fully unified, proactive, AIdriven, and self-correcting observability ecosystem—transforming complex hybrid batch operations into a predictable, resilient, cost-efficient, and insight-rich environment for the entire enterprise.