Adform: Providing monitoring as a service with Prometheus
Challenge
Adform has a large infrastructure: OpenStack-based private clouds running on 1,100 physical servers in 7 data centers around the world, 3 of which were opened in the past year. With the company’s growth, the infrastructure team wanted to enrich its infrastructure and application metrics.
Solution
The team chose Prometheus “because of its great flexibility and loads of integrations,” says IT System Engineer Edgaras Apšega. “We use it with Consul, OpenStack, and Kubernetes service discovery, and it allows infrastructure and application monitoring to scale together with applications.” The DevOps team is now providing Monitoring as a Service at Adform based on Prometheus.
Impact
Prometheus “provides high availability for metrics and alerting,” says Apšega. “We monitor everything starting from hardware to applications. Having all the metrics in Grafana dashboards provides great insight on your systems.” Now that metrics are automatically scraped from various places like Openstack, Kubernetes, and Consul, “developers don’t need to think about the monitoring part whenever they’re launching their applications,” Apšega adds. “Even dashboards are automatically predefined, so we believe that for new applications, developers save about one day that would otherwise be spent on monitoring infrastructure setup.”
Projects used


By the numbers
Time savings
One day that would otherwise be spent on setting up monitoring infrastructure
Cost savings
4-5x lower costs for setting up hardware/virtual machines, metrics, and logging
Volume
10 Prometheus instances, 5000+ scraping targets, 2M+ timeseries per instance
Founded in 2002 with the mission of providing a secure and transparent full stack of advertising technology to enable digital ads across devices, Adform has gradually built a large infrastructure:
OpenStack-based private clouds running on 1,100 physical servers in the company’s own seven data centers around the world, three of which were opened in the past year. Recently, that growth has led the company onto a cloud native path, as the team running the infrastructure recognized a need for greater flexibility and observability.
Prometheus was Adform’s first foray into cloud native technology. The company was already using Graphite and Zabbix for monitoring and alerting, but by the summer of 2017, “we were looking into solutions of how to enrich our infrastructure and application metrics,” says IT System Engineer Edgaras Apšega. “Ceph was one of the cases, and we found that there was a Ceph exporter written by Digital Ocean for Prometheus. At first, we launched Prometheus monitoring just for Ceph metrics, but quickly it became the de facto monitoring solution for the whole infrastructure and all applications because of its great flexibility and loads of integrations.”
The team particularly liked that Prometheus was easy to implement and had dimensional data metrics on which alerts could be based. Plus, says Apšega, “another selling point is the Infrastructure as Code approach: configuration files that can be simply modified, like writing code.”
Across the board, “Prometheus solved several problems for us, like high availability, centralized targets configuration, and service discovery,” says IT Systems Engineer Andrius Cibulskis. “Most of all, Prometheus seemed to be less Disk I/O intensive than any other solution, so it helped with cost savings.”
The team’s successful implementation of Prometheus gave it added confidence when it decided later that year to use Kubernetes for container orchestration. “We learned about cloud native technology with Prometheus, and we saw there’s a Kubernetes movement,” says Cibulskis. “We already knew that the Cloud Native Computing Foundation incubates both projects.”
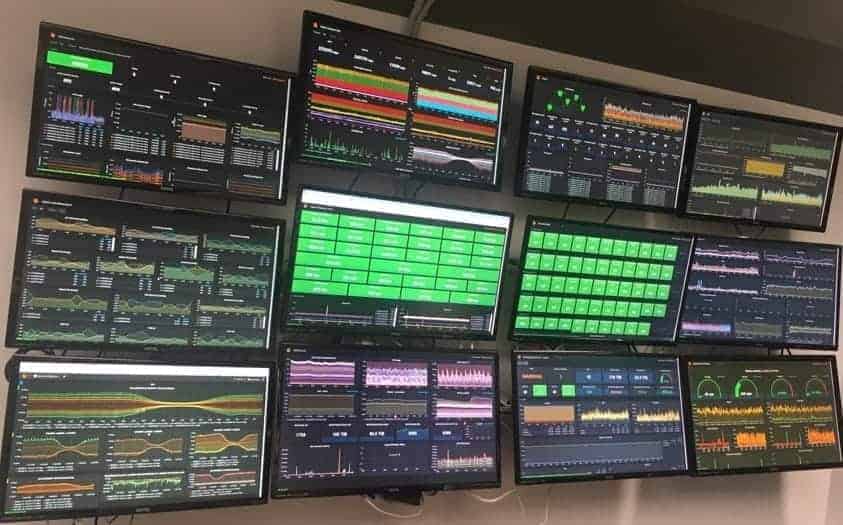
Today, Adform has 10 Prometheus instances with 2M+ timeseries per instance, and 5000+ scraping targets through all tiers, and all around the office, there are monitors on the walls displaying metrics. “Prometheus allows infrastructure and application monitoring to scale together with applications,” says Apšega. “We monitor everything starting from hardware to applications. Having all the metrics in Grafana dashboards provides great insight on your systems. It becomes easy to troubleshoot when you can see history of all critical metrics.”
“Prometheus enables us to have rich dashboards on our infrastructure and services. We have dashboards all around the office—every team has a few monitors hanging just to display some metrics—and online. It becomes easy to troubleshoot when you can see the history of all critical metrics.”
— EDGARAS APŠEGA, IT SYSTEM ENGINEER AT ADFORM
For example, the team has used Prometheus and Node Exporter to find the root cause of network issues. “Prometheus scrapes targets every 5 seconds, and we can notice every abnormal spike,” says Cibulskis. “Before, with other monitoring tools, we couldn’t. Node Exporter provided us a rich networking metrics that showed us where the problem was.”
Adform’s DevOps teams are now providing Monitoring as a Service based on Prometheus, AlertManager, Grafana, and Unsee. With the help of Thanos, they’ve been able to solve the problems of high availability as well as long term storage. Now that metrics are automatically scraped from various places like OpenStack, Kubernetes, and Consul, “developers don’t need to think about the monitoring part whenever they’re launching their applications,” Apšega says. “Even dashboards are automatically predefined, so we believe that for new applications, developers save about one day that would otherwise be spent on monitoring infrastructure setup.”
Linas Daneliukas, who is part of the DevOps team responsible for MaaS, says the goal is to provide operating system-level metrics by default: “Once you create a VM in our OpenStack-based cloud, bootstrap a physical server via Foreman, or deploy a container in our Kubernetes cluster, we will automatically scrape the OS-level metrics and provide them in a pre-created dashboard in Grafana within an hour.”
“At first, we launched Prometheus monitoring just for Ceph metrics, but quickly it became the de facto monitoring solution for the whole infrastructure and all applications because of its great flexibility and loads of integrations.”
— EDGARAS APŠEGA, IT SYSTEM ENGINEER AT ADFORM
While getting the metrics exposed was simple, gathering all of the scrape targets was not. “None of the available service discovery mechanisms covers all aspects that we have,” Daneliukas explains. “So we wrote a tool called prometheus-interceptor that goes around a variety of services and APIs and collects targets from all around, then pings the node/wmi exporter ports to ensure that they are alive, and adds the targets via file_sd. Sounds quite simple, but handling several tiers across several regions and different mediums—it sure ain’t that easy.”
Using Prometheus for Monitoring as a Service started as a proof of concept, but the teams using it loved it so much, that they’re continuing to develop it. “In the near future, we’re looking into moving all of MaaS to Kubernetes and writing more tools that would allow for an easy self-service to add alert rules, scrape targets, exporters, etc.,” says Daneliukas. Given the benefits they’ve gained from the open source cloud native community, they’re eager to give back. “If all goes well,” he adds, “we’re all for open sourcing what we can and contributing where we can.”