

Why we did this at all
For most of the last decade our metrics pipeline ran on gostatsd, the open-source StatsD implementation we maintain. It primarily did two jobs: as sidecar on every host and the aggregation tier at the other end. It took metrics from roughly 100k hosts across 14 regions at a 99.95% SLO and minimal latency and it was fine. Nobody thought about it much, which is usually the sign of good infrastructure.
Gostatsd served us for many, many years. However, the community continuously and consistently converged on OpenTelemetry over the past few years. It became the thing everyone standardized on and more and more of what fed our pipeline was emitting OTel data we simply didn’t support. Gostatsd was UDP-only, had no story for traces or logs and every clever thing the OTel Collector community shipped was one more thing we’d eventually rebuild by hand just to stay level. We will lose that race. It’s only a question of when.
So the why was easy. The how is what we discuss here. With observability wired into thousands of services and many different bespoke platforms, the obvious plan (tear out the old pipeline, get every team to re-instrument on the OTel SDK, flip the switch) is a pipe dream: a multi-year org-wide slog on a pipeline that can’t take an outage with a real chance of dropping the exact data alerts fire on.
The question we actually needed to answer was narrower. How do we replace the whole engine without huge impact across Atlassian services?
The bet: swap the collection and pipeline, leave the interface alone
A metrics pipeline is really a contract with two ends. One end is what service owners see: “send StatsD over UDP to this address → your metrics show up in the backend.” The other is everything between that packet and long-term storage. Teams care enormously about the first end and very little about that middle layer. So we kept the interface and rebuilt everything behind it, which turned an org-wide migration into a platform-team migration.
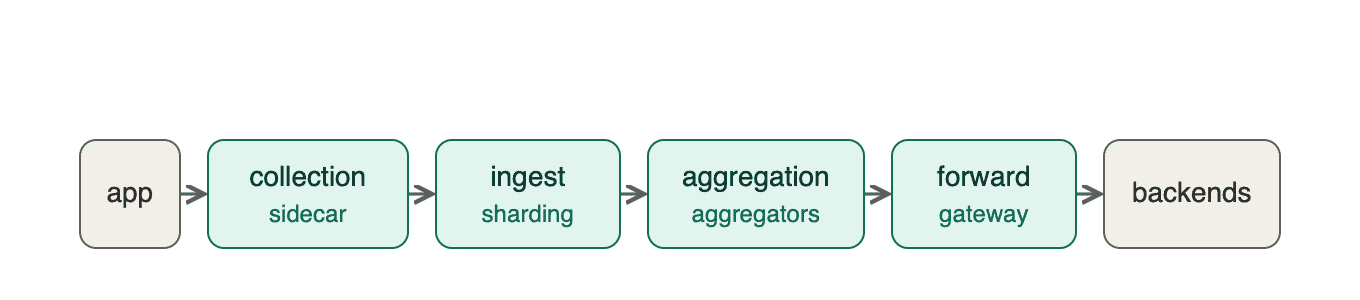
Two things followed. We put purpose-built OTel Collector distributions at each of the four stages (collection, ingest, aggregation, forward) so we could work on any one without touching the others. And we made the collection-side speak StatsD and OTLP at the same time: nobody had to swap StatsD clients for the OTel SDK before we could start. It helped that the OTel Collector wasn’t new within Atlassian: the tracing team had run it as their pipeline core and host-metrics sidecar for years, so “is it production-ready at our scale?” was already answered.
What we actually built
The migration went step by step in place.
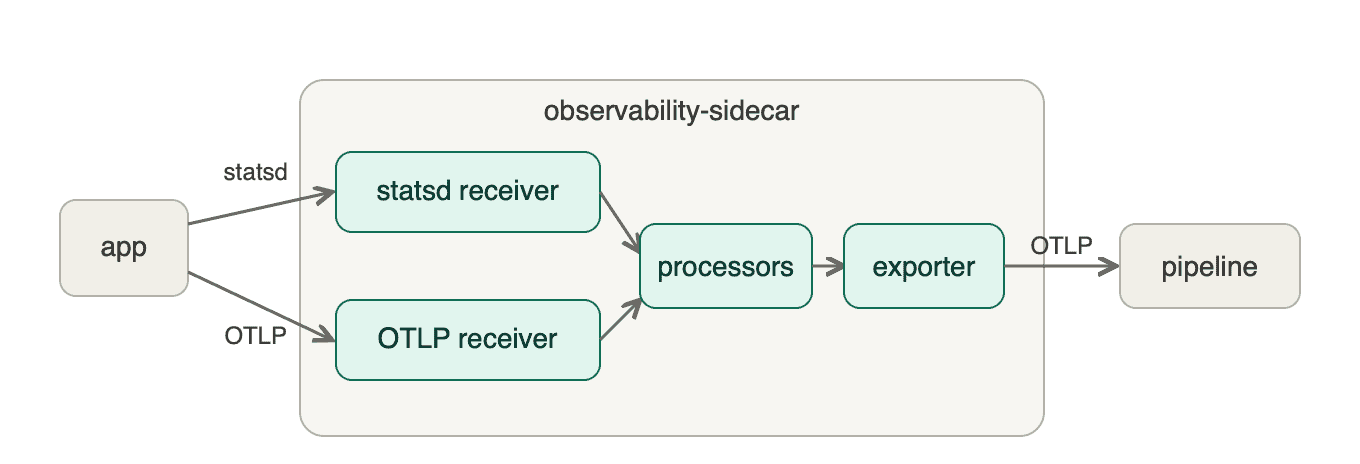
Collection. We replaced the gostatsd sidecar with our OTel Collector distribution, the same one the tracing team already shipped, keeping the app side identical: applications still fire StatsD over UDP as before. Day one, no team noticed. The payoff is that you stop running two sidecars (a StatsD one and a tracing one) on every host. Folding metrics into the tracing sidecar and killing the StatsD one saved about 3.9% CPU on average per service across our priciest Micros services, roughly a 30% cut in sidecar cost at fleet scale. At the same time, we enabled an OTLP receiver enabling our collection layer to receive and forward OTEL metrics natively.
Ingest. Aggregation is stateful: every datapoint for a time series has to hit the same aggregator, so you can’t just use traditional load-balancing strategies. For years an in-house proxy (called nomad) guaranteed that by hashing (service, environment) to a shard. But our service to metric load distribution is non-uniform and follows a long-tail, whichever shards owned the biggest services turned into hot shards. Our fix was a better routing strategy: the contrib loadbalancingexporter can hash by streamID (the identity of an individual time series) instead of by service, so one big service smears evenly across the pool while any given series still always lands on the same shard.
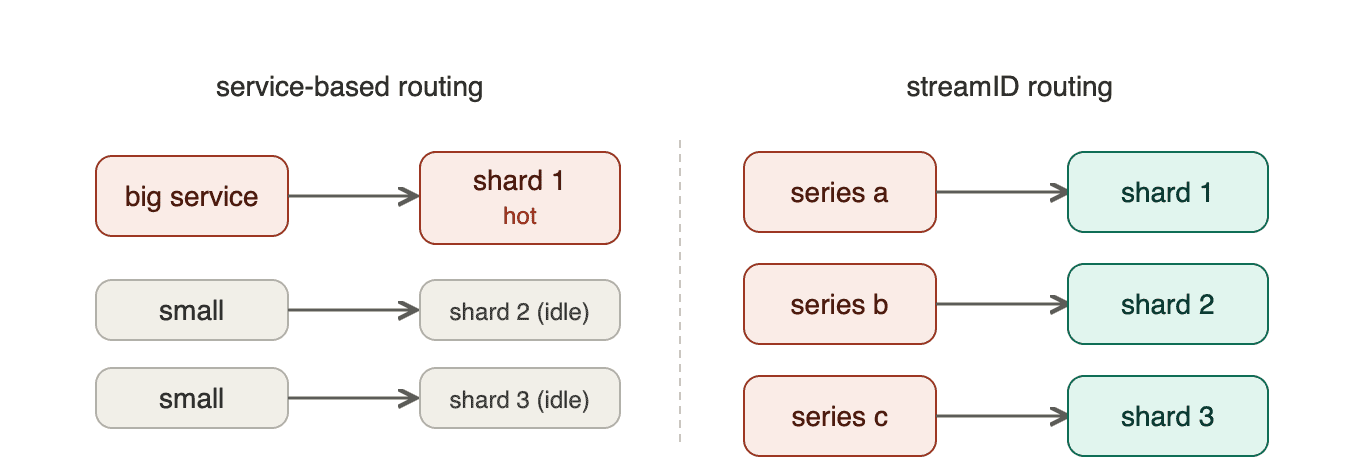
After this change: per-shard CPU went from a couple of tall bars and idle replicas to a flat, even distribution. Even load means a tighter autoscaling band, real off-peak scale-down and no more hot-shard pages!
Aggregation. This is the stage that makes the numbers affordable: we take in ~4.8 billion datapoints a minute and land ~220 million, roughly a 96% reduction. Most of our metrics are delta temporality and nothing upstream aggregated deltas the way our users expect, so we wrote our own delta aggregation processor and open-sourced it under atlassian-labs. Same traffic and the aggregation tier now runs on about half the CPU (the aggregators no longer parse gostatsd, load is even and we inherit the community’s tuning).
Forward. The last hop: a bespoke internal forwarder, became a stateless Collector distribution (metrics-gateway) built on upstream exporters. Fan-out to multiple backends (SignalFx, S3, etc) with no custom backend integrations; by default support for retries, queuing and backpressure from the community. Adding a destination is a config change, not a project. This was the easy one.
Lambda. Serverless can’t run a sidecar, so we built an OTel Lambda extension to replace the gostatsd one, with the same StatsD address, same env vars and no code changes. This completes the collection layer that forwards metrics from the services over to our pipeline.
Where this sits in the bigger picture
Getting every stage onto the OTel Collector gives us one codebase and one way of operating. Adding to the pipeline means writing a component, not standing up a service anymore. It unblocks OTEL-based instrumentation without us giving up the aggregation and cost controls that make our scale payable and it lets us drop wasteful datapoints at ingest, the cheapest place to do it. The end state is worth it on cost alone: the gostatsd aggregators and nomad together are ~38% of CPU requests in our metrics clusters and Nomad on its own is ~13% of total resources. Removing them is real money and the last thing between us and a pipeline that’s OpenTelemetry end to end.
What we tell ourselves before starting
- Pick the right early adopters. Find the teams who have the most to gain and will iterate with you. Leading with dev and staging workloads and the services that felt the pain most gave us real signal fast, from people who were forgiving while we found the rough edges.
- Profile continuously in production. The real cost and behaviour of a component, ours or upstream only showed up under production load. Small tests and benchmarks were not enough; continuous profiling in prod is what actually told us where to optimise.
- Match operational workflows. A migration this size runs for months even years and for most of that you’re operating the old and new systems side by side. Keep the overhead of running two systems as low as you can: carry the same operational primitives across and keep parity so nobody has to learn a second way of doing things.
- Progressive rollouts. Start in the lower environments and lead with the less critical services, then ramp 1% → 10% → 50% → 100%. You want to find problems where they’re cheap; not on the tier-0 path.
What’s next
We have now unblocked our users on moving metrics instrumentation over to OpenTelemetry. The next move is to shift left: get the instrumentation itself onto the OpenTelemetry SDK and off the vendor and in-house clients (Datadog/DogStatsD, StatsD libraries) we’ve carried for years.
We’re also going to start exploring further into the OpenTelemetry ecosystem to solve more large-scale Observability problems we have that the community has solved and also start contributing back as we grow OpenTelemetry with our usage and scale.