

It’s no secret that developers are increasingly being asked to shift left. It seems there’s always something new to shift left on. And now developers are being asked to shift left on observability. This means that in addition to all the other things developers must do, they must also take the extra step of instrumenting their application code with OpenTelemetry, to help make it observable.
This seems needless. It’s extra work. Why should developers care about observability? After all, isn’t observability the domain of SREs? Additionally, what’s the point of adding instrumentation to application code if it only seems to benefit SREs?
What’s in it for developers?
How does observability help developers?
If you’re being asked to instrument code, you may be thinking: how much extra time will this add to my workload? After all, application instrumentation involves adding traces, logs, and metrics to your code, making it more observable. This means more code to maintain, introducing complexity, bugs, and technical debt.
While that’s true, let’s look at how observability benefits developers.
1. It reduces debug time
Nobody loves spending hours and hours trying to chase down a nasty bug.
2. It accelerates development and deployment
Faster debugging means that developers can finish working on a feature faster and ship it faster.
3. It improves your code
Instrumenting code can expose slow paths, hidden retries, and weird edge cases which can be addressed before the code ever hits production.
4. It helps us understand distributed systems
Micro services are everywhere, and working with them means dealing with many moving parts, with often unpredictable behavior. Observability helps developers understand exactly what’s going on within and between services.
5. It helps us make sense of vibecoded applications
Like it or not, AI is being used for software development, and the quality of the code it produces varies (translation: some of it is utter crap). Making code observable helps untangle the web of not-so-great code.
Understanding how observability helps developers is the first step. Next comes instrumentation, the process of translating interesting things into telemetry signals.
Instrumentation pain points
Developers are lazy by nature, and that’s a good thing. That’s what drives them to automate things and come up with innovative solutions to gnarly problems. But with so many things on developers’ plates already, they simply don’t want to deal with the extra work and overhead of instrumenting application code.
We spoke with a few developers to get some of their thoughts on instrumentation, and they shared some of their pain points with us.
Pain point #1
“Dependent on the efforts of that specific SDK’s community”
Each language supported by OpenTelemetry has its own Special Interest Group (SIG) tied to the development of language-specific APIs and SDKs. Java folks work on Java APIs and SDKs. Python folks work on Python APIs and SDKs, and so on. Some SIGs have more contributors than others. Some individuals can dedicate more time to the project than others. Additionally, the amount of time taken to address an issue varies by SIG.
Pain point #2
“If there is no auto-instrumentation, developers have a hard time manually instrumenting”
OpenTelemetry offers zero-code (auto) instrumentation for some languages. Languages like Rust and Elixir, on the other hand, don’t have zero-code instrumentation support, making it more daunting for instrumenting, as developers have to start from scratch. We’ll talk more about zero-code instrumentation later.
Pain point #3
“Too many options in instrumenting: SDKs, eBPF, compile-time. Also these projects are not mature enough.”
The OpenTelemetry ecosystem is very large and has many moving parts. Also, not all parts move at the same rate. This makes it challenging for developers to keep up.
Pain point #4
“Public API stability, upgrading project dependency is painful, instrumentation is too verbose, metrics cardinality is a big problem for the high cardinality attributes”
OpenTelemetry has definitely experienced some growing pains over the years. There are challenges around project dependencies, and getting started with instrumentation from scratch.
There’s good news!
But it’s not all doom and gloom. Challenges aside, OpenTelemetry has two major strengths. The first is its flexibility. OpenTelemetry is highly customizable and extensible, helping to make it future proof.
OpenTelemetry’s second strength is its community. It has the backing of most major observability vendors, including our respective employers. There are folks working on OpenTelemetry day in and day out, gathering feedback from end users, actively improving the project. In fact, there are dedicated OpenTelemetry Developer Experience and OpenTelemetry Contributor Experience groups to help make OpenTelemetry more ergonomic.
Making OpenTelemetry instrumentation work for you
If OpenTelemetry and observability are new to you, it can be really overwhelming to start instrumenting application code with OpenTelemetry. Below are some of the things that developers can start doing right now to instrument application code with OpenTelemetry, without feeling overwhelmed.
Instrumentation Tips
Let’s start with some good practices for instrumenting application code.
1- Start with zero-code instrumentation
Zero-code instrumentation adds instrumentation to application code without requiring developers to touch their source code. It uses shims or bytecode instrumentation agents to intercept code at runtime or compile-time to add instrumentation to common third-party libraries and frameworks called by the application code. At the time of this writing, zero-code instrumentation is available for Java, .NET, Python, JavaScript, PHP, and Go.
While zero-code instrumentation isn’t perfect and still requires code-based (manual) instrumentation to fill in the gaps, it’s a great way to get things started, especially when you don’t know where or how to start.
2- Supplement with manual instrumentation to fill in the gaps
Zero-code instrumentation is a great starting point if it’s available for your language. However, it’s not enough. Zero-code instrumentation doesn’t include what’s important for your application. This is where code-based (manual) instrumentation helps fill in the gaps. Code-based instrumentation requires that the developer add traces, metrics, logs, context propagation, attributes, and so on, to their own code.
3- Practice observability driven development
Observability-driven development (ODD) is the practice of instrumenting as you write new application code.
By instrumenting your code while it’s still top of mind, it’s easier to identify what actually needs to be instrumented. As a developer, this is key, because going back to your code to instrument a day or a week later, things might not be as fresh in your mind.
4- Don’t be afraid to use AI to help with instrumentation!
AI is a game changer and can be a real time-saver to help with instrumenting code…if used correctly. More on that shortly.
What to instrument
Once you’re ready to instrument code, what exactly should you instrument? It starts with traces.
1- Add spans to meaningful units of work
What happened when going from point A to point B? Traces help with that, by telling the story of a request. A trace is made up of spans, which represent units of work. As you start to instrument your application, it can be tempting to add spans to every single little method call. Unfortunately, you might end up with too much noise, and end up missing the important parts. Instead, focus on meaningful units of work. These can include:
- Inbound requests, such as HTTP calls
- Outbound calls to DB caches, APIs, messaging queues
- Business critical operations
2- Capture significant events in logs
While traces tell the overall story of what is happening within and across services, logs help us understand specific things that happened at a specific point in time, providing additional context to help developers understand what is happening in their application.
Keeping that in mind, developers should add logs to explain why something happened. This includes capturing:
- Errors
- Validation failures
- Retries and fallback paths
- Security-related events, such as authentication failures and permission denials
3- Capture latency metrics
Writing performant code is important for developers. In an age where end users expect responsive applications and are happy to abandon non-performant applications and web sites in the blink of an eye, this is especially important. If you’re writing a shopping cart feature, for example, you want the response time for each step in the “add to shopping cart and checkout” experience to take milliseconds, not seconds. This is why capturing latency metrics is important, as it can help pinpoint why a particular request is taking longer than usual.
4- Instrument home-grown frameworks and libraries
Chances are that most of your code will touch these, so you’ll get pretty good coverage overall.
5- DON’T PANIC
One of our favourite things about the OpenTelemetry project is that there is a huge community of practice at your disposal. This takes on the form of official documentation, the OpenTelemetry YouTube channel, vendor blog posts, personal blog posts, and newsletters. There is also a vibrant and thriving OpenTelemetry community on CNCF Slack…and the folks are friendly and willing to help!
AI-assisted instrumentation
As we said earlier, AI can and should be leveraged to help us instrument our code.
Adriana worked as a Java developer for 16 years and started her development career in 2001, long before the days of AI assistants. An AI coding assistant would’ve definitely been a nice-to-have all those years ago!
Diana, on the other hand, comes from an SRE background. She found that experimenting with different SDKs was essential for truly understanding how instrumentation works under the hood. Many language APIs/SDKs are still evolving and are at different levels of maturity in terms of OpenTelemetry feature support. As part of her OpenTelemetry instrumentation learning journey, AI-assisted instrumentation proved especially helpful in speeding up exploration and reducing friction. You can find more details and examples of what she tried in her GitHub repository.
As you can see from our two different perspectives, having AI to help you instrument your code is a game-changer, and can certainly help make the whole instrumentation journey a lot less stressful, whether you’re practicing ODD and/or if you’re instrumenting legacy code. That is…if it’s done properly.
Here are some of the things that developers can keep in mind when using AI coding assistants to help instrument application code with OpenTelemetry.
1- Be specific
Be sure to include as much context as possible. These include:
- Role: You (coding assistant) are a Java software developer
- Objective: I have already added some zero-code OpenTelemetry instrumentation. Add some supplementary manual instrumentation to this code
- Inputs: Code is in X folder. Code is instrumented in Y language. Include links to relevant documentation and/or code examples
- Outputs: Manual OpenTelemetry instrumentation (traces, logs, metrics) in X language
2- Challenge your AI agent
- Ask it to explain its decisions and reasoning.
- Create an LLM-as-judge agent to challenge the decisions made by the instrumentation agent.
- If possible, use a different model for the “judge” agent
3- Iterate
Coding has always been an iterative process, and coding with AI is no different. Don’t be afraid to try different things. Refine the things that worked, and discard the things that didn’t work.
Observability tools for developers
Having a clear path for instrumenting applications is only part of the story. It’s also important to have observability tooling to help developers interpret telemetry data.
OpenTelemetry Collector for Developers
It starts with the OpenTelemetry Collector. The OpenTelemetry Collector is a vendor neutral agent used to ingest OpenTelemetry signals (traces, logs, metrics) from multiple sources, process the data (if/as needed), and export the data to one or more destinations.
If you’re a developer, you may be wondering why you would want to set up your own Collector instance. After all, isn’t this something that the platform engineering team can set up for you through some self-service tooling? While that is absolutely true, we strongly feel that it is important for developers to know how the OpenTelemetry Collector works at a high level, and how to configure it, because it is such a key component of the OpenTelemetry ecosystem. Plus, as the old adage goes, knowledge is power.
The Collector is made up of the following components:
- Receivers to ingest application and infrastructure telemetry.
- Processors can do things like add/remove attributes, mask data, and sample data.
- Exporters can send your telemetry data to one or more destinations simultaneously
Pipelines define how data flows in the Collector, by connecting receivers, processors, and exporters together. Traces, logs, and metrics each require their own pipeline. While it is possible to have multiple traces, logs, and metrics pipelines, for development purposes, you need one of each.
Additionally, the Collector has connectors, which “link” two pipelines, acting as a receiver in one pipeline and an exporter in another.
Collector configurations can get really fancy for non-development scenarios. For development purposes, however, we care about:
- Ingesting application telemetry
- Exporting application telemetry
We don’t need any processors. We do, however, want a connector. More on that shortly.
Below is a simple, developer-friendly Collector configuration:
receivers:
  otlp:
    protocols:
      grpc:
        endpoint: 0.0.0.0:4317
      http:
        endpoint: 0.0.0.0:4318

exporters:
  debug:
    verbosity: detailed

connectors:
  spanmetrics:

service:
  pipelines:
    traces:
      receivers: [otlp]
      exporters: [debug, spanmetrics]

    metrics:
      receivers: [otlp, spanmetrics]
      exporters: [debug]

    logs:
      receivers: [otlp]
      exporters: [debug]
Important components:
- OTLP Receiver: Ingests application telemetry data using either gRPC or HTTP
- Debug Exporter: Exports telemetry data to the Collector’s console (stdout).
- SpanMetrics Connector: The SpanMetrics Connector serves as an exporter in a traces pipeline, calculating the duration of an OpenTelemetry span. It can send that span duration as a receiver in a metrics pipeline. This helps developers identify latency issues if a span suddenly seems to take longer than usual to complete.
- Pipelines: There’s a separate pipeline for traces, logs, and metrics.
The problem with sending telemetry to the Collector via the debug exporter is that you get a text output like this:
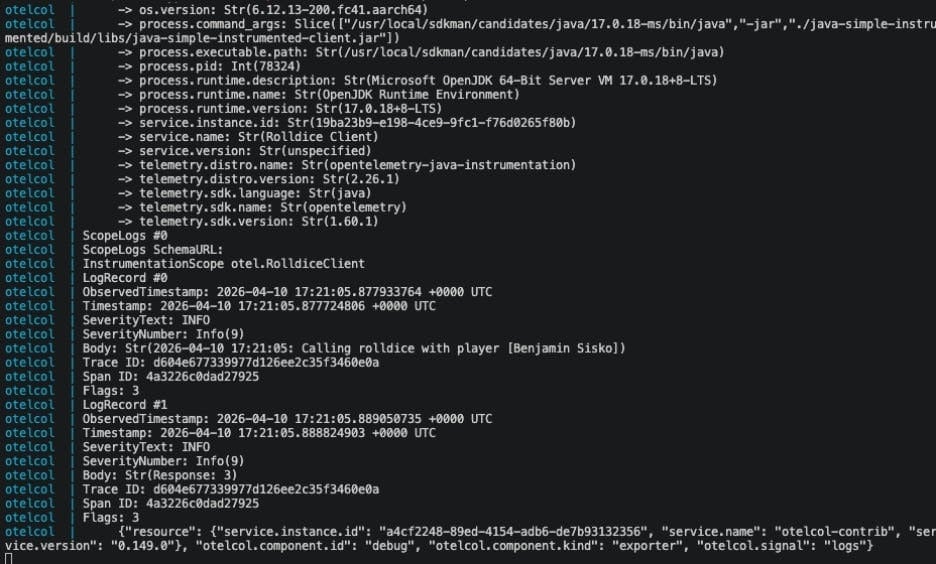
This type of text-based output makes troubleshooting challenging, especially if you’re used to having some nice IDE extensions to help with troubleshooting. Wouldn’t it be nice to have a local tool for visualizing OpenTelemetry signals?
Fortunately, we found three such tools, all of which are open source, which we’ll explore below:
Before we dive into each tool, you can check out this quick comparison matrix to get a feel for what they do:
| Tool Name | Signal Support | Features |
| OTel Desktop Viewer | Traces only | Traces only Web UI |
| otel-tui | Traces, logs, metrics | Traces, logs, metrics Service map Text-based UI |
| OTel Front | Traces, logs, metrics | Traces, logs, metrics Overview page (not clickable) Web UI |
If you’re interested in exploring these tools in greater detail for yourself, you can check out our GitHub repository using a simple Java client/server application (with a few more things added) to emit telemetry.
Since the OpenTelemetry Collector and the three desktop OpenTelemetry visualization tools we explored can all be run using Docker, we used Docker Compose to manage and configure these tools.
Below is a consolidated Docker Compose for all 3 tools:
services:
  otel-collector:
    image: otel/opentelemetry-collector-contrib:0.149.0
    container_name: otelcol
    ports:
      - "4317:4317"
      - "4318:4318"
    volumes:
      - ./otel-collector/otelcol-config.yaml:/etc/otelcol-config.yaml
    command: ["--config=/etc/otelcol-config.yaml"]
    networks:
      - otel-network

  otel-desktop-viewer:
    image: ghcr.io/ctrlspice/otel-desktop-viewer:v0.2.5-arm64
    container_name: otel-desktop-viewer
    ports:
      - "8000:8000"
      - "4418:4318"
    networks:
      - otel-network

  otel-tui:
    image: ymtdzzz/otel-tui:latest
    container_name: otel-tui
    stdin_open: true
    tty: true
    entrypoint: ["/otel-tui"]
    ports:
      - "4518:4318"
    networks:
      - otel-network

  otel-front:
    image: ghcr.io/mesaglio/otel-front:latest
    container_name: otel-front
    ports:
      - "8001:8000"
      - "4618:4318"
      - "4617:4317"
    networks:
      - otel-network

networks:
  otel-network:
    driver: bridge
And the corresponding OTel Collector config.yaml:
receivers:
  otlp:
    protocols:
      grpc:
        endpoint: 0.0.0.0:4317
      http:
        endpoint: 0.0.0.0:4318

exporters:
  debug:
    verbosity: detailed
  otlphttp/otel-desktop-viewer:
    endpoint: http://otel-desktop-viewer:4318
  otlphttp/otel-tui:
    endpoint: http://otel-tui:4318
  otlp/otel-front:
    endpoint: http://otel-front:4317
    tls:
      insecure: true
    compression: none


connectors:
  spanmetrics:

service:
  pipelines:
    traces:
      receivers: [otlp]
      exporters: [debug, spanmetrics, otlphttp/otel-desktop-viewer, otlphttp/otel-tui, otlp/otel-front]

    metrics:
      receivers: [otlp, spanmetrics]
      exporters: [debug, otlphttp/otel-tui, otlp/otel-front]

    logs:
      receivers: [otlp]
      exporters: [debug, otlphttp/otel-tui, otlp/otel-front]
OTel Desktop Viewer
The OTel Desktop Viewer is a desktop tool for viewing OpenTelemetry traces. The project started in October 2022.
Below is the docker-compose.yaml snippet to run the OTel Desktop Viewer:
services:
  otel-desktop-viewer:
    image: ghcr.io/ctrlspice/otel-desktop-viewer:v0.2.5-arm64
    container_name: otel-desktop-viewer
    ports:
      - "8000:8000"
Notes:
- The OTel Desktop Viewer runs on port
8000, and can be accessed viahttp://localhost:8000. - The OTel Desktop Viewer receives telemetry data on container port
4318. - If you’re running the OTel Desktop Viewer on an AMD64 machine, change
otel-desktop-viewer.imageversion tov0.2.5-amd64.
Next, add an OTLP HTTP exporter for the OTel Desktop Viewer to your Collector config.yaml, where otel-desktop-viewer is the name of the OTel Desktop Viewer’s docker container, per the code snippet below.
Next, add an OTLP HTTP exporter for the OTel Desktop Viewer to your Collector config.yaml, where otel-desktop-viewer is the name of the OTel Desktop Viewer’s docker container, per the code snippet below.
exporters:
  otlphttp/otel-desktop-viewer:
    endpoint: http://otel-desktop-viewer:4318

service:
  pipelines:
    traces:
      receivers: [otlp]
      exporters: [debug, spanmetrics, otlphttp/otel-desktop-viewer]
Notes:
otphttp/otel-desktop-viewerwas only added to the traces pipeline. This is because this tool only works for traces. If you try to add it to the metrics or logs pipeline, it will fail to start.
Below is a sample trace output from OTel Desktop Viewer:
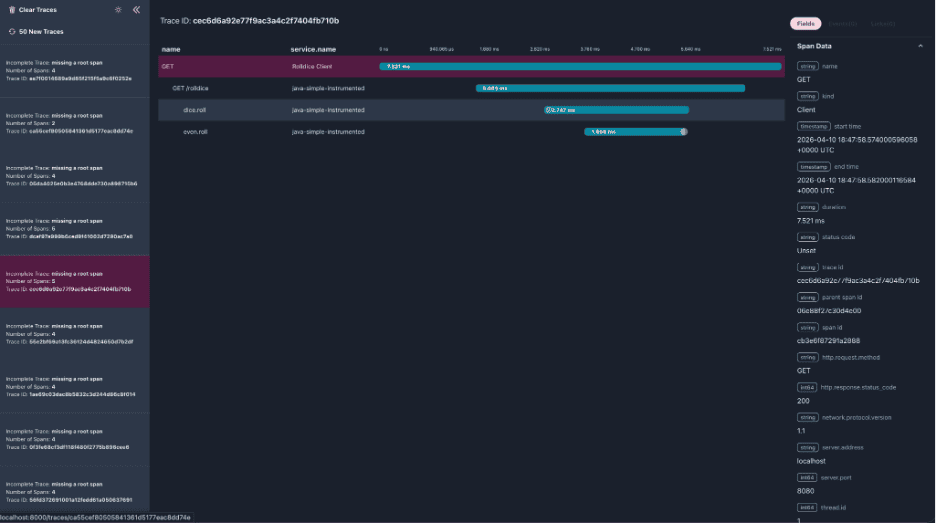
Clicking on a span reveals various span attributes and span events (if applicable).
otel-tui
otel-tui is a terminal OpenTelemetry viewer inspired by OTel Desktop Viewer. The project started in March 2024.
Below is the docker-compose.yaml snippet to run otel-tui:
services:
  otel-tui:
    image: ymtdzzz/otel-tui:latest
    container_name: otel-tui
    stdin_open: true
    tty: true
    entrypoint: ["/otel-tui"]
    ports:
      - "4518:4318"
    networks:
      - otel-network
Notes:
- To run otel-tui, you must execute the following commands:
docker compose up otel-tui -d (run as a daemon process)
docker compose attach otel-tui (start the tool)- otel-tui receives telemetry data on container port
4318.
Next, add an OTLP HTTP exporter for otel-tui to your Collector config.yaml, where otel-tui is the name of the otel-tui’s docker container, per the snippet below.
exporters:
  otlphttp/otel-tui:
    endpoint: http://otel-tui:4318

service:
  pipelines:
    traces:
      receivers: [otlp]
      exporters: [debug, spanmetrics, otlphttp/otel-tui]

    metrics:
      receivers: [otlp, spanmetrics]
      exporters: [debug, otlphttp/otel-tui]

    logs:
      receivers: [otlp]
      exporters: [debug, otlphttp/otel-tui]
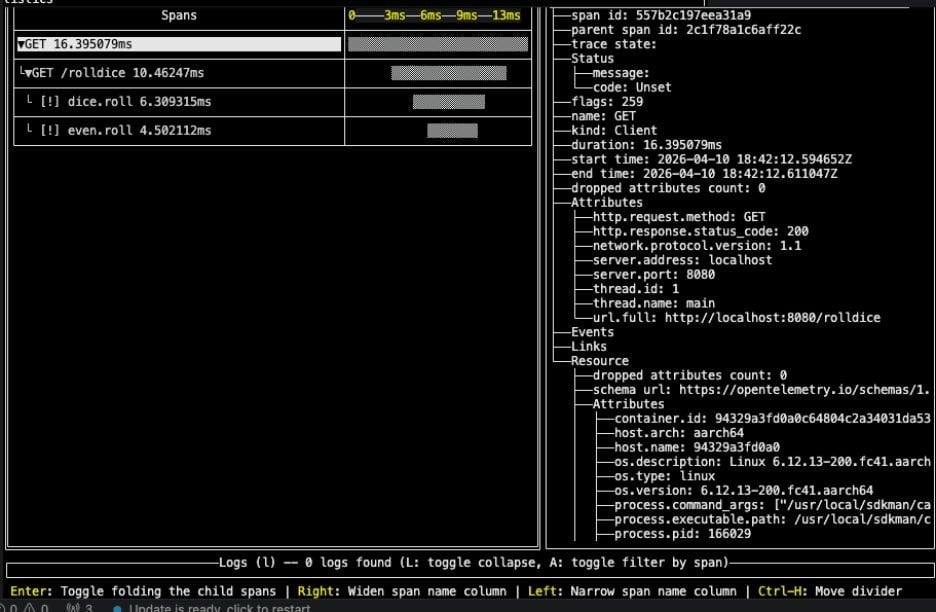
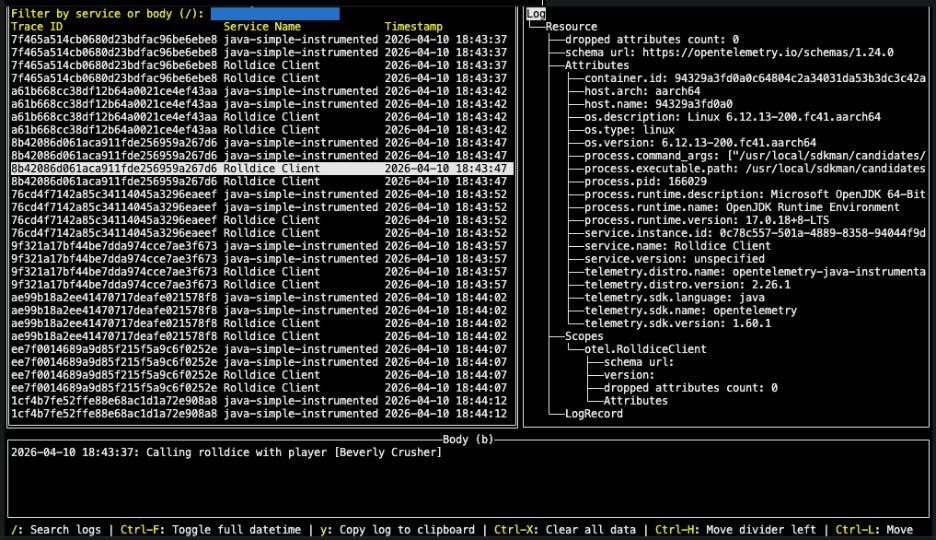
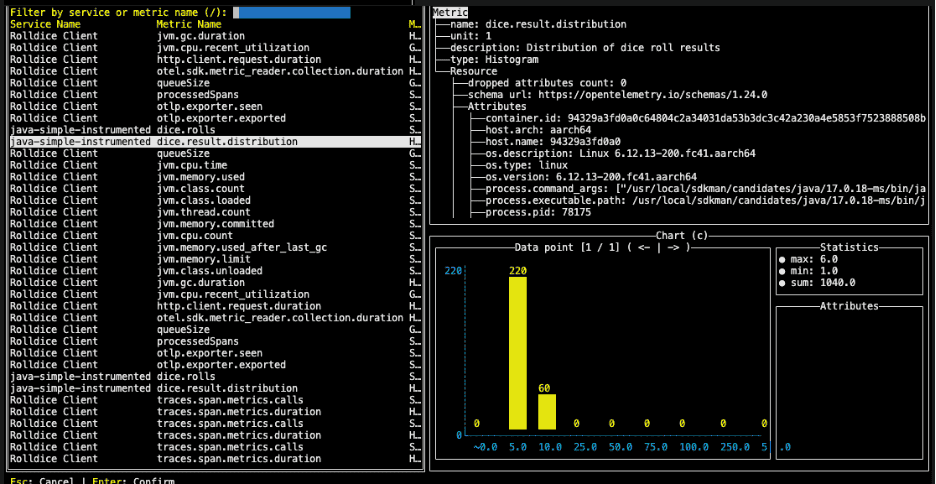
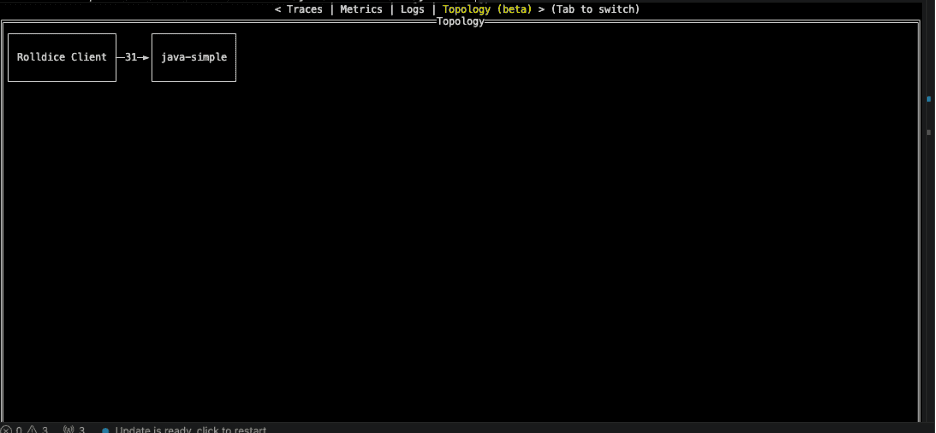
Unlike the OTel Desktop Viewer, otel-tui supports traces, logs, and metrics. It also has a Topology view, which shows the relationship between OpenTelemetry services. The UI looks like a graphical command-line tool and relies on the keyboard for navigation.
Navigation:
- Use tab to navigate between traces, logs, and metrics views
- Use up and down arrow keys within each view to look at specific telemetry
- Use d to view details about a trace, log, or metric, in the respective view.
Traces view:
Logs view:
Metrics view:
Topology view:
OTel Front
OTel Front is a desktop tool for viewing OpenTelemetry traces, logs, and metrics. The project started in November 2025.
Below is the docker-compose.yaml snippet to run OTel Front:
services:
  otel-front:
    image: ghcr.io/mesaglio/otel-front:latest
    container_name: otel-front
    ports:
      - "8001:8000"
      - "4618:4318"
      - "4617:4317"
    networks:
      - otel-network
Notes:
- OTel Front runs on container port
8000, and is mapped to host port8001, to avoid port conflicts if the OTel Desktop Viewer was running at the same time. It can be accessed viahttp://localhost:8001. - OTel Front uses container ports and
4317(HTTP)4318(gRPC) to receive telemetry data.
Next, add an OTLP gRPC exporter for OTel Front to your Collector config.yaml, where otel-front is the name of the OTel Desktop Viewer’s docker container per the snippet below.
exporters:
  otlp/otel-front:
    endpoint: http://otel-front:4317
    tls:
      insecure: true
    compression: none

service:
  pipelines:
    traces:
      receivers: [otlp]
      exporters: [debug, spanmetrics, otlp/otel-front]

    metrics:
      receivers: [otlp, spanmetrics]
      exporters: [debug, otlp/otel-front]

    logs:
      receivers: [otlp]
      exporters: [debug, otlp/otel-front]
Notes:
- According to the project’s README, OTel Front should accept telemetry data using both gRPC and HTTP; however, we were only able to get it working using gRPC, hence the use of the OTLP gRPC exporter.
- Unlike the OTel Desktop Viewer, OTel Front supports traces, logs, and metrics.
Below is the trace view. It shows related logs, span events, and span attributes.:
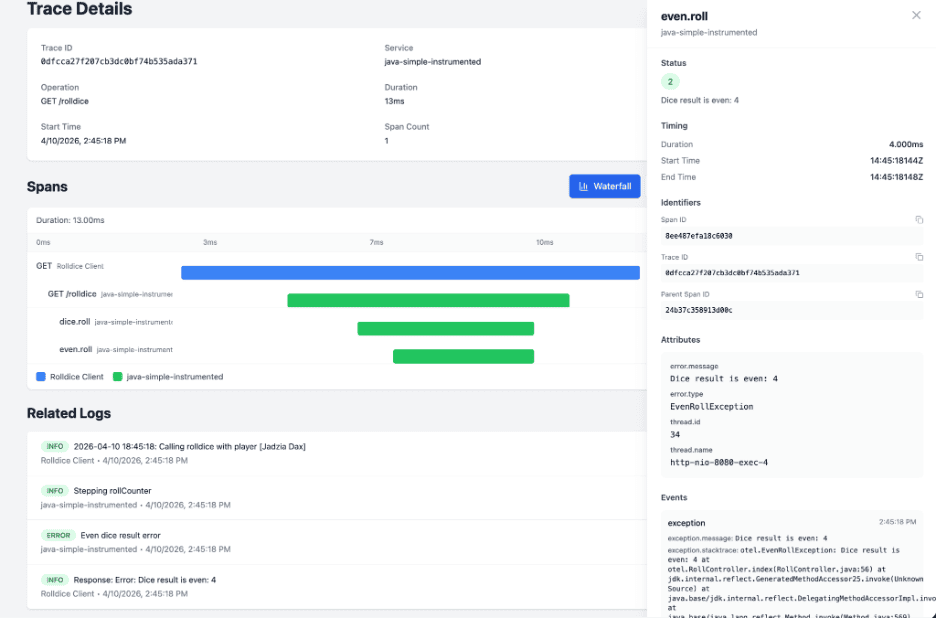
Below is the logs view:
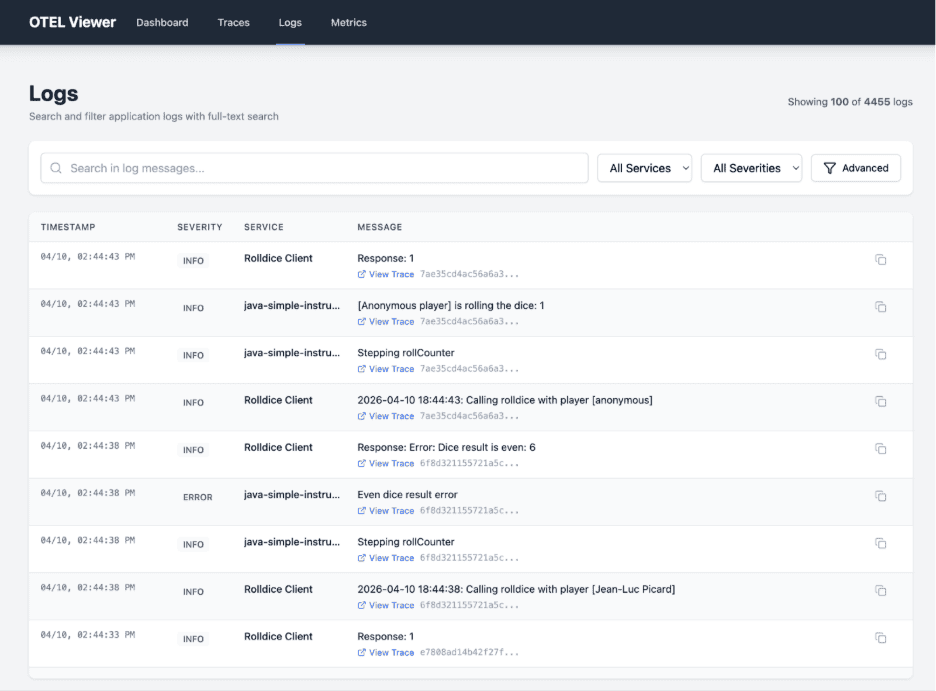
Below is the metrics view:
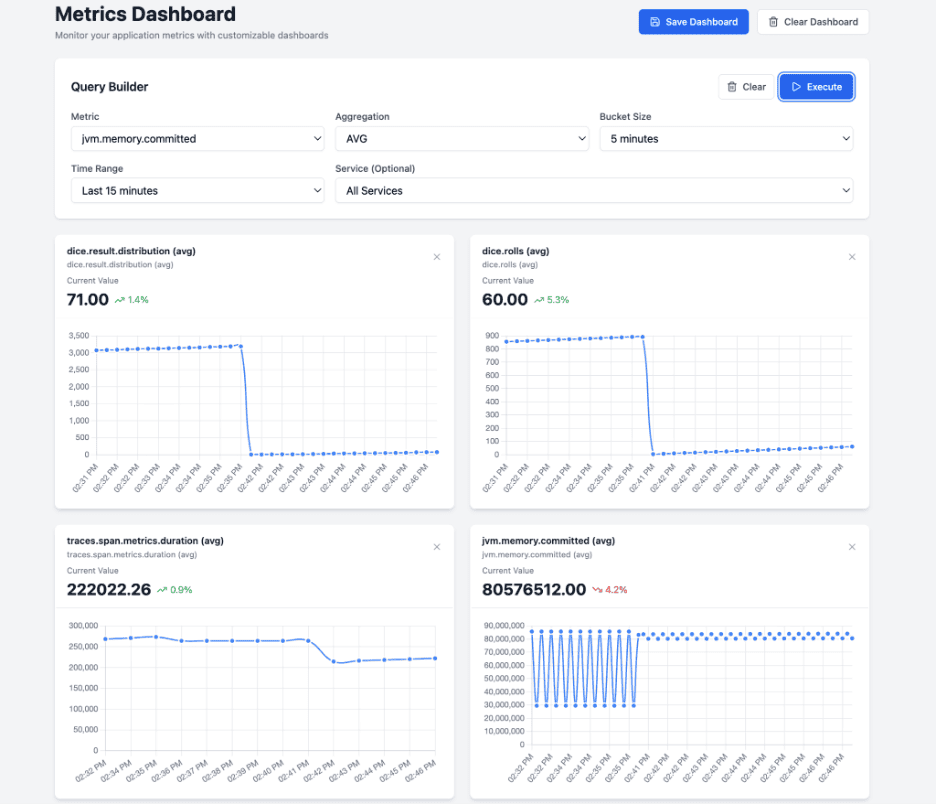
It also has a dashboard view:
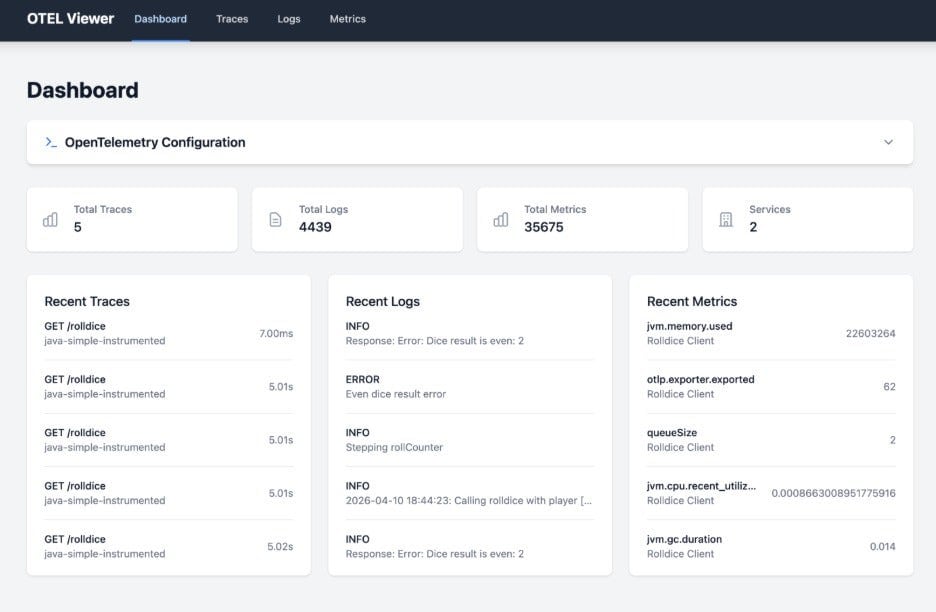
Unfortunately, the dashboard is not clickable, meaning that you can’t click on, say, a recent trace to take you to the traces view.
Challenges with OpenTelemetry tooling for developers
We think it’s really great that there are so many options out there in terms of OpenTelemetry desktop tooling, especially since they’re open source. We did, however, run into a few challenges when working with these tools:
Ease of use and setup: These tools were a bit challenging to set up. Since we already had experience with the OpenTelemetry Collector and Docker, we were able to get past these challenges quickly. If you’re not as well-versed in these, it may be trickier for you…though our GitHub repository should help!
Third party tools: Since these are third-party open source tools, you have to rely on someone else to maintain the tool. Or, if you feel bold enough, make contributions yourself, by adding new features or fixing bugs if you want these issues resolved in a timely manner.
OpenTelemetry feature parity: These tools are also not necessarily up-to-date with the latest versions of the OpenTelemetry API and SDK, so they may not quite work as expected.
That being said, the fact that these tools exist and are still being worked on means that there is a need and demand for them. Even JetBrains has entered the game, with the JetBrains OTel Plugin for Rider. Unfortunately, Rider is a .NET IDE, so unless you’re a .NET developer, you won’t be able to use it.
If the desktop tools don’t appeal to you, you can always use the open source observability tools used by the OpenTelemetry Demo App. The problem is that the demo app uses different tools for traces, logs, and metrics, and setting up these tools and getting the right Collector setup may take a while. (Though you can use the OpenTelemetry Demo App repository on GitHub as your guide) The good news is that once it’s set up, you won’t have to do it again.
Another option is to go the SaaS vendor route. If your company is already using OpenTelemetry in production, chances are that it may already have a license for one of the many OpenTelemetry compatible vendors, which means that you can ask your manager for a license. The challenge with going this route is:
- Depending on the licensing agreement, you may not get one
- Large vendor tools have a larger learning curve
That being said, you have options.
Final thoughts
There’s no doubt in our minds that developers should instrument their applications with OpenTelemetry to troubleshoot their own code. As we said before, instrumentation with OpenTelemetry:
- Reduces debug time
- Accelerates development and deployment
- Improves code quality
- Helps us understand distributed systems
- Helps us make sense of vibecoded applications
But most of all, it’s because it has always mattered. When you think about it, developers have been doing observability for a while, using logs, stack traces, and profiling tools. We just didn’t call it that.