


A Service Mesh like Istio, together with Kiali gives you a lot on day one.
You install the mesh, point Prometheus at it, and suddenly you have request rate, latency, error rate, and a fairly good picture of service-to-service traffic. You get this visibility into the applications without touching their code, which is often enough to answer the first round of questions during an incident.
Since you also heard that OpenTelemetry is the new standard and zero-code instrumentation will avoid the burden of polluting all your code, you go all-in for it.
This happy-path is covered by every tutorial and, sure, it works. The bit that actually comes for your weekend is not being able to connect the dots. When you open your tracing UI, you can see how your traces fall apart and the spans that should be together don’t seem to be part of the same transaction. Your traces are broken now.
And this is frustrating because you were trying to put together several pieces that work great on their own. After grinding the CNCF ecosystem by installing Istio, Prometheus, logs, instrumentation in the applications and third parties, you still ended up without having a coherent picture. The request is there, the spans are there but… something doesn’t add up because, in distributed systems, every request has its own story and it is actually quite sad that, after all this effort, the point is missed.
But let’s not lose faith (yet). Actually, now is when real OpenTelemetry comes to help. Throughout the following lines, we will show how, with a few tweaks, OpenTelemetry provides a clean way to connect all the pieces: application instrumentation, context propagation, and, most importantly, a Collector that can ingest telemetry from both the application and the mesh in different formats.
To illustrate this problem (and how to solve it), let’s imagine the following setup:
- An instrumented application like the OpenTelemetry Demo, which also includes the OpenTelemetry Collector, and Jaeger. Traces in this setup work beautifully.
- On top of this setup, a Service Mesh is installed covering networking and its observability via Istio and Kiali. In this case Metrics and logs will still be useful, but traces are broken.
In this post, we will help readers to fix this integration problem by making the mesh and the applications automatic instrumentation contribute to the same trace.
Spoiler alert: The interesting part is not that traces break. The interesting part is why they break, and how OpenTelemetry gives you a practical, standardized fix.
What Istio already gives you
Istio is very good at producing useful telemetry with almost no application changes. Once sidecars are injected, you get:
- Request volume between services
- Latency and error rate per workload
- Topology views in Kiali
- Access logs from the proxies
For platform teams, this is valuable immediately. At zero cost. You can see whether traffic is flowing, where errors are concentrated, and whether one hop in the request path is adding latency.
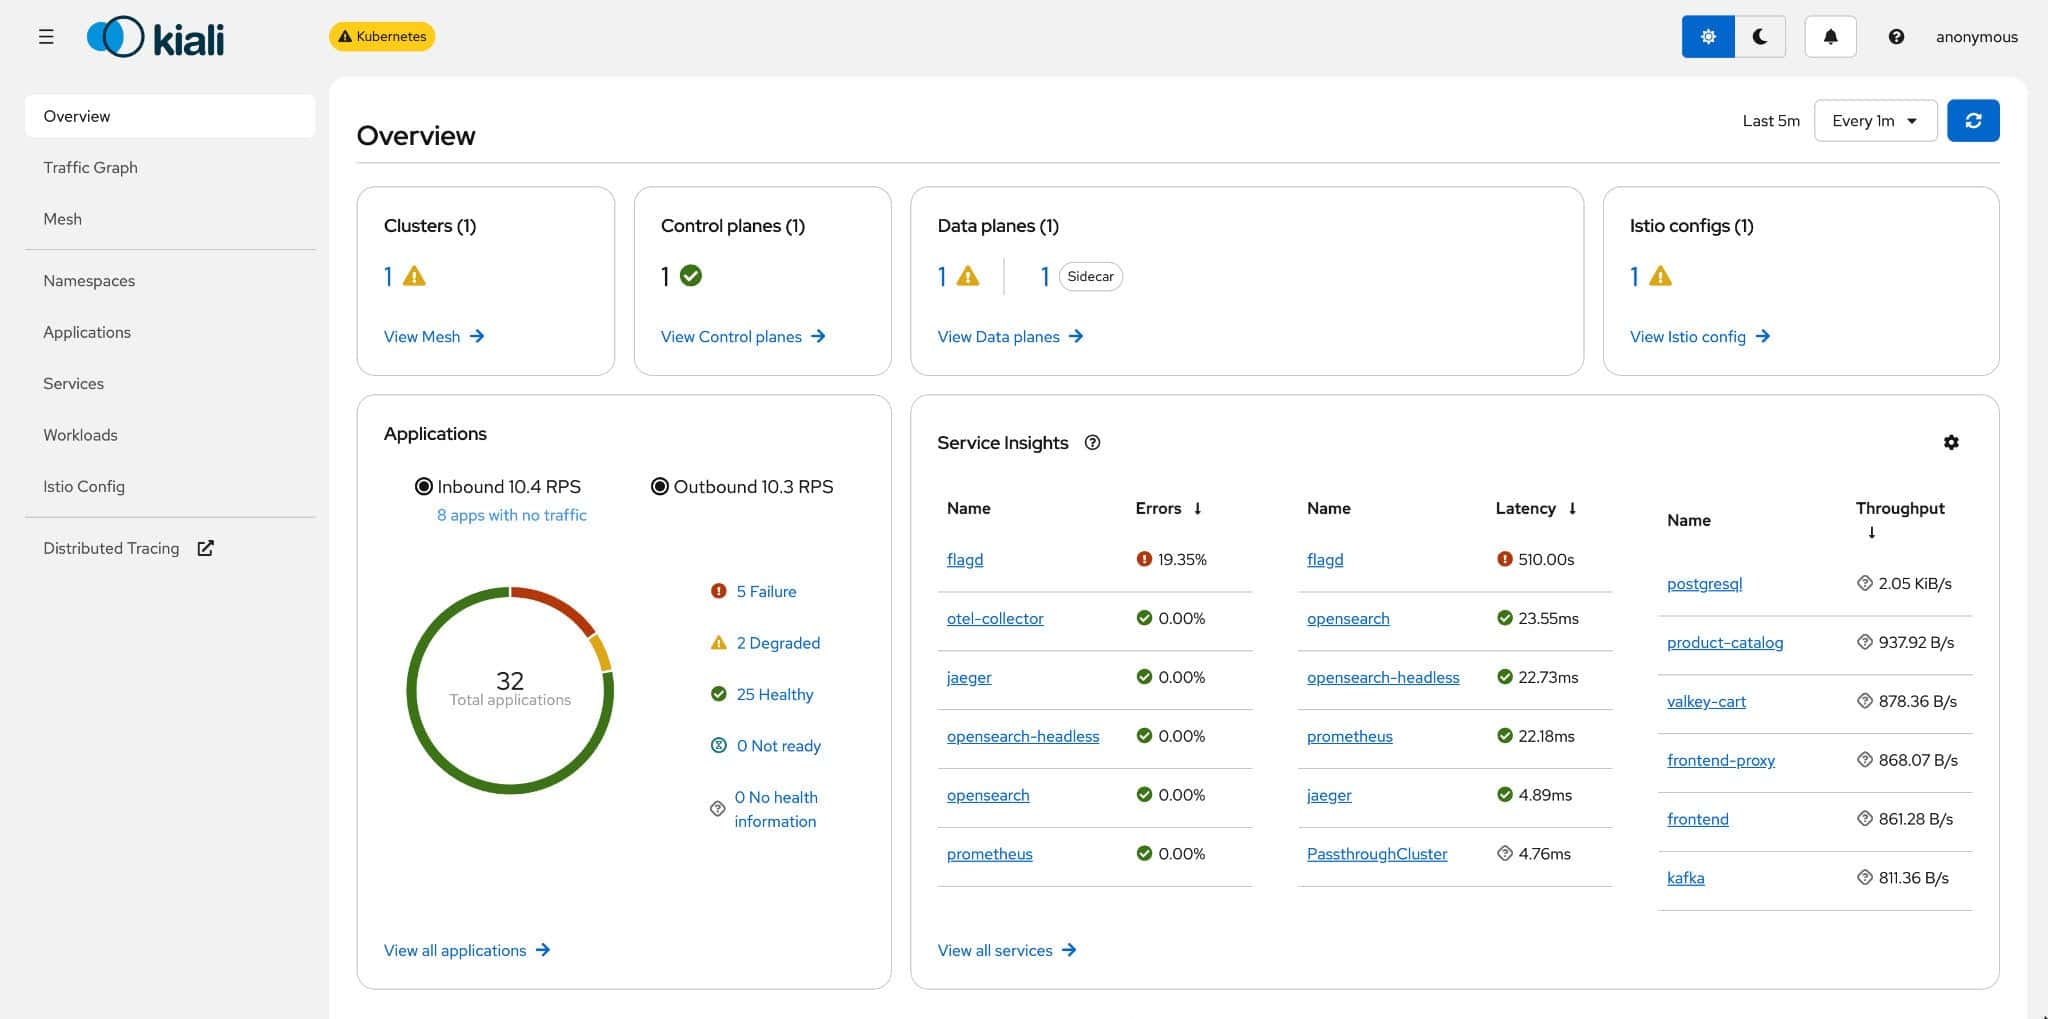
If your job is to operate the mesh, that is a pretty solid starting point.
But there is still a gap between “the network looks unhealthy” and “this exact user request failed because checkout called product-catalog twice and retried after a timeout”. That gap is usually closed by tracing. And tracing is where the integration details matter.
The problem is not missing telemetry. It is fragmented telemetry
In the demo, the OpenTelemetry applications are already instrumented. Before Istio is installed, Jaeger shows complete end-to-end traces across the demo services.
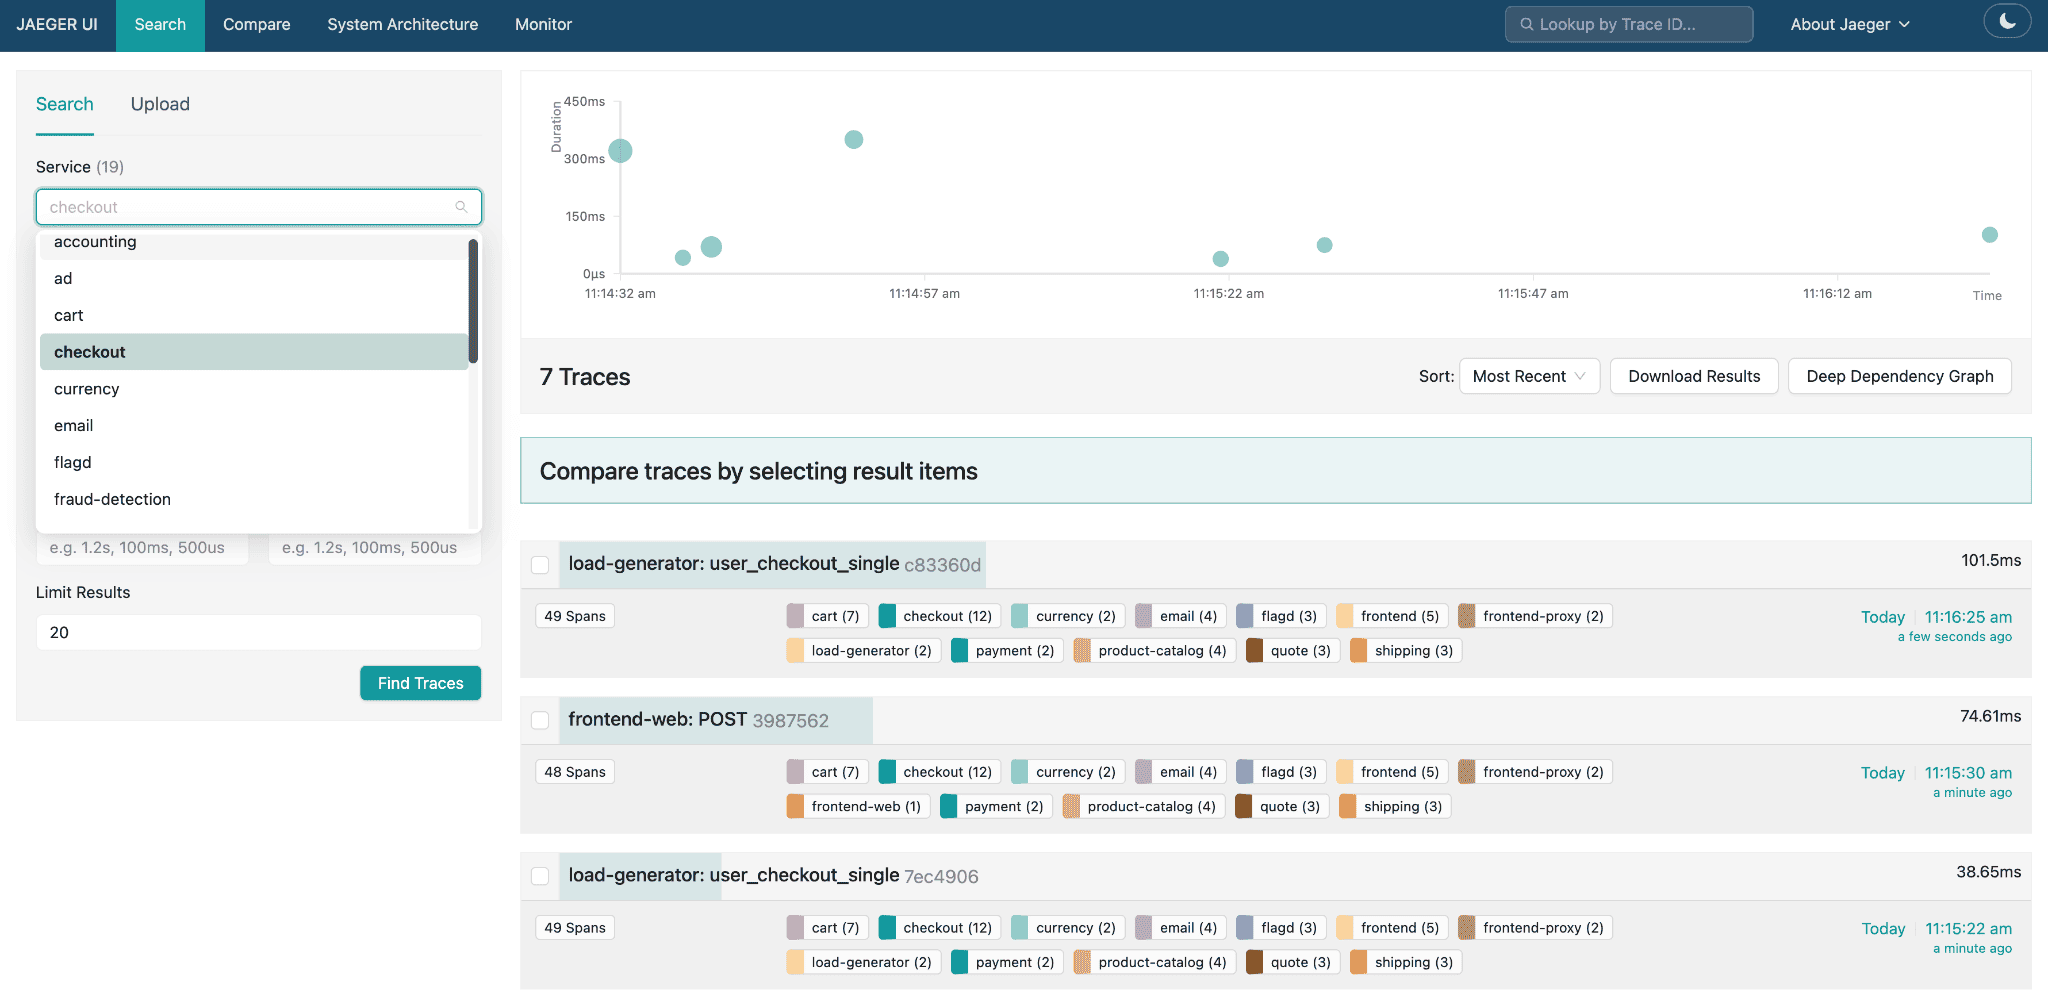
By the time Istio sidecars are added and Envoy tracing is enabled, you still have telemetry, but it is no longer unified.
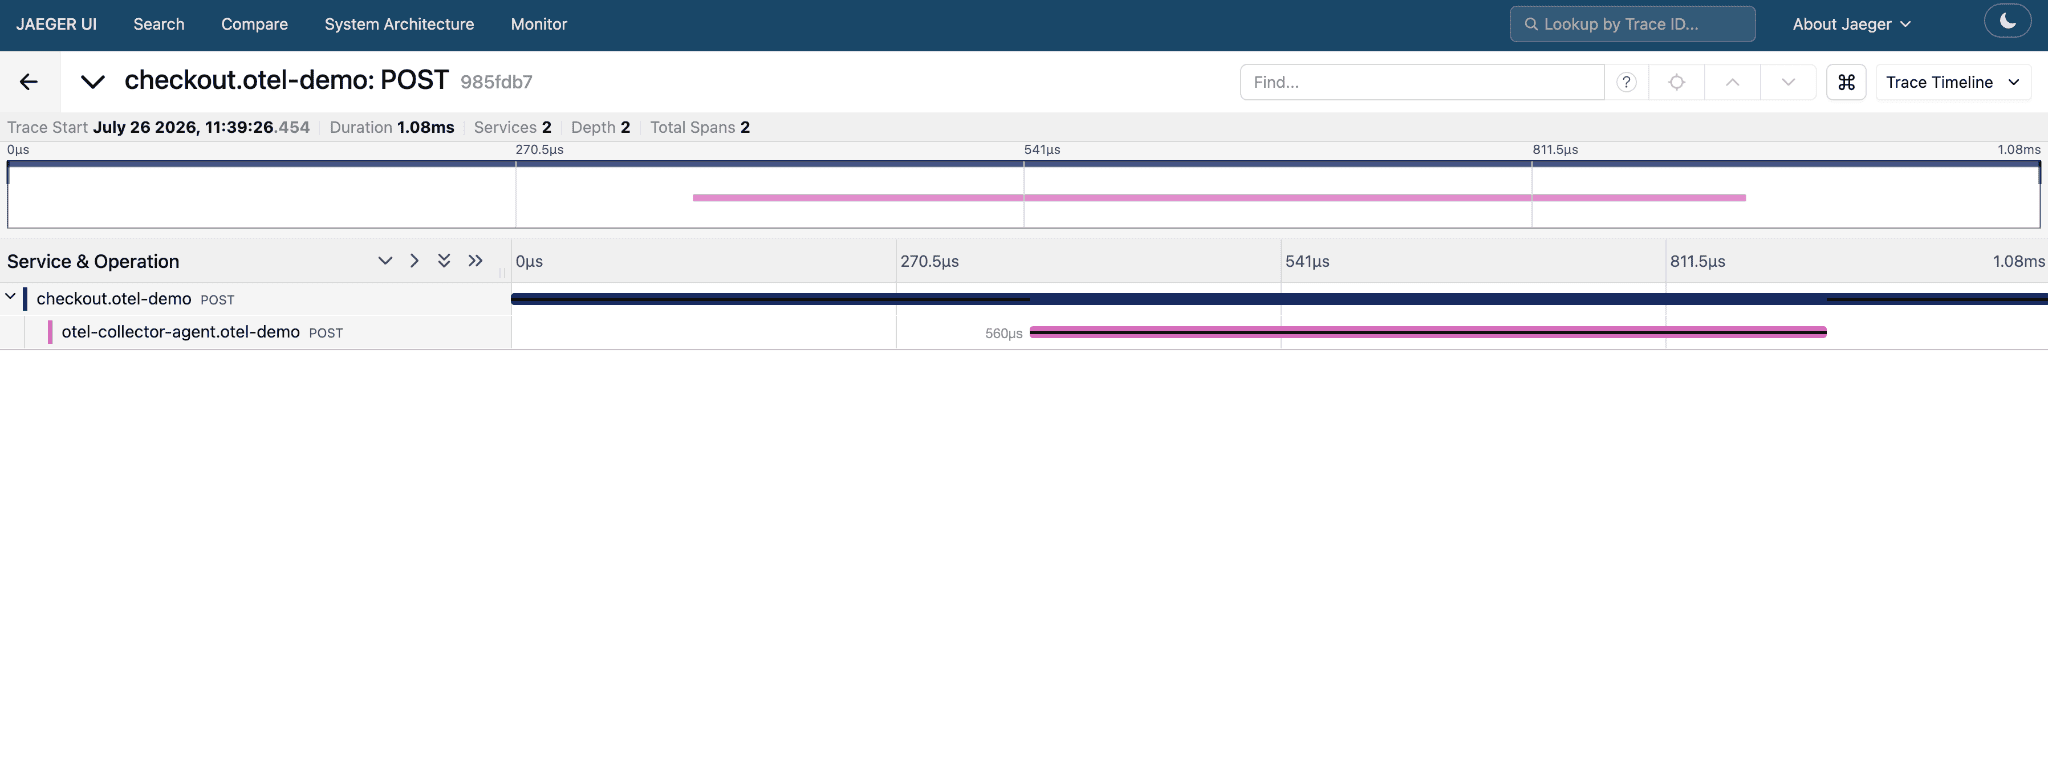
In Jaeger, you start seeing two versions of the same service:
- checkout
- checkout.otel-demo
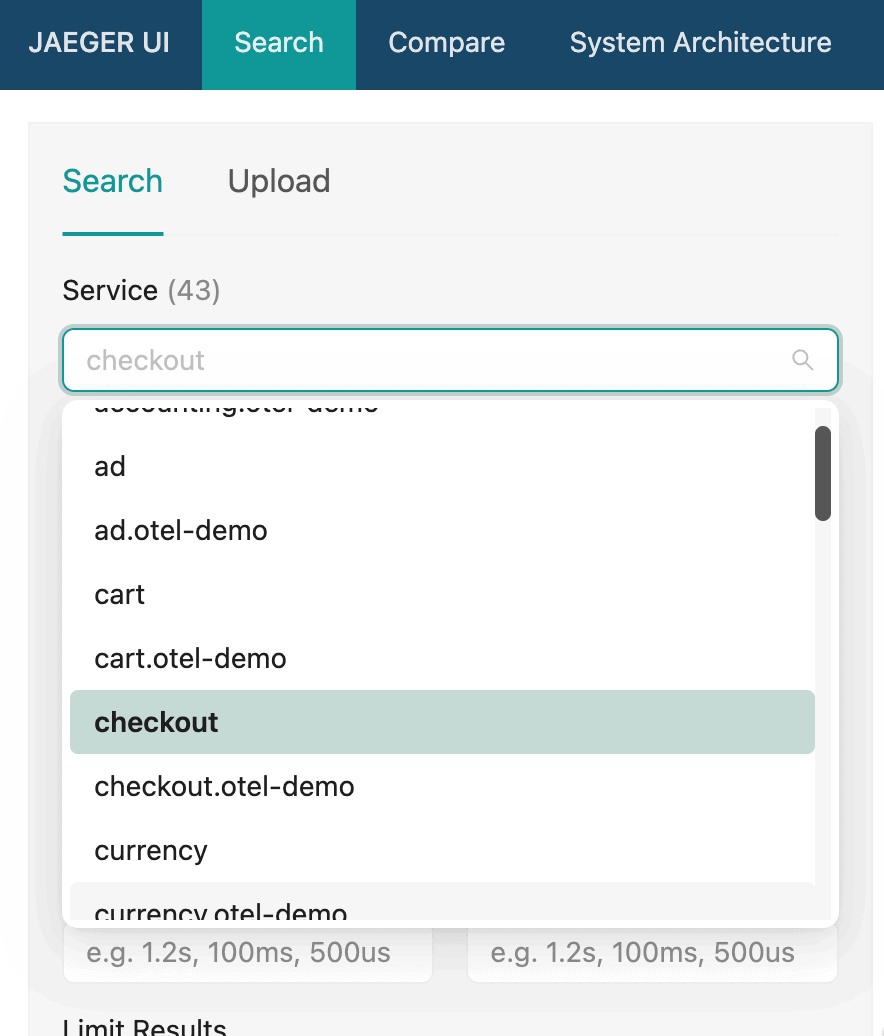
The first comes from the OpenTelemetry SDK inside the application. The second comes from the Envoy sidecar. At first glance, this looks promising. More spans should mean more visibility. In practice, what you have is two unrelated trace trees for the same request.
This is the real integration problem. You do not need more telemetry. You need the telemetry you already have to work together.
Why the traces split
The root of all evil the issue is propagation.
The applications in the OpenTelemetry Demo emit spans using the OpenTelemetry SDK and propagate context using the standard W3C Trace Context headers. Once Istio tracing is enabled, Envoy starts generating spans as well. If Envoy does not extract the same incoming context and continue the same trace, it creates a new root span.
Now you have two stories for the same request:
- the application trace, with business logic, RPCs, and database spans
- the mesh trace, with proxy hops, network latency, and retries
Both are useful. Neither is enough on its own.
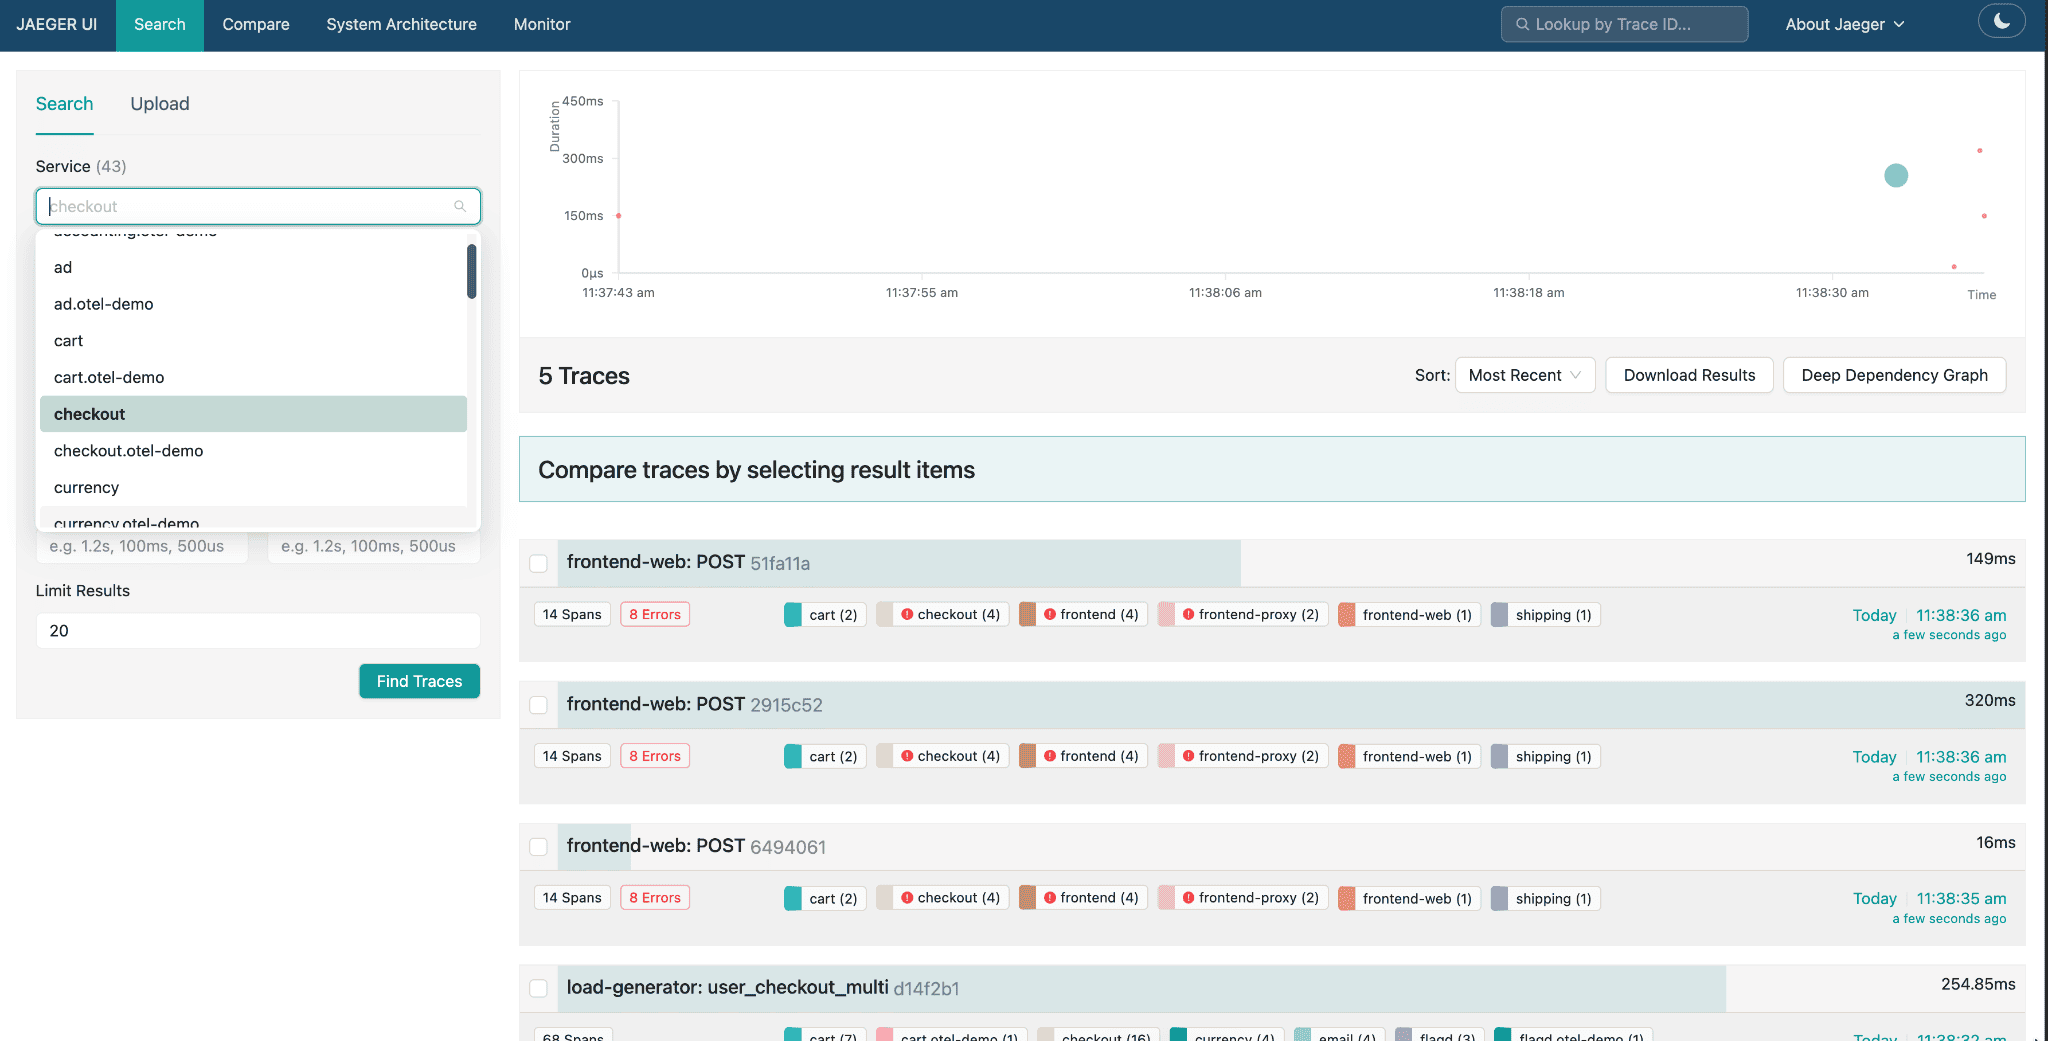
This is also why OpenTelemetry matters here. It gives you the instrumentation layer inside the applications, the Collector as the integration point, and the flexibility to receive traffic in more than one format while still forwarding everything into the same backend.
What OpenTelemetry can change in this setup
There are two practical pieces to fix this.
The first is the Collector. Instead of treating the Collector as just another exporter target, treat it as the place where the mesh and the applications meet. In the demo, the applications already send OTLP data to the Collector. To integrate Envoy cleanly, the Collector also needs to be able to receive the tracing format that Envoy can use for context extraction in a compatible way.
The second is propagation. The application and the mesh have to agree on headers (i.e. talking the same language). If the application only emits one format and the mesh expects another, or handles it differently, you get split traces. In this case, the practical fix was to have the applications emit B3 in addition to tracecontext and baggage.
That combination is what makes the integration work:
- applications keep sending traces through OpenTelemetry
- Envoy can join the existing trace instead of starting a new one
- the Collector remains the central point that receives and forwards telemetry
The concrete fix for the OpenTelemetry Demo
That was the theory, let’s apply it.
Switch Envoy to the Zipkin tracer
Envoy’s built-in OTel tracer starts a brand-new root span for every request. It never reads the incoming W3C traceparent header. The OTel SDK inside each service continues forwarding its own traceparent independently, so the two trace streams never converge.
First, we need to make sure that Envoy exports all spans to the collector, by making sure the correct service and port are defined:
apiVersion: install.istio.io/v1alpha1
kind: IstioOperator
spec:
  meshConfig:
    extensionProviders:
      - name: otel-tracing
        opentelemetry:
          service: otel-collector.otel-demo.svc.cluster.local
          port: 4317
After that, the actual fix, from a user perspective, is to switch Envoy to its Zipkin tracer instead. Envoy’s Zipkin tracer does extract B3 trace context from incoming requests and creates child spans under the existing trace. In the same meshConfig, we need to add:
enableTracing: true
    defaultConfig:
      tracing:
        zipkin:
          address: otel-collector.otel-demo.svc.cluster.local:9411
This was the most surprising bit. One would think that enabling OpenTelemetry with the otel-tracing provider would be the ultimate zero-instrumentation solution (see Telemetry resource). But we can fix this since the OpenTelemetry collector is able to converge multiple receivers into the same pipelines. By just pointing it at the OTel Collector’s Zipkin receiver (port 9411) spans will still end up together.
Add B3 propagation to the application services
Our changes get Envoy spans into the pipeline: which is already very nice. But it does not guarantee those spans will join the same trace as the application spans.
The other half of the fix is propagation on the application side. In the OpenTelemetry Demo, it’s easily achieved by adding b3multi alongside tracecontext and baggage to the OpenTelemetry demo values:
default:
  envOverrides:
    - name: OTEL_PROPAGATORS
      value: "tracecontext,baggage,b3multi"
In practice, this configures automatically instrumented applications to keep propagating the standard W3C headers, while also emitting B3 headers that Envoy can use to continue the same trace instead of creating a new one.
Results
Once this is fixed, instead of seeing one trace for the application and another for the sidecar, we see all spans together into a single trace that contains both. In our example, instead of having clusters of ~14 or 2 spans we can see that the checkout service now has between 51 and 75 spans together:
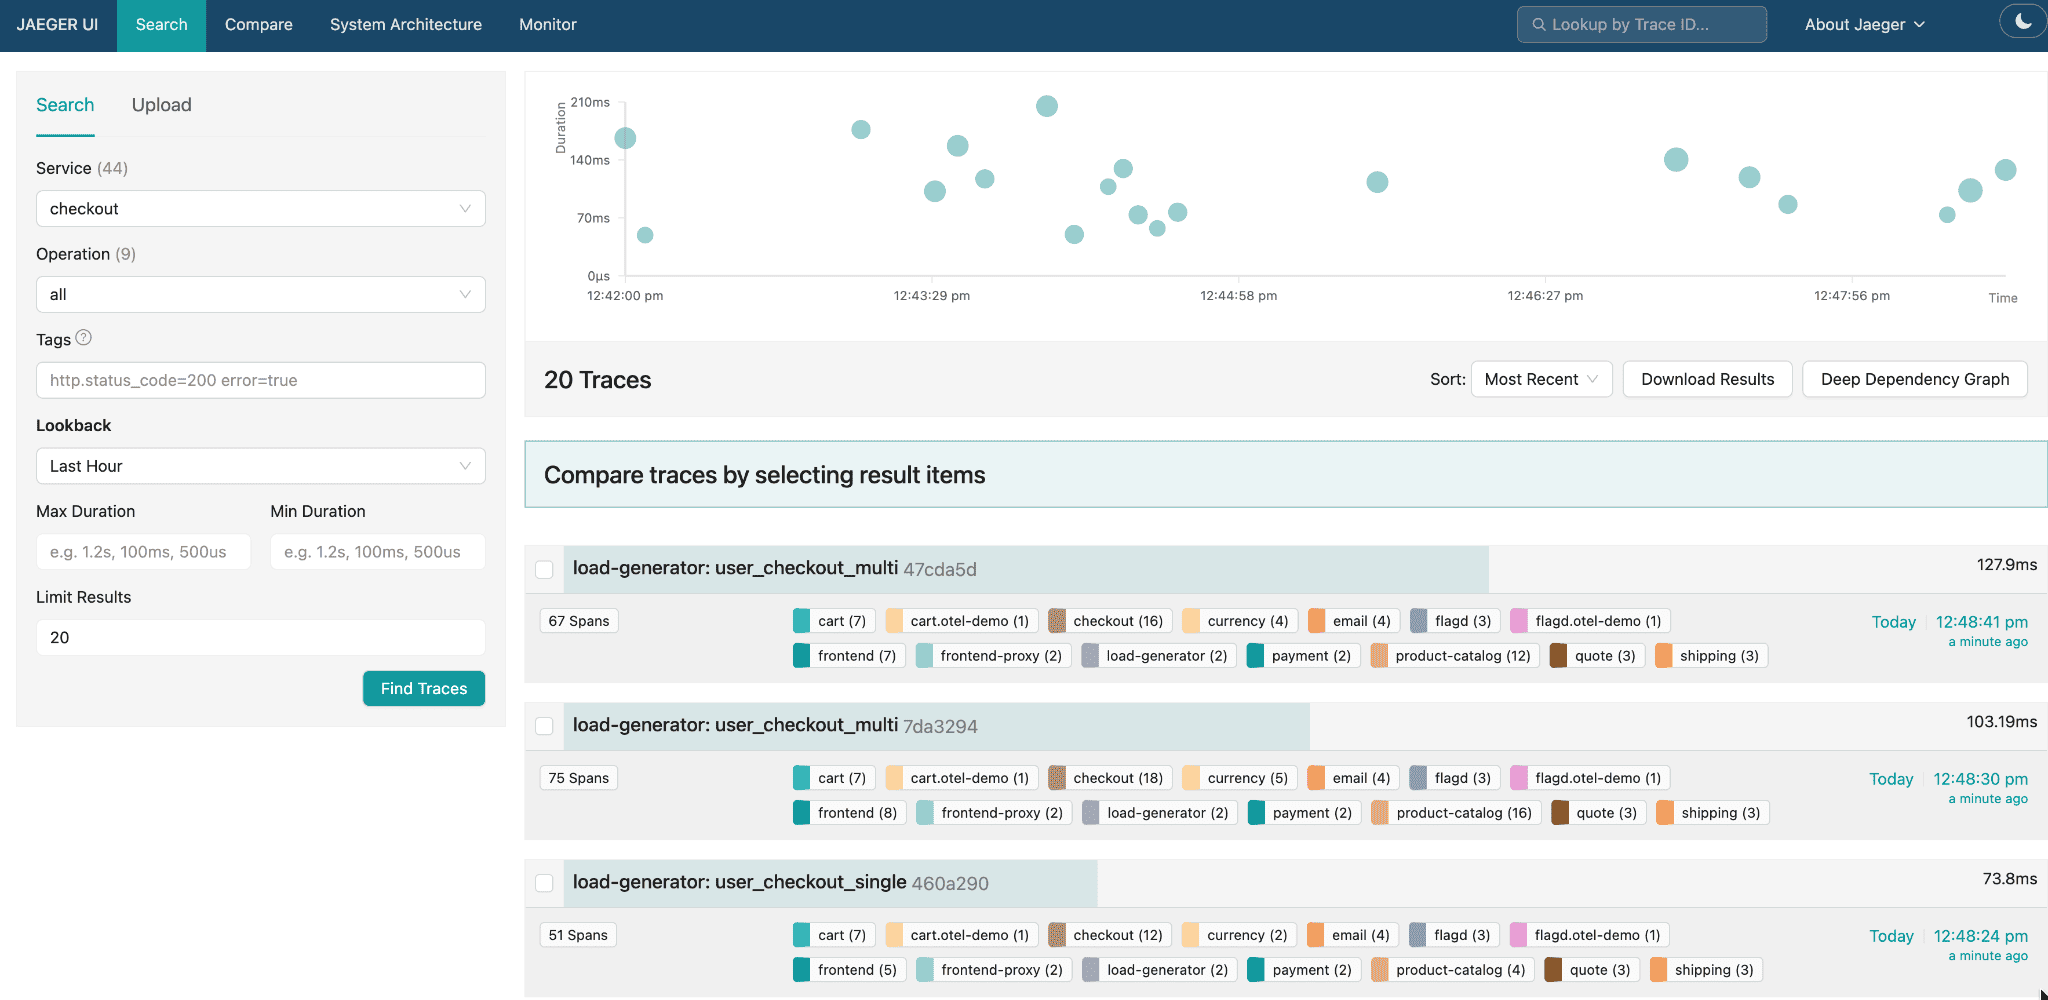
This constitutes the difference between “we have tracing” and “let’s debug a request”.
With the traces unified, the OpenTelemetry Demo becomes much more useful as an
example of what production systems need:
- application spans for business logic and downstream calls
- proxy spans for network hops and retries
- one trace ID across the whole request path
That is the outcome worth aiming for.
Final thoughts: Why the Collector is central here
Every system in production involves software at different versions, from different projects, with different defaults. Applications can be instrumented correctly. The Collector can be running correctly. Jaeger can be receiving data correctly. And the traces can still be broken because one dependency is not configured exactly like the others need it. In our case, Envoy’s built-in OTel tracer starts a brand-new root span for every request rather than reading the incoming traceparent, and changes to that behavior take time (as in every project!).
That is why switching Envoy to the Zipkin/B3 tracer was only half of the fix. We also needed a place where spans arriving in different formats could be translated into the same language. The OpenTelemetry Collector is perfect for that: it receives telemetry in multiple formats, normalizes everything into the OpenTelemetry model, and exports it to a single backend. Once Envoy could extract trace context from incoming requests and forward spans to the Collector’s Zipkin receiver, application spans and mesh spans were no longer living in separate universes: they are all processed in the same telemetry pipeline.
This pattern extends well beyond tracing. The Collector can handle semantic convention changes, sampling, cardinality control, span metrics generation, information redaction, and export to multiple backends simultaneously. Istio is a powerful system, it provides routing, certificate rotation, and observability with almost no configuration. But it sometimes needs targeted tweaks to reach its full potential. Having a central piece of software able to normalize format inconsistencies on the fly is what makes that combination actually work in production.