
Thank you to Laura Llinares, Mary Baldwin Hughes, Vimal Kumar, and Sunil Thaha for their significant contributions to this blog post and the Kepler project.
Data centers accounted for 1.5% of global electricity demand in 2024, which is projected to double to around 945 TWh by 2030, driven in part by rapid growth in AI workloads according to the International Energy Agency’s “Energy and AI” report published in 2025. In Kubernetes clusters, there is no easy built-in method to allocate power per workload. Kepler solves this: it reads from hardware power meters, attributes this power consumption to Linux processes, associates that to Pods running in your Kubernetes cluster, and exports Prometheus metrics.
Since joining the CNCF as a sandbox project in 2023, Kepler adoption has grown. However, the original architecture relied on eBPF, and while that added granularity, it also created problems. First, it required CAP_BPF and CAP_SYSADMIN privileges, which is a blocker for many production environments. Secondly, eBPF proved to be error-prone when it comes to tracking fine-grained, kernel-level processes at this level of accuracy. Data inaccuracy at this level creates a bottleneck for the power estimation models that we need to train in order to deploy Kepler on virtual machines (VMs). Beyond the elevated privileges and accuracy issues, the eBPF integration made the learning curve steeper. It added complex abstractions that made it difficult to extend and maintain the codebase.
The team decided to tackle these challenges head on. We wanted to make Kepler easier to configure and deploy, less error-prone, and easier for the community to extend the codebase.
The maintainer team made a big but exciting decision: rewrite Kepler. In this post, we walk through what changed, why, and how you can get involved. And for more on this decision, Vimal Kumar walks though the rewrite in this podcast episode.
Re-architecting Kepler
To run Kepler, two elements are required: the utilization signal of the containerised Linux process and power meter access. The Power Attribution documentation guide explains how Kepler measures and attributes power consumption to processes, Pods, and other Kubernetes internals.
Previously, Kepler relied on eBPF to capture utilization signals, which accounted for the majority of user-reported issues. At the same time, it caused missing short-live, terminated processes, leading to inaccurate, under-reported energy footprints.
To prioritize ease of adoption and accuracy improvement, we are shifting away from eBPF and going back to basics. Our re-architected solution leverages read-only access to standard /proc and /sys. Because these are universally available on Linux systems, they require significantly lower privileges and minimal setup. By eliminating the complicated configuration overhead, we’ve made Kepler easier to deploy out-of-the-box via a single configured Helm.
For the power metrics, previously, Kepler assumed a hardcoded power structure (e.g., RAPL is composed of core, DRAM, and other). However, we found that actual hardware topologies vary significantly, meaning the old design was attributing data to a non-existent ground truth. The re-architected Kepler dynamically discovers the host’s power meter structure at runtime. By adapting to the layout of the underlying hardware, Kepler can now report precise energy metrics across diverse environments according to real availability.
Validating Accuracy Improvements
We ran two experiments to validate the accuracy improvements of the Kepler rewrite.
Experiment 1: Comparing pre- and post-rewrite versions
The first test, led by Laura Llinares (CERN), compared versions of Kepler before and after the rewrite. We deployed both Kepler versions simultaneously on the same bare-metal node:
- kepler-old: the previous version, publishing metrics with an old_ prefix.
- kepler-new: the re-architected version, publishing clean metrics without prefix.
- Intelligent Power Management Interface (IPMI): hardware BMC power meter readings.
Then we compared Node-level CPU energy and container-level CPU energy.
Both Kepler versions read the RAPL Package domain (entire CPU socket). The newer Kepler versions expose power both as a watts gauge (kepler_node_cpu_watts) and as joules counters (kepler_node_cpu_joules_total and kepler_container_cpu_joules_total). In the Grafana dashboard panels shown below, PromQL is used to derive watts from the old joules counters using PromQL’s rate() so that all series share the same unit.
- Node-level CPU energy
| Metric | Version |
kepler_node_package_joules_total | old |
kepler_node_cpu_watts | new |
Both counters increment with energy consumed by the CPU Package RAPL domain at node level.
- Container-level CPU energy
| Metric | Version |
kepler_container_package_joules_total | old |
kepler_container_cpu_joules_total | new |
IPMI is the full-node power draw from the BMC. It includes DRAM, fans, NICs, and PSU losses on top of CPU, so Kepler values are expected to be 40-70% of IPMI. Since IPMI measures the whole node and Kepler measures only the CPU, we use IPMI as a load shape reference. IPMI is displayed as a background reference in the overlay panels. When a stress workload ramps up, IPMI and both Kepler versions should all rise together. A Kepler estimator that rises and falls in sync with IPMI is correctly tracking load.
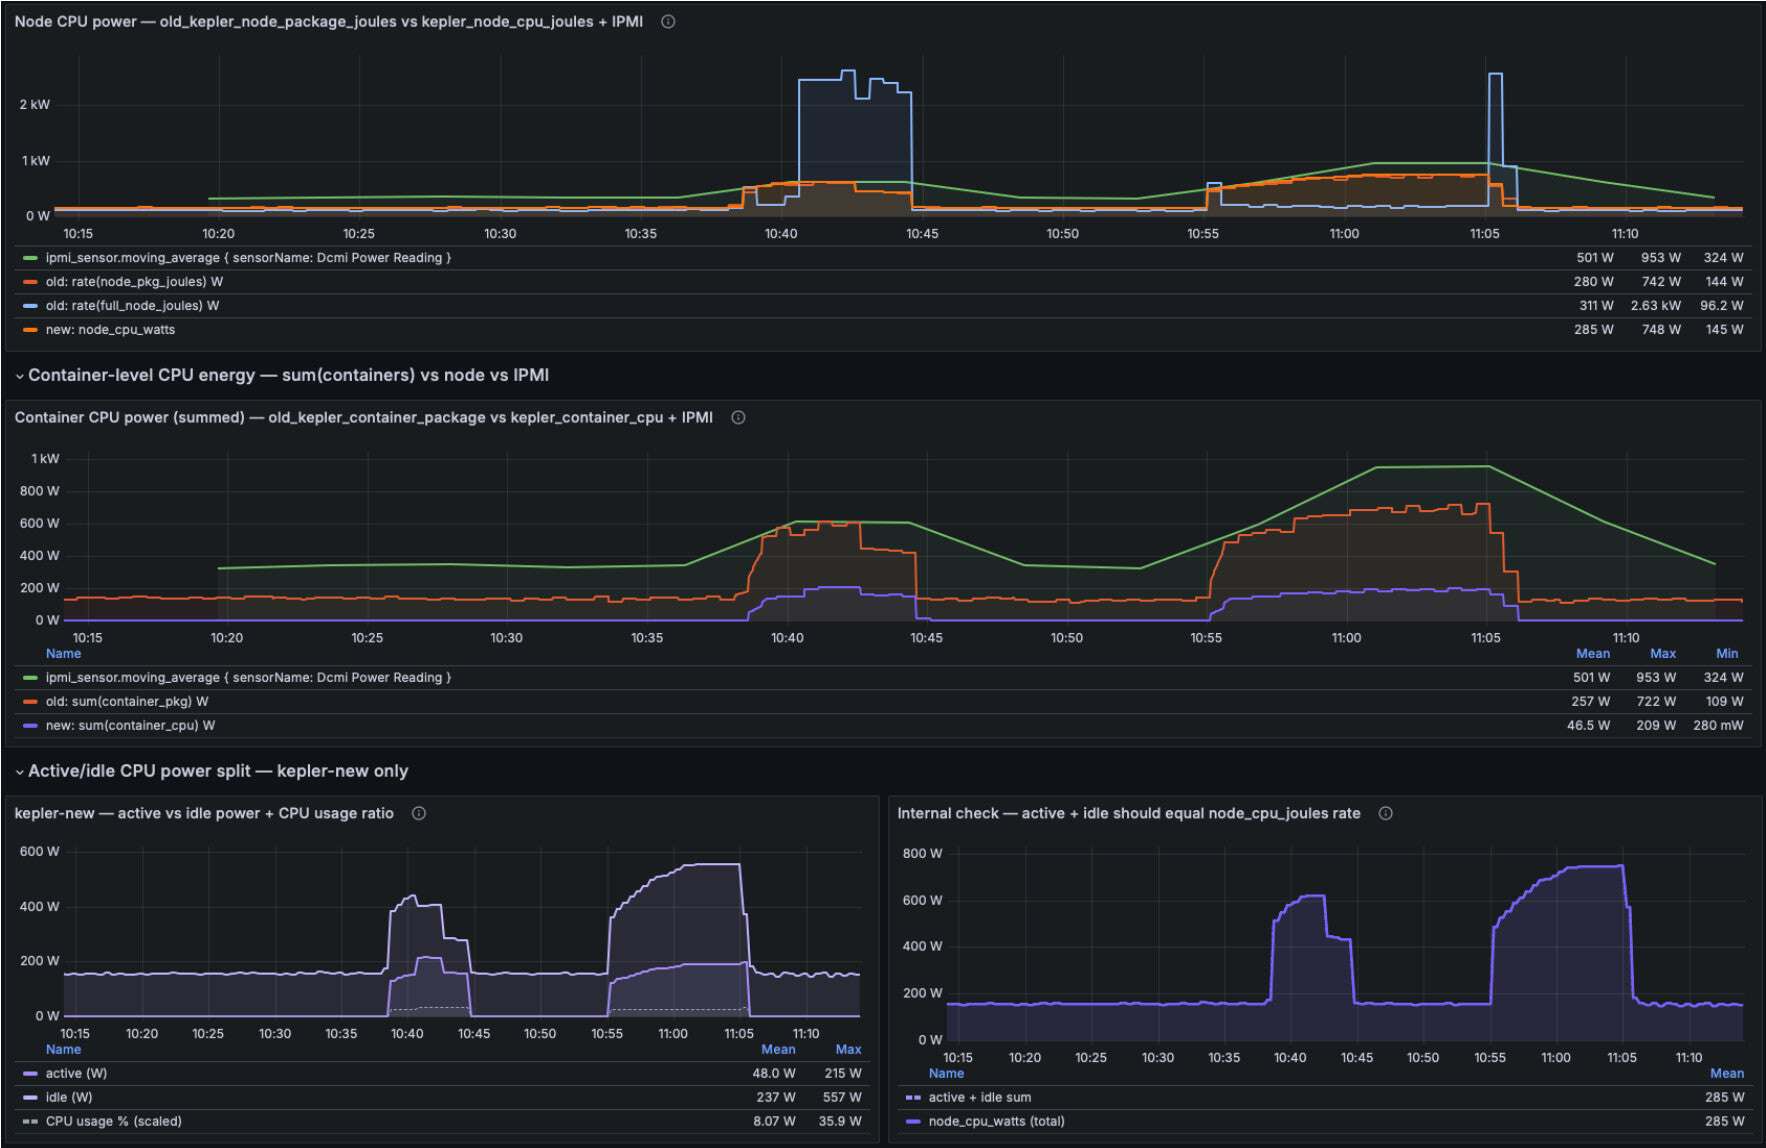
Dashboard (source) showing old vs new Kepler tracking against IPMI
The new Kepler node_cpu_watts metric tracks IPMI patterns closely and eliminates the multi-kW spikes seen with the old node_pkg_joules and full_node_joules counters that exceed the IPMI ground truth values.
Experiment 2: Negligible attribution gap
The second test, led by Vimal Kumar (Red Hat), shows the negligible attribution gap when comparing Node power with power derived through the process attribution model, which validates the accuracy of Kepler’s new design. The system testing uses a progressive stress-ng workload. The resulting Grafana dashboard panels for core and package energy show a Process Power Attribution Gap of essentially 0 Watts.
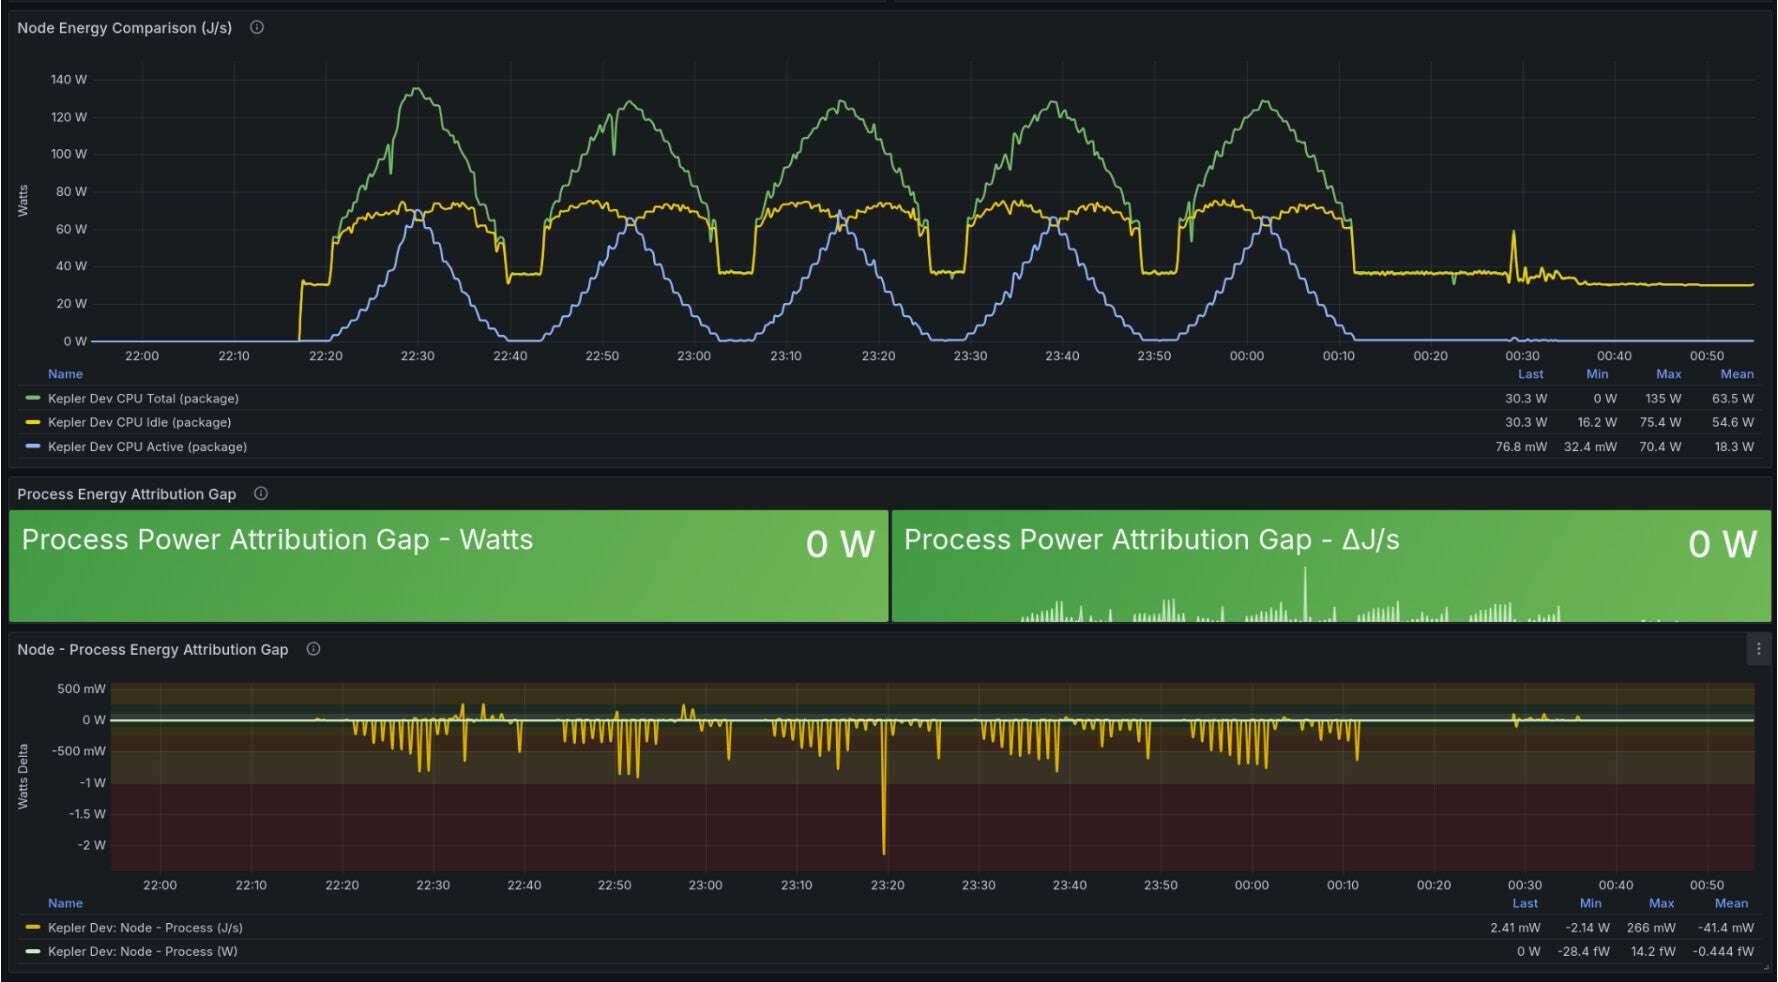
Dashboard (source) panels showing process energy variation and attribution gap
Dashboard (source) panels showing core energy variation and attribution gap
Furthermore, the detailed delta graphs indicate that the difference between the total node active energy and the energy distributed to individual processes is minimal, fluctuating by only a few milliwatts. This negligible variance demonstrates the architecture’s capability to accurately track and assign power usage at the process level.
Last but not least, we added extensive integration and unit tests to reach 90% testing coverage. This improves the long-term maintainability and trust in results. This is key to validate the accuracy of the power metrics that Kepler exports. The project will continue improving the testing and validation framework to keep improving Kepler’s accuracy.
What’s Next? A Call to Action
The rewrite lays the foundation. Our immediate priorities are improving CPU power attribution on bare metal then extending to VMs. Getting this right is key. It sets the stage for everything that comes next.
Looking ahead, there’s a lot we’re excited about, and plenty of room to help! We’re looking for contributions in three specific areas:
- Try GPU power monitoring: We have an experimental flag for GPU power monitoring, which is crucial now for AI and accelerator-heavy workloads. We need end users running AI/ML workloads to test and validate Kepler’s GPU power monitoring feature.
- Train VM power modeling: We need community members with machine learning experience to (re-)train the model that estimates power in virtualized environments where hardware counters aren’t available. This will bridge the gap between virtualized environments and physical energy signals.
- Validate data accuracy: We need end users to test kepler against physical power measurements, both CPU attribution on bare metal and GPU power monitoring. If you have hardware with IPMI or external power meters, your results will directly shape how we improve the model.
- Improve Idle Power Attribution: After the rewrite, Kepler only attributes active CPU usage per workload. However, this oversimplifies power estimation. While this was added to avoid confusion between idle and dynamic states, it should be added back and expressed better.
To test Kepler, install it with Helm or the Kepler Operator. Explore the metrics with the Grafana dashboards.
If you wish to contribute, browse and work on good first issues, open a new issue, or review open PRs. For features and bigger work streams, we moved to enhancement proposals. This gives the community a clearer way to discuss ideas, review designs, and collaborate on larger changes before going into implementation.
The rewrite gives Kepler a solid foundation. What comes next depends on the community that builds on it. Join us in our twice-monthly community meetings and in our #kepler-project channel on the CNCF Slack to keep the momentum going! 💚