
Kubernetes metrics show cluster activity. You need them to manage Kubernetes clusters, nodes, and applications. Without them, it also makes it harder to find problems and improve performance.
This post will explain what Kubernetes metrics are, the various kinds you should be aware of, how to gather them.
What are Kubernetes metrics?
Kubernetes metrics are pieces of information that indicate how well the items operating in your Kubernetes environment are performing. They are vital because it’s hard to find problems or solve them before they harm your apps without them. They show you how the cluster is performing.
Types of Kubernetes metrics
Kubernetes generates different metrics that help you understand performance at different system layers. Here are the common ones:
Cluster metrics
In Kubernetes, a cluster refers to the complete environment that executes your application. It has the control plane (API server, scheduler, controller manager, etc.), nodes (VMs or physical servers), and pods/workloads (the containers that operate your program).
So cluster metrics are a summary of metrics from the control plane, nodes, and pods/containers. They provide data relating to the health, performance, and resource usage of the whole Kubernetes cluster.
1. Node CPU resource usage
This tells you how much CPU capacity the cluster’s nodes are consuming compared to what is available. You can determine the total CPU usage of the cluster by summing the CPU consumption of all the nodes. Each node has a set amount of CPU power. You can tell if nodes are overloaded, balanced, or underused by keeping an eye on this metric.
2. Node memory usage
This indicates how much memory (RAM) all the processes on nodes are using, such as kubelet, container runtimes, running pods, and system services. Some important components of memory usage include:
- Working set memory: Memory actively in use by processes that cannot be reclaimed.
- Cache memory: File system cache that can be reclaimed if needed
- RSS (Resident Set Size): Portion of memory occupied in RAM.
Monitoring node memory usage helps prevent clusters from running out of resources, which can result in the termination and removal of a pod from a node or the crashing of apps.
3. Node disk usage
When disk use goes over a certain point, like when there is less than 10–15% free space, the kubelet kicks out a pod to make room.
Node disk usage indicates the amount of space each node in a cluster occupies on the hard drive. There may be no pods left on the node if you run out of disk space.
Node metrics
In Kubernetes clusters, node metrics provide lots of information regarding node health and resource usage.
Monitoring individual nodes helps troubleshoot issues on specific nodes. Metrics like Node CPU Usage and Node Memory Consumption show how much CPU and memory a node is using.
Other node metrics include:
1. Disk I/O and available disk space
Disk I/O measures the read/write rate on a node’s storage devices, while Available Disk Space shows the remaining free space on the node’s filesystem.
High disk I/O can slow down workloads that perform heavy read/write tasks, causing latency. Also, running out of disk space may trigger pod eviction or node failures.
2. Network bandwidth usage
This shows the data sent and received by a node’s network interfaces per second. Network issues can impact communication between pods, nodes, and external services, causing delays or timeouts.
Control plane metrics
Control plane metrics indicate the effectiveness of the control plane. Just for clarity, Kubernetes has two main parts:
- Control plane: The brain (decides what should run where)
- Nodes: The worker (actually runs your apps and containers).
The control plane is where Kubernetes holds its decision-making and cluster-running capabilities. It schedules your programs, or pods, and monitors the cluster’s health. It also provides instructions to the worker nodes.
Tracking control plane metrics helps detect issues with key services like the API server, scheduler, and controllers, ensuring cluster reliability and responsiveness.
1. API server request latencies
This is how long the Kubernetes API server takes to respond to client queries like listing nodes, deploying items, and getting pod information. It shows how long messages and replies take.
Assume that a request to list every pod typically takes 100 milliseconds. The server may be suffering a delay as a result of an overload if there is a delay of up to two seconds.
An excessively long API request indicates a sluggish control plane, which may make the entire cluster less responsive.
2. Scheduler queue length
Shows the number of pods waiting to be scheduled to a node. Monitoring queue length helps detect resource shortages or scheduler performance issues early.
The cluster may be experiencing issues with resource allocation or setup if the scheduler queue length, which is typically small, unexpectedly increases to 50+.
The availability and user experience can be negatively affected by delays in app deployment or workload scalability caused by a large queue length.
Pod metrics
Pod metrics are the performance data about your running pods. Kubernetes Monitoring helps you catch problems early, know when to scale your apps, and keep everything running smoothly before users notice any issues.
Aside from CPU usage and memory consumption, here are other examples of pod metrics.
1. Pod Restart Count
This displays how many times a pod’s container restarted due to a crash, failure, or resource shortage. If the system restarts often, apps or resources might be the problem.
2. Pending Pod Count
This shows how many pods are pending. Pending pods are the ones that are still waiting to be scheduled to a node. They wait for the Kubernetes scheduler to locate a node that is good for them.
Pods can be pending for the following reasons:
- Insufficient resources available
- Scheduling problems
- Problems with image
Run “kubectl get pods — field-selector=status.phase=Pending” to get a list of pods to be scheduled.
3. Pod Status
Pod status shows the current state or health of a pod and indicates if it’s running smoothly or facing any challenges. Common pod statuses include:
- Pending: The pod has been accepted by Kubernetes, but its node operation has not yet been scheduled.
- Running: Pod is assigned a node, and at least one container is running.
- Succeeded: All containers in the pod completed successfully.
- Failed: One or more containers terminated with an error.
- Unknown: Kubernetes is unable to ascertain the pod’s condition as a result of poor communication.
If you run the command:
kubectl get pods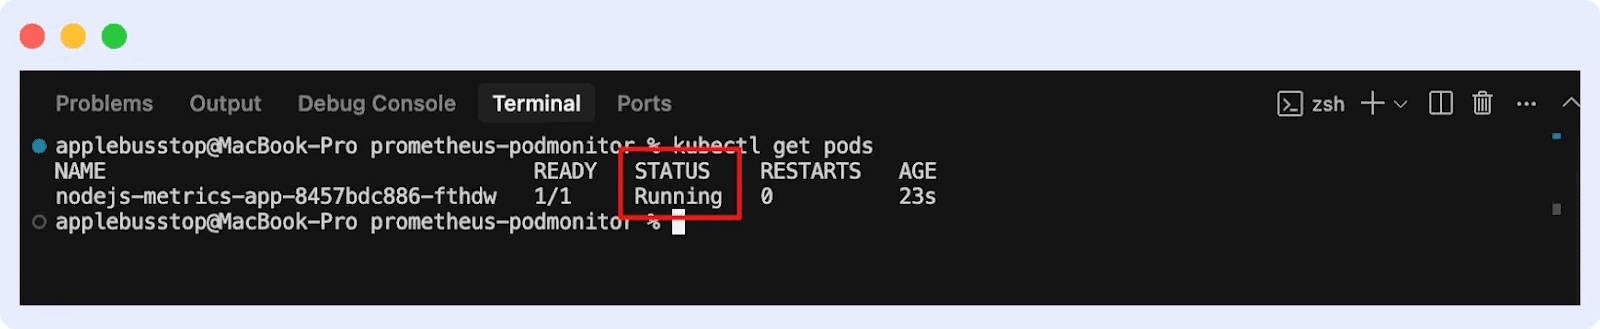
You’ll see the list of pods and their status.
How to collect metrics in Kubernetes
You need Kubernetes monitoring tools that collect, process, and occasionally store information for analysis because Kubernetes does not store all metrics by default.
Metrics server
Metrics Server collects CPU and memory metrics for nodes and pods in Kubernetes. It provides real-time resource usage data for other components instead of storing it long-term.
Metrics Server collects resource usage data from the kubelet on each node and exposes aggregated metrics through the Kubernetes API. It gathers data every 15 seconds to provide near real-time resource utilization.
Here’s how to set up Metrics Server:
1. Install the Metric Server using the kubectl command
kubectl apply -f https://github.com/kubernetes-sigs/metrics-server/releases/latest/download/components.yamlThis will create the necessary Deployment, ServiceAccount, roles, and bindings.
2. Verify installation by running the command “kubectl get deployment metrics-server -n kube-system”
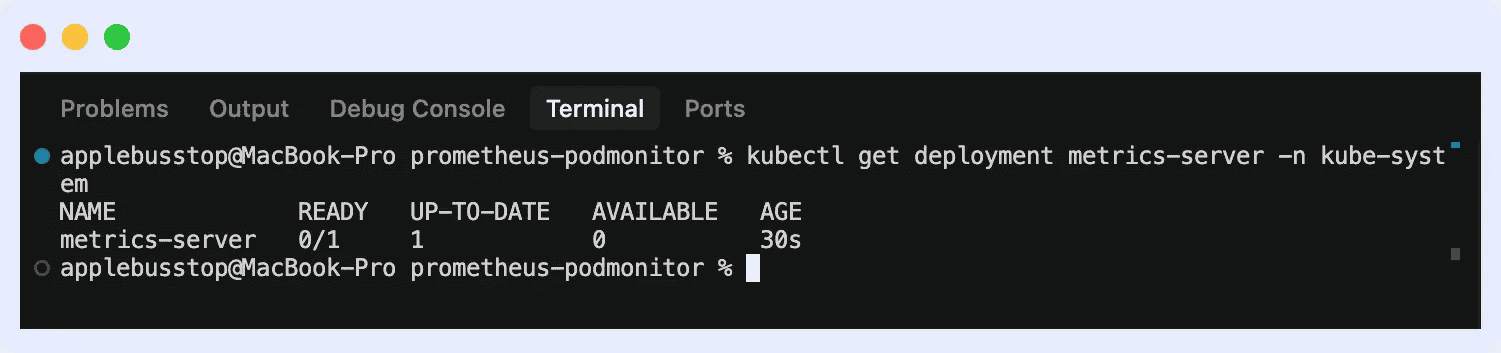
This will ensure it is running with available pods.
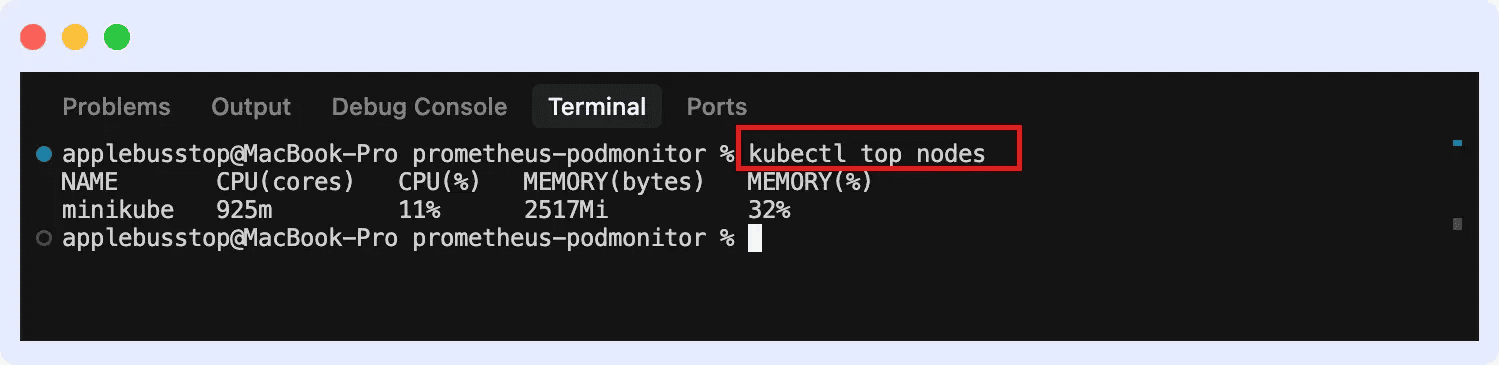
3. Then you can view metrics for both nodes and pods.
For nodes:
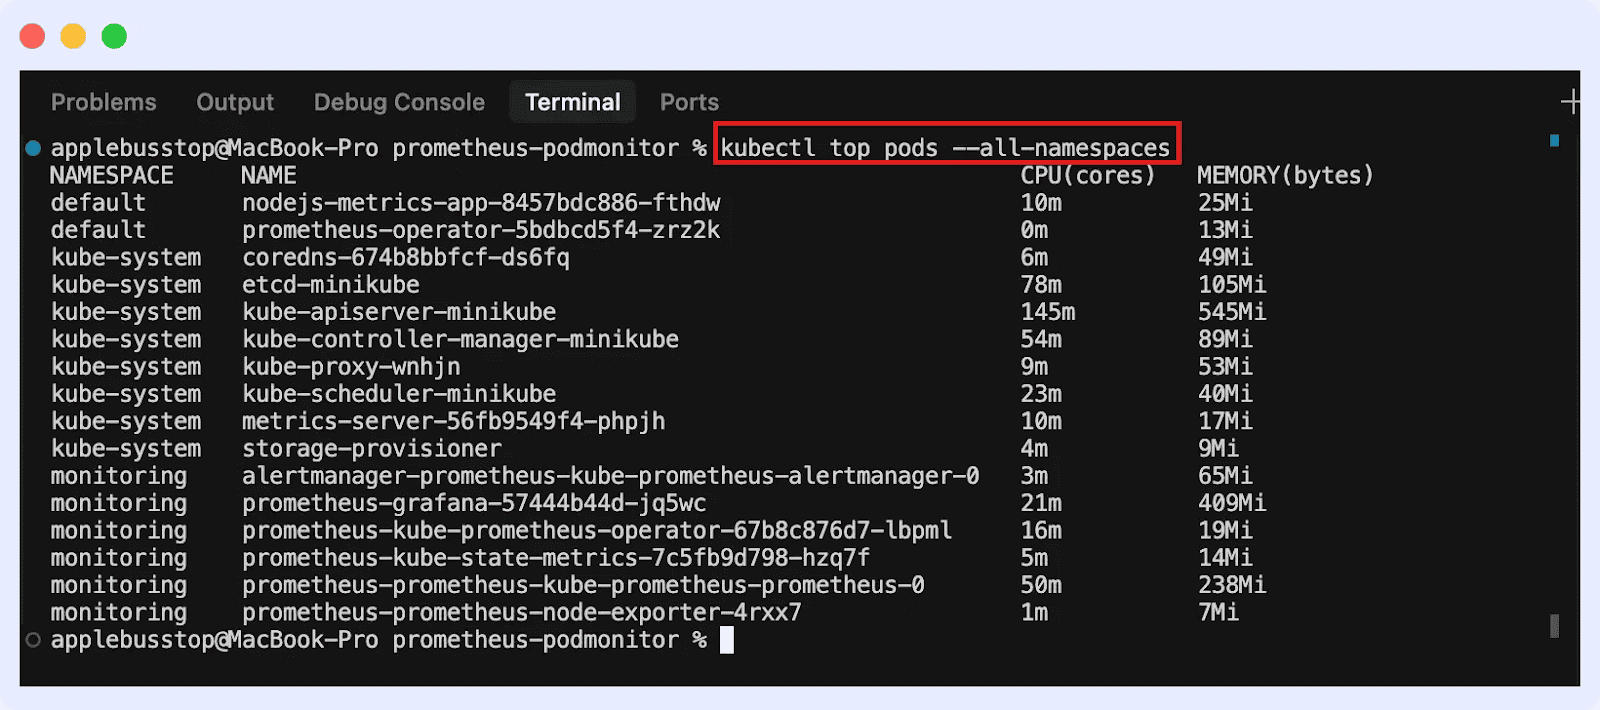
For pods (across all namespaces):
cAdvisor
Container Advisor, or cAdvisor, gathers data on resource consumption in real time for pods and containers.
Since cAdvisor is embedded within the kubelet, it automatically collects container-level data on every node. The Kubelet’s endpoint provides metrics that may be used with Prometheus to create dashboards and analyze data.
Kube-State-Metrics
This tool monitors Kubernetes nodes, namespaces, deployments, and pods. It tracks cluster state, configuration, and health, enabling monitoring systems to collect metrics for visualization, alerting, and analysis.
Here’s how to install it:
1. Install via Helm
First, add the Prometheus community Help repo:
helm repo add prometheus-community https://prometheus-community.github.io/helm-charts
helm repo update
Install Kube-State-Metrics in your cluster:
helm install kube-state-metrics prometheus-community/kube-state-metrics
This creates the necessary deployments, service accounts, and permissions automatically.
2. Install manually using YAML manifests
Apply the official Kube-State-Metrics manifests provided in the GitHub repo:
kubectl apply -f https://github.com/kubernetes/kube-state-metrics/releases/latest/download/kube-state-metrics-standalone-release.yaml
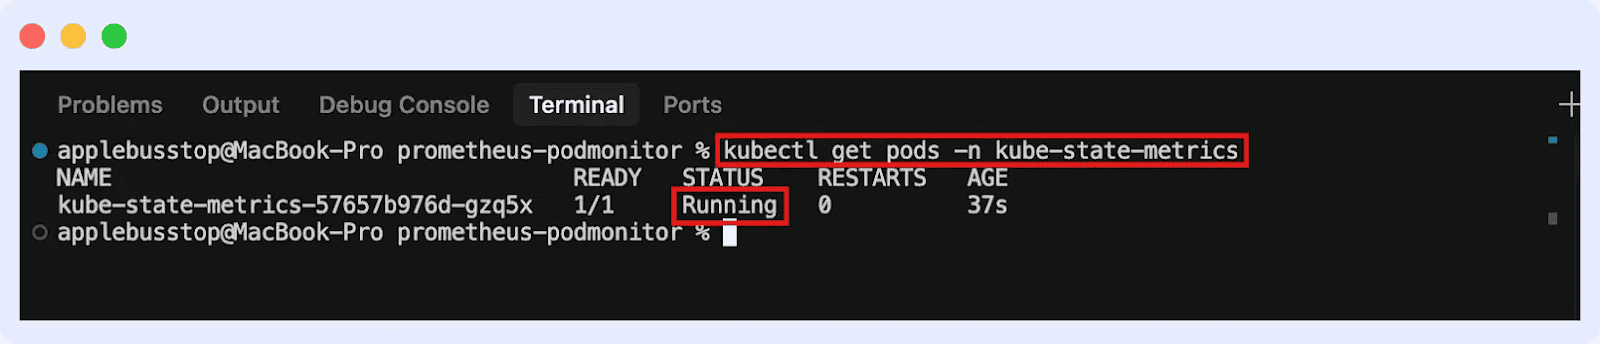
This will deploy Kube-State-Metrics in your cluster. You can go ahead to confirm if it’s running:
Conclusion
Metrics help you check pods, nodes, and clusters. They allow you to keep an eye on the health and condition of workloads to find problems early and make sure apps work well.
To understand the context of what problems metrics can reveal, explore our blog on Kubernetes Troubleshooting Techniques.