
The challenge
Managing millions of concurrent connections during global events like flash sales and online voting requires resilient, scalable observability. At STCLab, we operate platforms including a bot mitigation platform and traffic management platform that support up to 3.5 million simultaneous users across 200 countries.
In 2023, we made a pivotal decision to sunset our 20-year legacy, on-premise architecture. We completely restructured our traffic management platform, building it from the ground up as a global, Kubernetes-native SaaS.
Cost wasn’t the only issue. It was the consequences. We were forced to disable APM entirely in dev/staging environments and sample just 5% of production traffic. Performance regressions were only caught after hitting production. This reactive firefighting was unsustainable.
We needed a solution that could monitor all environments cost-effectively without compromises.
We migrated to open observability standards with a full CNCF backing: OpenTelemetry for instrumentation and the LGTM stack—Loki, Grafana, Tempo, and Mimir.
The results were transformative:
- 72% cost reduction compared to our previous vendor.
- 100% APM trace coverage in all environments (up from 5% sampled in production).
- Unified observability across all our disparate Kubernetes clusters.
- Zero vendor lock-in by standardizing on CNCF-backed open standards.
We’ll walk through how we executed this migration, technical hurdles, performance tuning strategies, and specific configurations that worked for us.
Observability architecture overview
Key architectural decisions
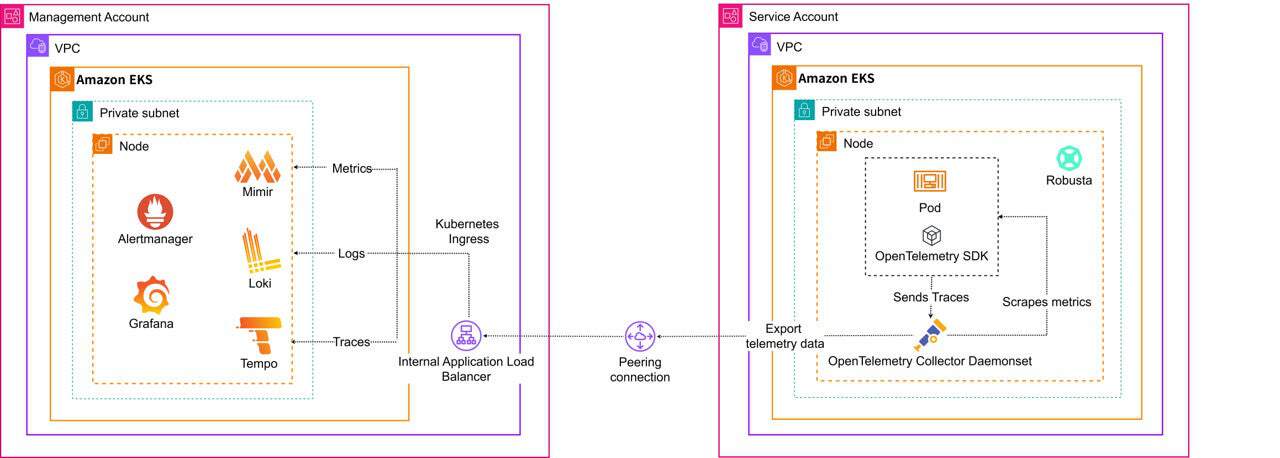
Centralized backend, distributed collectors
We centralized all telemetry into a single management cluster using multi-tenancy rather than deploying full LGTM stacks everywhere.
How we did it:
- Each cluster deploys a lightweight OTel Collector
- Collectors inject tenant IDs via
X-Scope-OrgIDheader (e.g.,scp-dev,scp-prod) - A central backend of Mimir, Loki, and Tempo isolates data by tenant
- Per-tenant rate limiting prevents “noisy neighbor” issues
This setup ensures that a metric surge in dev throttles only that tenant, while production remains unaffected.
OpenTelemetry as the Universal Ingestion Layer
The OpenTelemetry (OTel) Collector handles multi-tenancy tagging, batching, buffering, retries, and tail sampling. We used OTel auto-instrumentation for Java and Node.js workloads, enabling full APM without the need to modify application code.
Complete backend decoupling. Migrating from Tempo to Jaeger requires only one config line change and zero application changes.
Key Configurations Patterns
Below are the specific configurations we applied to implement this multi-tenant architecture.
Multi-tenancy injection (per-cluster collector):
exporters:
  otlphttp/tempo:
headers:
X-Scope-OrgID: "scp-dev"  # Unique ID for this environment
retry_on_failure:
enabled: true
sending_queue:
enabled: true
Per-tenant limits (central Mimir):
runtimeConfig:
 overrides:
   scp-dev:
     max_global_series_per_user: 1000000
     ingestion_rate: 10000
Processor ordering strategy:
memory_limiterfirst (prevent OOM)- Enrichment (k8sattributes, resource)
- Filtering/transformation (filter, transform)
- batch last (efficient delivery)
Key challenges
The metric explosion
Deploying OTel Collector as a DaemonSet caused our metrics to explode, multiplying by 20-40x. Every collector scraped all cluster-wide targets with 14 nodes. Kubelet metrics were scraped 14 times.
We fixed this with a Target Allocator per-node strategy that assigns scrape jobs only to collectors on the same node as targets:
opentelemetryCollector:
 mode: daemonset
 targetAllocator:
   enabled: true
   allocationStrategy: per-node
consistent-hashing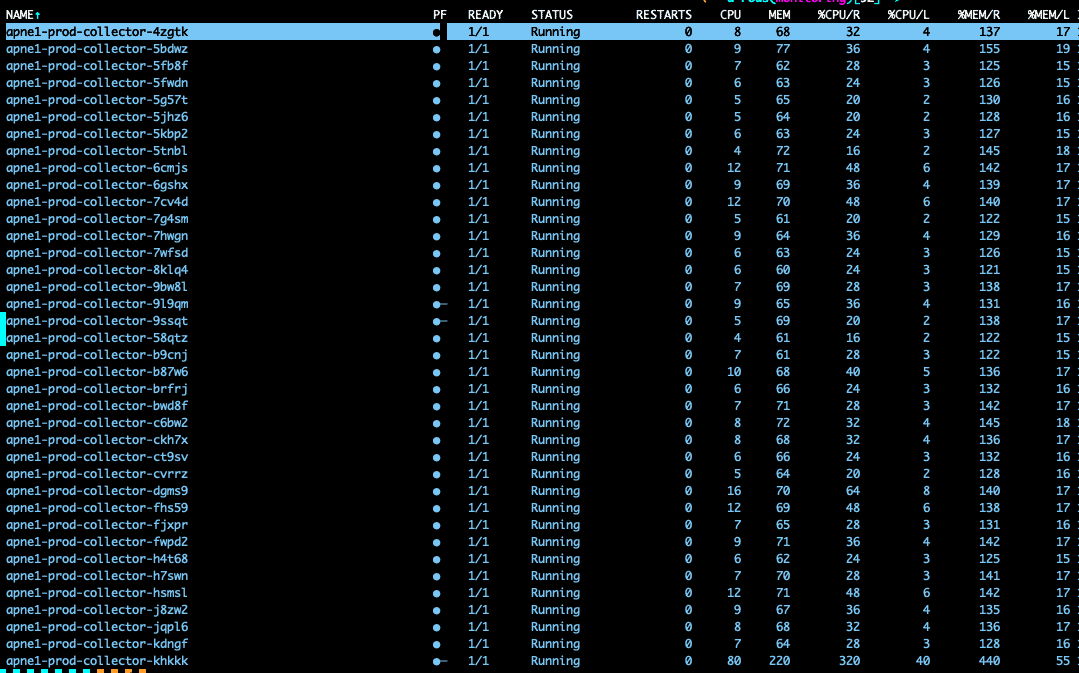
per-nodeMonitor these:
otelcol_receiver_refused_metric_points_total: Non-zero = data lossopentelemetry_allocator_targets_per_collector: Uneven distribution is expected in per-node mode (reflects varying pod counts per node)
Version Alignment
If Prometheus scraping breaks after enabling the Target Allocator, check that your Operator, Collector, and Target Allocator are all on the same version.
When our Target Allocator was running version 0.127.0, and our Collector was on 0.128.0, our scrape pools failed to initialize, giving us the following error:
2025-06-27T05:31:27.578Z error error creating new scrape pool {"resource": {"service.instance.id": "bfa11ae0-f6ad-4d5b-97e8-088b8cd0a7f4", "service.name": "otelcol-contrib", "service.version": "0.128.0"}, "otelcol.component.id": "prometheus", "otelcol.component.kind": "receiver", "otelcol.signal": "metrics", "err": "invalid metric name escaping scheme, got empty string instead of escaping scheme", "scrape_pool": "otel-collector"}We traced the issue to breaking changes in Prometheus dependencies between versions.
- v0.127.0: didn’t recognize or improperly implemented the configuration for the new escaping scheme.
- v0.128.0: Was built on a newer Prometheus dependency, which enforced stricter validation for the escaping scheme, causing the
prometheusreceiverto fail when it received the older-style configuration.
We learned that you should always version-lock the Operator, Collector, and Target Allocator together. This led us to explicitly unify all component versions:
opentelemetry-operator:
  enabled: true
  manager:
	image:
  	repository: "otel/opentelemetry-operator"
  	tag: "0.131.0"
	extraArgs:
  	- --enable-go-instrumentation=true
	collectorImage:
  	repository: "otel/opentelemetry-collector-contrib"
  	tag: "0.131.0"
	targetAllocatorImage:
  	repository: "otel/target-allocator"
  	tag: "0.131.0"
Small Node OOM
On 2GB nodes, collectors would OOM and hang entire nodes despite having memory_limiter. This is because graceful shutdown requires memory headroom that didn’t exist on 2GB nodes.
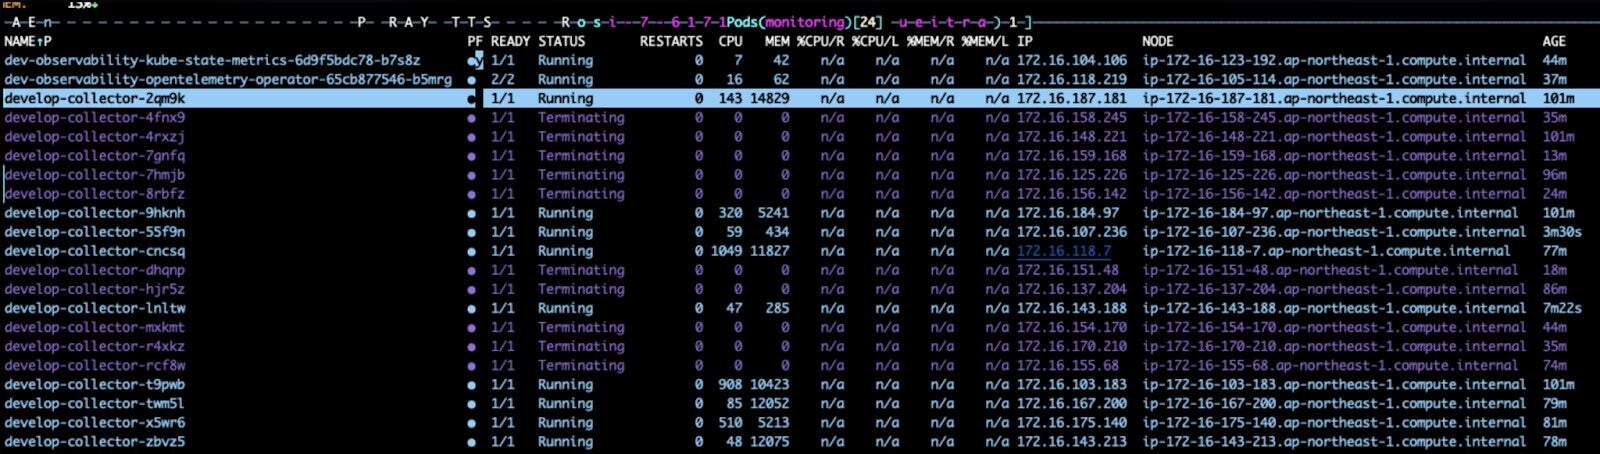
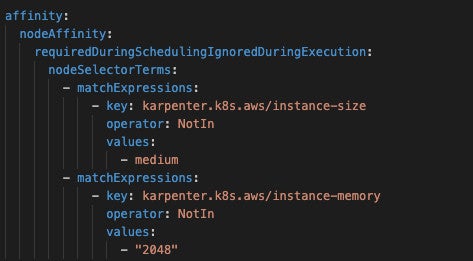
We realized you should only deploy collectors on nodes with at least 4GB of memory to ensure processing and shutdown headroom. We opted to use nodeAffinity to prevent deployment on undersized nodes:
Conclusion
When we started, there were few production references for running OTel Collectors at this scale. We relied heavily on the open-source community, and we hope this helps other teams on a similar path.