


Modern applications rarely live in a single place anymore. One organization’s application footprint was spread across AWS, Azure, and GCP, with some workloads still running on-prem. This multi-cloud approach gave them resilience and flexibility, but it came with a hidden cost: observability sprawl.
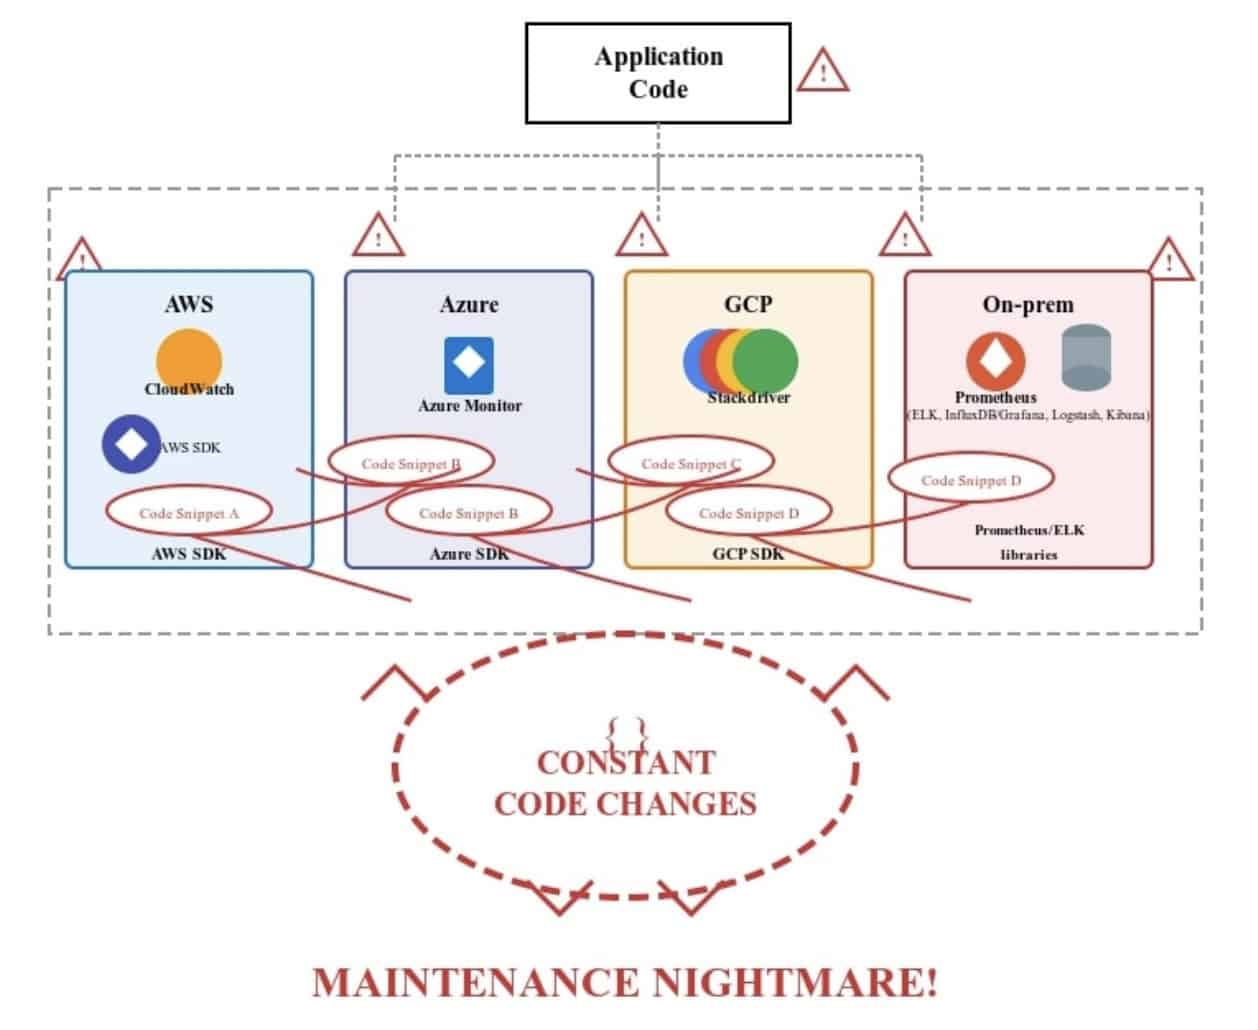
Each cloud provider brought its own native observability stack. On AWS, they used CloudWatch; on Azure, Azure Monitor; on GCP, Stackdriver; and in their on-prem setup, a mix of Prometheus and ELK. Add to that some third-party APM tools, and suddenly engineers were juggling five dashboards just to debug one request.
This was slowing them down. Mean Time to Resolution (MTTR) kept climbing, and developers spent more time stitching together logs and traces than writing code.
The turning point came when the organization adopted OpenTelemetry (OTel), a CNCF graduated project and community-driven standard for observability. What started as a small experiment soon became the backbone of their observability strategy, aligning with the broader trend across the CNCF community toward platform engineering maturity and standardized telemetry practices..
The problem: Observability tool sprawl
Let’s break down what was happening before OpenTelemetry:
- Multiple tools for the same purpose
- Metrics: Prometheus (on-prem) + CloudWatch (AWS) + Azure Monitor (Azure).
- Logs: ELK (on-prem) + Stackdriver (GCP).
- Traces: A commercial APM tool.
- Metrics: Prometheus (on-prem) + CloudWatch (AWS) + Azure Monitor (Azure).
- Lack of end-to-end visibility
A request starting in AWS Lambda, passing through an Azure-hosted API, and finally hitting a GCP database could not be traced seamlessly. Engineers saw fragments of the request but not the big picture. - Inconsistent instrumentation
Each tool required its own SDKs and agents. This meant extra developer effort and inconsistencies in the telemetry data. - Vendor lock-in
Switching tools or consolidating data required rewriting instrumentation—a huge blocker for modernization.
The result: fragmented visibility, longer outages, and frustrated engineers. This pattern mirrors what many CNCF end-user organizations have shared in TAG Observability discussions—growing complexity without a unified telemetry layer.
The turning point: Why OpenTelemetry
The organization needed a way to decouple instrumentation from backend tools. Enter OpenTelemetry.
OpenTelemetry is an open-source standard for collecting traces, metrics, and logs. As part of the CNCF ecosystem (alongside projects like Prometheus, Fluent Bit, and Jaeger) OTel provides:
- Language SDKs for most major languages (Java, Python, Go, Node.js, .NET, etc.).
- A Collector that receives telemetry, processes it, and exports it to any backend.
- Semantic conventions to standardize telemetry across services.
In other words: instrument once, export anywhere.
The solution: Implementing OpenTelemetry
The migration happened in three phases.
1. Instrumenting applications
The team started by adding OTel SDKs to a few critical microservices. These SDKs automatically captured traces, metrics, and logs with minimal code changes. For example, in Python:

This snippet shows how an application can start sending traces to the OTel Collector.
2. Deploying the OTel Collector
The OpenTelemetry Collector became the heart of the system. Instead of sending telemetry directly to each vendor’s tool, apps now sent everything to the Collector.
The Collector handled:
- Ingesting telemetry (via OTLP protocol).
- Processing (adding metadata, sampling, filtering).
Exporting (to Prometheus, Jaeger, Grafana, Datadog, etc.).
Example configuration:
receivers:
  otlp:
    protocols:
      grpc:
      http:

exporters:
  prometheus:
    endpoint: "0.0.0.0:9464"
  jaeger:
    endpoint: "jaeger:14250"
    tls:
      insecure: true

service:
  pipelines:
    traces:
      receivers: [otlp]
      exporters: [jaeger]
    metrics:
      receivers: [otlp]
      exporters: [prometheus]
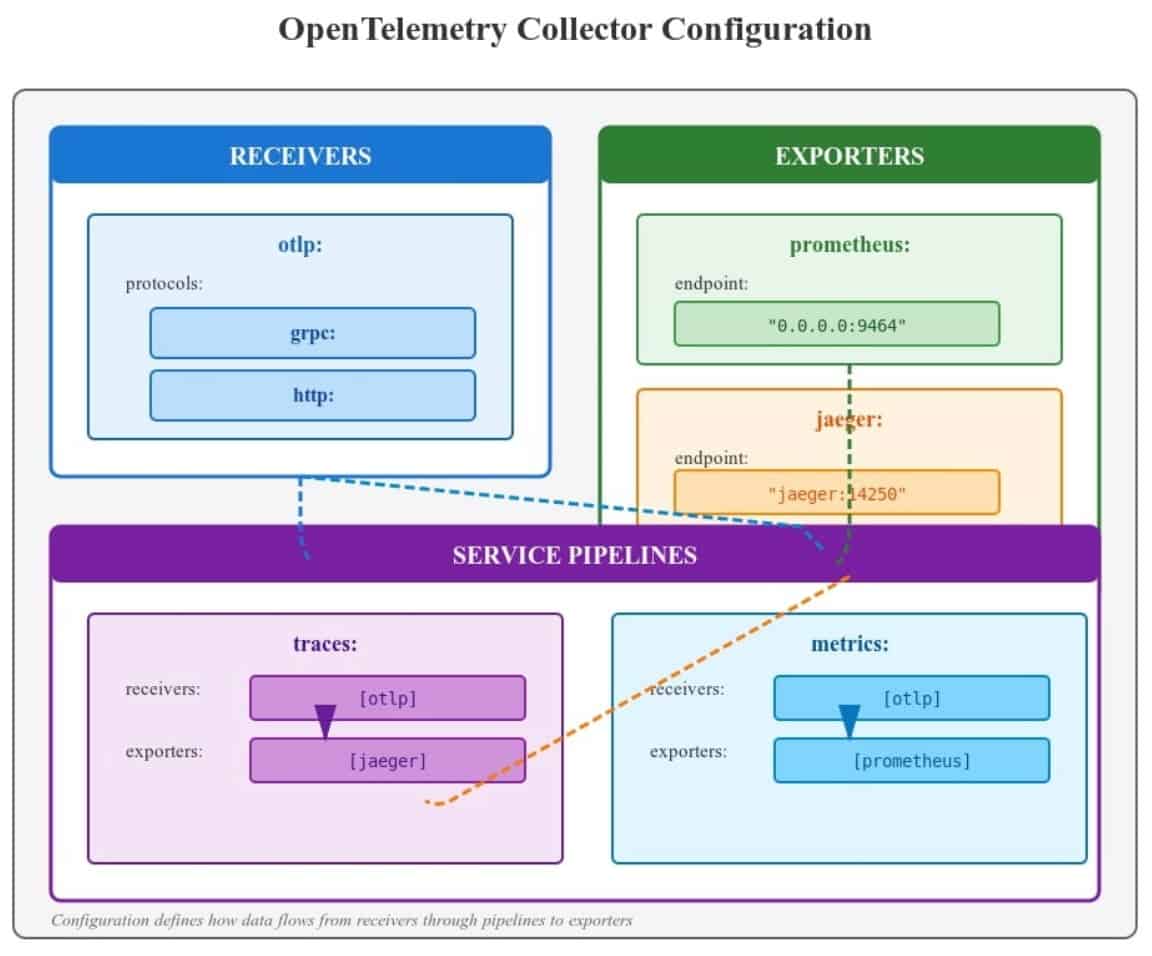
Now, apps didn’t care where the data went. The Collector handled routing.
3. Unified observability
With traces going into Jaeger and metrics into Prometheus, dashboards in Grafana became the single pane of glass.
Before (tool chaos):
AWS → CloudWatch
Azure → Azure Monitor
GCP → Stackdriver
On-prem → Prometheus + ELK
After (OTel-powered):
Apps → OTel SDK → OTel Collector → [ Jaeger | Prometheus | Grafana ]
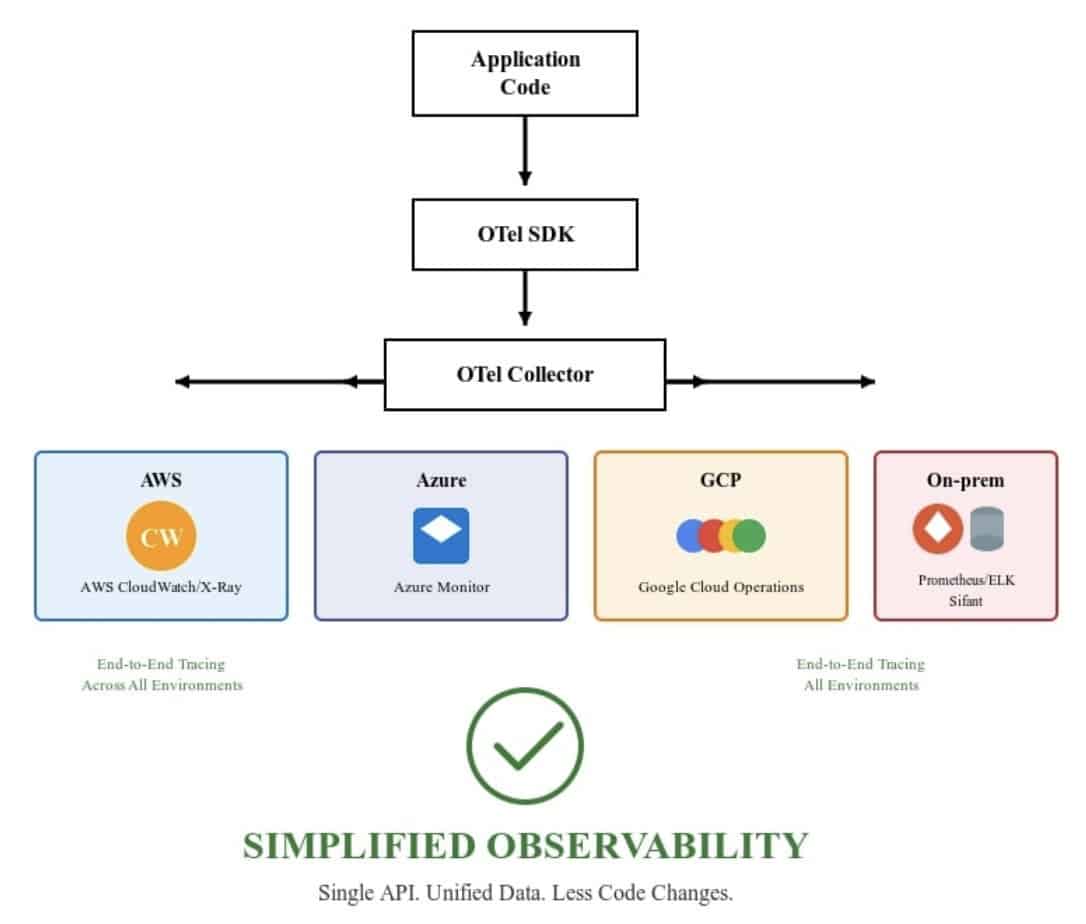
This was the “aha” moment. Engineers could now trace a request end-to-end, across AWS, Azure, and GCP, in a single view.
Benefits realized
The company saw immediate improvements:
- Unified observability → no more jumping between dashboards.
- Consistent data → telemetry looked the same regardless of cloud.
- Faster MTTR → engineers could trace failures across services.
- Flexibility → easy to switch from Jaeger to Datadog, or from Prometheus to CloudWatch, without touching application code.
- Cost optimization → eliminated redundant tools and vendor lock-in.
These outcomes reflect broader community findings around the value of open standards in multi-cloud environments.
Lessons learned
- Start small: Instrument one service first, then expand.
- Use the OTel Collector: Don’t send telemetry directly to vendors.
- Adopt semantic conventions: Consistent naming makes analysis easier.
- Involve developers early: Good observability requires dev buy-in.
Treat observability as part of your platform engineering strategy, not a one-off tooling decision.
Conclusion
OpenTelemetry proved to be more than just a new observability framework for the company—it became the unifying layer that tied together a fragmented, multi-cloud ecosystem. What once felt like chaos—navigating multiple dashboards, struggling to correlate logs with metrics, and losing requests across cloud boundaries—was transformed into a cohesive, cloud-agnostic observability strategy.
By adopting OpenTelemetry:
- Developers gained a single instrumentation standard that works across AWS, Azure, GCP, and on-prem systems.
- Operations teams unlocked true end-to-end tracing, making it possible to follow a request seamlessly, whether it starts in AWS Lambda, passes through Azure API Gateway, or ends in GCP Cloud SQL.
- Leadership saw reduced costs and vendor independence, with the freedom to choose (or switch) backends like Jaeger, Prometheus, Grafana, or Datadog without rewriting code.
- The organization as a whole shortened Mean Time to Resolution (MTTR), enabling faster incident response and greater confidence in production.
The biggest win? Flexibility and future-proofing. OpenTelemetry allowed the organization to embrace multi-cloud without being tied to each provider’s observability ecosystem. Their developers could focus on building features instead of wrestling with telemetry, and their SRE/DevOps teams finally had a unified view of the system.
If your organization is grappling with tool sprawl and fragmented visibility across clouds, the CNCF observability ecosystem—including OpenTelemetry— can help you take back control.
Infosys, as global digital services leader, demonstrates how OpenTelemetry can be harnessed to gain real-time insights, improve system performance, and enhance troubleshooting across complex, microservices-based environments. This approach ensures operational excellence, rapid issue detection, and seamless scalability in modern, cloud-native application. Start small, experiment with one service, and build from there. The payoff—a simplified, scalable, and vendor-neutral observability stack—is well worth the effort.
Instrument once. Observe anywhere. Own your observability journey.