


When people talk about cloud-native observability, the conversation usually revolves around applications, containers, and microservices. However, under those layers lies an equally critical foundation: The physical data center. Servers, storage systems, and networks ultimately host every workload, yet the telemetry these systems produce is often trapped in silos, separated from the cloud-native tools teams rely on daily.
This separation creates blind spots. It means operators can gain detailed insights into application behavior while knowing far less about the hardware underneath. When issues arise, that gap slows down troubleshooting and makes it harder to connect cause and effect across the stack. In short, the story of observability remains incomplete.
At KubeCon + CloudNativeCon North America 2025, Julia Furst Morgado, Principal Developer Relations Engineer at Dash0, and Pedro Célestin, Principal SRE at CLDF, will explore how to close this gap. Our session will show how open-source tools and standards can bring datacenter telemetry into the same pipelines that are already used for cloud-native systems, creating a unified view from hardware to applications.
The legacy divide
Most data centers today are still monitored through proprietary vendor platforms. These tools work well within their own ecosystems but rarely integrate cleanly with cloud-native observability stacks. The result is a patchwork of data silos that limit flexibility and obscure the relationships between infrastructure and workloads.
Infrastructure teams end up watching hardware dashboards while application teams focus on Kubernetes metrics, which are two sides of the same story, told in different languages. Without shared context, organizations struggle to identify root causes, optimize performance end-to-end, and apply predictive analytics that depend on correlated data.
An open approach
The framework we’ll discuss replaces this fragmentation with an open, vendor-neutral pipeline. At the center is the OpenTelemetry Collector, which standardizes diverse signals into a consistent format. Hardware data is gathered through established protocols like SNMP and Redfish and uses exporters and collectors that feed into the broader observability flow. From there, metrics land in Prometheus for time-series analysis, logs are indexed in OpenSearch, and dashboards are built with tools like Perses or Grafana OSS. The result is a shared environment where both application and infrastructure telemetry coexist, enabling correlation and analysis that were previously out of reach.
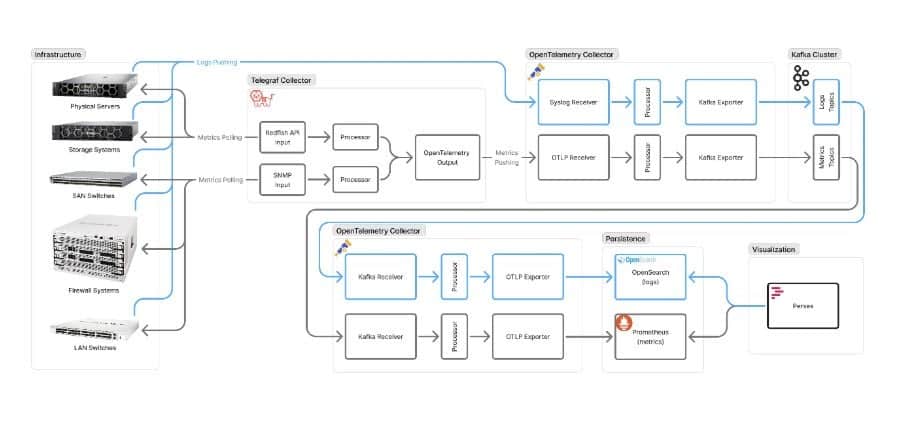
This pipeline can scale and adapt. For smaller environments, a direct path from collectors to storage is often enough. Larger deployments benefit from buffering with Kafka for resilience and smoothing out peaks. Where long-term retention is critical, Flink can stream logs into Parquet files stored in object storage, keeping costs manageable while ensuring auditability.
Why this matters now
There’s a growing shift across the industry toward open, vendor-agnostic observability. Hardware providers are adding native support for OpenTelemetry, one of the most active projects in the CNCF, now embraced by enterprises and governments alike. Initiatives such as the NeoNephos Foundation highlight how observability, sovereignty, and open-source principles are converging.
The impact is profound. A networking anomaly in a datacenter can now be correlated with latency in a Kubernetes service. A storage fault can be tied directly to application error rates. By bringing these views together, teams respond faster, reduce downtime, and make smarter resource decisions.
CLDF: From theory to practice
At the Câmara Legislativa do Distrito Federal (CLDF), the legislative chamber of Brazil’s Federal District, this open framework has already moved from concept to production. CLDF serves as the local parliament, responsible for regional laws and oversight, and it depends on digital services that must remain reliable and secure.
By applying CNCF-aligned open-source tools, CLDF unified observability across its datacenter and cloud-native systems, breaking down the silos between hardware monitoring and application signals. This shift accelerated troubleshooting and ensured the institution maintained full ownership of its observability data, which is a critical requirement for public trust.
The bigger picture
Ultimately, this isn’t just about technology, it’s about control and clarity. Open observability pipelines let organizations own their telemetry, stay agile, and align analytics strategies with their unique priorities. They also tap into the collective innovation of the open-source community, which continues to push the boundaries of what’s possible in modern observability, at a pace no single vendor could match.
Treating the datacenter as part of the observability fabric moves the conversation beyond tools toward a more complete understanding of how digital systems behave and evolve.
Join us at KubeCon + CloudNativeCon North America 2025!
For more information on this topic, please stop by our KubeCon + CloudNativeCon session! We’ll dive deeper into this framework, share architectural patterns, and discuss real-world implications.
Integrating data center observability into cloud native environment
- Tuesday, Nov. 11, 2025
- 5 p.m. – 5:30 p.m. EST
Speakers:
Julia Furst Morgado, Principal Developer Relations Engineer, Dash0
Pedro Célestin, Principal SRE, CLDF