
Kubernetes’ native audit logs are essential for tracking control plane activities, but they fail to capture what happens inside a container or on the host node itself during kubectl debugging sessions. This creates a security and compliance gap, as malicious or unauthorized actions within a pod or on the node go unrecorded. Without this visibility, it’s impossible to fully understand user actions, conduct an incident investigation, or meet regulatory compliance requirements. The newly added audit logging feature in Security-Profiles-Operator (SPO) addresses this by enabling detailed, server-side logging of user activity at the node level.
Let’s imagine a scenario: A team of engineers is responsible for maintaining an application that processes financial transactions. The application is deployed on Kubernetes, with various containers (in pods) running different workloads. When a customer reports a bug, an engineer is granted access to the pod via kubectl exec to debug the issue (also kubectl debug node). However, during the session, they accidentally delete/modify a crucial configuration file. The application fails, leading to financial losses and business disruption.
During a post-incident audit, the security team can see from the Kubernetes control plane logs that the engineer initiated a kubectl exec session. But the logs don’t reveal what commands were run inside the container. It’s an operational black box. The engineer could have accidentally deleted the file, or a malicious actor could have used their credentials to intentionally cause harm. Since client-side logging can be easily manipulated or faked, it’s not a reliable solution. This is where the audit logging feature of SPO comes in. It provides the crucial, unalterable record of actions taken inside the container, closing this critical security gap.
Other scenarios include tracking the syscalls made by the containers themselves, the processes/executables invoked by container images when deployed on kubernetes.
How the audit logging feature in SPO works
The Security-Profiles-Operator (SPO) provides a new JSON audit logging feature that generates detailed, structured logs of user activity. Similar to how Kubernetes records its own API server audit logs, this feature generates logs in a JSON Lines format, making them easy to parse and analyze. This process provides a powerful, server-side solution for granularly logging user activity, effectively closing the node-level security gap.
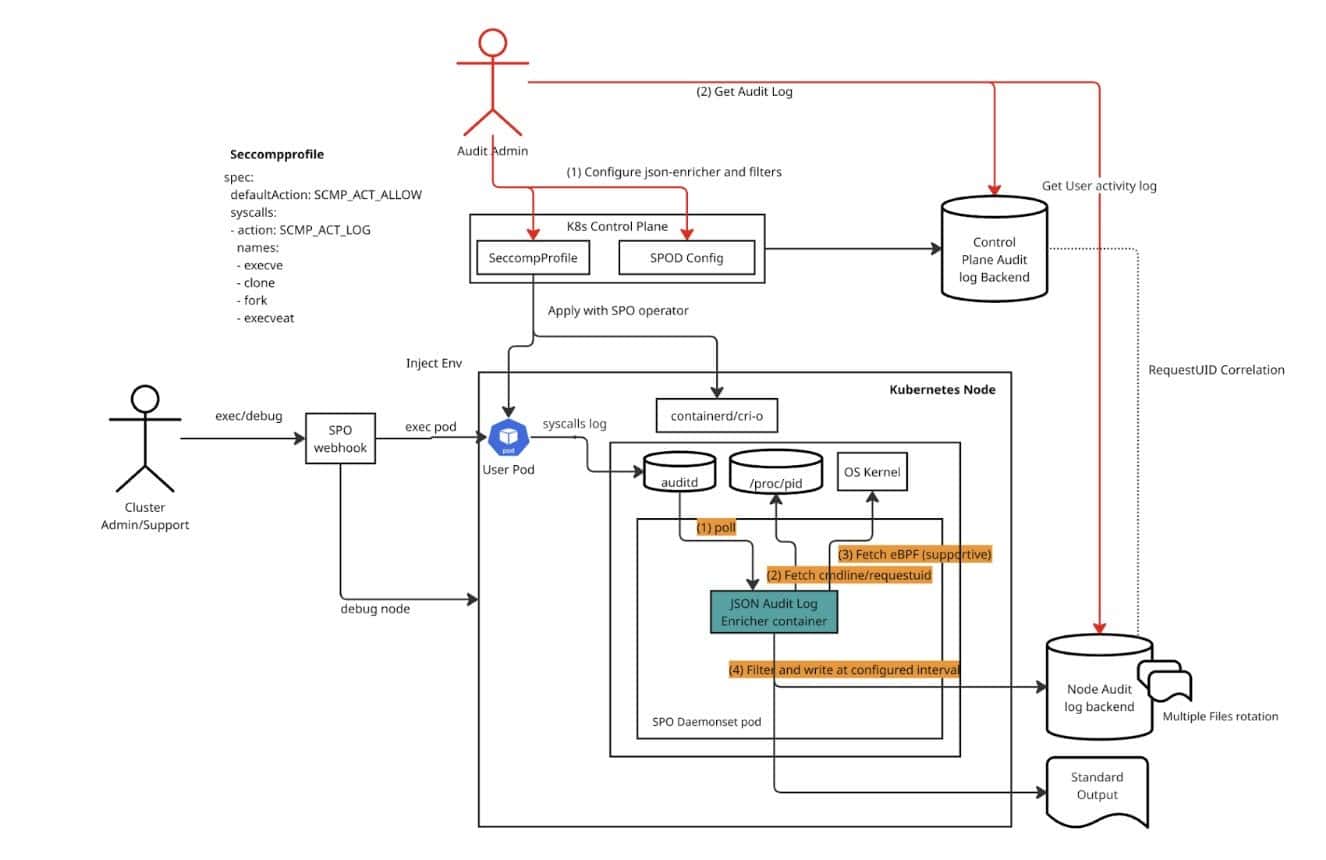
SPO enables easier distribution of seccomp profiles to the Kubernetes nodes. Here the main source of information is the audit log generated by configuring seccomp profiles to log (not restrict) process creations. When an auditor configures both Kubernetes control plane and SPO audit logging, the json-audit-log enricher container starts within the SPO DaemonSet. This container watches for logs in the host’s audit log (/var/log/audit/audit.log). For each log statement, it fetches command-line/environment information from /proc/<pid> and, optionally, from eBPF. It then filters the log based on your configuration and sends the output to either a file or standard output.
By default, kubectl exec doesn’t pass user authentication (user) details into the exec session on the container, making it hard to audit user-specific actions. The audit logger in SPO addresses this with mutating webhooks that inject the request UID from the Kubernetes API server as an environment variable into the session. Every request to the API server including the request to start a new exec session contains a request UID. This request ID is then logged by SPO’s audit log enricher and can be used to correlate the activity with the API server’s audit logs (annotations), providing a complete trail of who did what.
This feature introduces advanced log filtering through an array of filter rules. These rules, defined on the SPOD resource, allow users to control which log statements are emitted (“Metadata”) and which are dropped (“None”). Rules are evaluated in ascending order of their priority, and the first matching rule determines the action. A rule is a match if all specified matchKeys are present in the log statement. If matchValues are also provided, at least one of the values must match. This system provides granular control, ensuring only relevant security events are logged, and a default behavior of logging is applied if no rules match. When auditing user actions, the filters are configured to log only those that contain the requested UID.
Each log line includes critical information about an event: Timestamp, Executable Name, Command Line Arguments, User and Group IDs, and System Calls (syscalls). This granular logging is particularly useful for:
- Seeing what users and automated processes are doing inside a pod.
- Tracking when someone uses commands like kubectl exec to run commands or scripts within a container.
- Monitoring activities in debug containers where users might run various tools.
How to enable it
To enable this auditing with SPO, you first install cert-manager (optional in some environments) and the SPO itself. Next, you configure the operator to store its logs locally on the host, external volume or output to standard output. You then enable the JSON Enricher and specify a set of filters to only log user activity. Finally, you create a SeccompProfile to log specific syscalls like execve and clone, and a ProfileBinding to automatically apply this profile to pods in a target namespace.
Detailed instructions are available in the user guide and the documentation.
Considerations while using privileged containers
When using kubectl debug for node debugging, a privileged pod may be created for host file system access, which can introduce differences in behavior based on the container runtime. For the CRI-O runtime, a specific feature is needed to apply a seccomp profile to a privileged container.
With CRI-O versions 1.33 and newer, a feature was introduced to “allow seccomp profiles for privileged containers.” This allows you to apply the secomp profile we created to the cri-o configuration. The key is to configure the CRI-O runtime to use the profile by passing an additional flag.
To do this, you must add the flag –privileged-seccomp-profile to the CRI-O runtime configuration. This step ensures that even privileged debugging pods are subject to the secomp profile’s logging, maintaining complete audit coverage.
Performance considerations
It’s important to acknowledge the performance implications of using seccomp profiles for extensive logging. The SPO is designed to minimize this impact by primarily logging only process creations and handling them asynchronously. This approach helps prevent logging from becoming a bottleneck on your nodes.
The feature uses eBPF as a supplemental data source. While it’s possible for eBPF to be used as a primary data source for this type of logging, that functionality isn’t currently a configurable feature within the operator. For most use cases, the default asynchronous, process-creation-focused logging approach provides an excellent balance between security visibility and cluster performance.
Conclusion
By leveraging the Security-Profiles-Operator, you can overcome the limitations of standard Kubernetes audit logs and gain complete visibility into user actions within your pods and on the host nodes. This solution is a powerful and necessary tool for any organization that requires comprehensive security monitoring, threat detection, and compliance for its containerized environments.