Project post originally published on the Linkerd blog by Flynn.
Many, many pixels have been burned on the topic of sidecars of late.
If you’ve been paying any attention at all to the cloud-native ecosystem, you’ve doubtless run across discussions about the merits – or lack thereof – of sidecars. In a lot of ways, this is kind of silly: sidecars are a fairly low-level implementation pattern, and it would probably make sense to see them considered an implementation detail rather than the latest hot marketing topic. In other ways, though, we live in an imperfect world and we often do have to pull back the curtains to take a look at the technology underneath the tools we use: understanding the tradeoffs made by our tool choices is often critical to getting the most out of those tools, and architectural decisions are always about tradeoffs.
For various reasons, I ended up being the one to take on the job of pulling back the curtain on both Linkerd’s choice to use the sidecar pattern and Istio Ambient’s choice to avoid it, and look into the ramifications of those choices. I did this in the obvious way: I ran both meshes under load and measured things about them. It was simultaneously frustrating and fascinating, often in surprising ways.
The Disclaimers
Benchmarking two systems like this is as much an art as it is a science:
- the way the benchmark tests are designed will itself affect the outcomes you measure in the benchmarks;
- the way the tests are actually run can introduce bias;
- there are a million different invisible underlying variables that can affect your results; and
- no matter what you do, there will be people convinced that you’re trying to make their favorite system look bad!
So while this post will talk about analysis and results, the main goal here is transparency: what tests I ran and why, how I set them up, how I measured the results, etc. You may well disagree with my methodology or conclusion, which is fine and we can discuss it, but it’s much better for us to go into that discussion with good information.
Reproducing My Results
If you want to run this test for yourself – and I encourage you to do so! – you’ll find all the source code and some of my data at the Great Sidecar Debate repository on GitHub. Check out its README for more detailed instructions on how to run everything, and check out the linkerd, istio, and ambient scripts to find out exactly how I installed Linkerd, Istio Legacy, and Istio Ambient, respectively.
The Test
At a high level, the test I went with is really simple: I ran the Faces demo app and used a load generator to hit its face workload (which is the top of its call graph). I then used the Kubernetes metrics API to measure CPU and memory usage for all the pods in the cluster.
Even this simple test setup involved several decisions.
- I chose to focus on resource consumption rather than latency.Getting good results for resource consumption from a cluster running on (probably virtualized) nodes from a cloud provider is relatively straightforward, but getting really solid results for latency in that same kind of environment is a bit of a different story, so I focused on resource consumption. Obviously, latency is important! and I’d like to return to it later. For the moment, though, others have already done some work in this area, and frankly my experience is that the modern meshes are all fast enough that latency problems tend not to be the mesh.The load generators I used do report latency, and my tooling will graph it, but it wasn’t my focus and I didn’t spend a lot of time making sure that the latency graphing is correct.
- I chose to focus on the data plane rather than the control plane.The data plane is the part of the mesh that’s in the critical path all the time, and the part that has to scale with application usage. This doesn’t mean that the control plane is irrelevant, just that the data plane is more likely to be an earlier bottleneck.
- I chose to use the Kubernetes metrics API to measure resource consumption.I wanted to be testing the meshes themselves, so I wanted to minimize the moving parts that weren’t the meshes. Using the Kubernetes metrics machinery meant that I didn’t have to run additional monitoring software like a Prometheus instance.It also means that I was making Kubernetes API calls every 10 seconds or so throughout the test, but I decided that that shouldn’t be a significant load.
- I chose to run the load generator in the cluster, with data collection and analysis on my local machine.Putting the load generator in the cluster let me avoid running an ingress controller, and meant that I didn’t have to rely on the network outside the cluster for much. Pulling all the data back to my laptop and running the analysis there made it very easy to save data, and made it easy to analyze one run while another was in progress.
- I chose to run multiple nodes and multiple replicas of the test workloads.I wanted to test production-like installations, which for Linkerd means using HA mode, which requires at least three nodes so that it can run three replicas of all control-plane components. To compare apples to apples, I arranged for all three meshes to run three replicas of their control-plane components.I also chose to run the test workloads with three replicas each, since there’s not much point in running a non-HA application on an HA cluster! This has the side effect of making Linkerd and Istio Legacy run three times as many sidecars as they otherwise would, which actually gives Istio Ambient something of an unfair advantage. I decided to run with it, though, since I didn’t particularly want to be easy on Linkerd in this test.
- I chose to always configure Istio Ambient to use waypoints, and to run three replicas of the waypoint.In addition to testing similar configurations, I wanted to test similar functionality. Linkerd and Istio Legacy both always include important Layer 7 functionality, but Istio Ambient without waypoints can’t do anything at Layer 7, so I decided to always run Istio Ambient with waypoints. (I didn’t actually configure any Layer 7 functionality in the tests I ran, though. This is another area I’d like to return to.)I chose to run three replicas of the waypoint for the same reason I ran three replicas of the control plane: the waypoint is a single point of failure otherwise.
- I chose to run the tests on GKE.I needed a cloud provider to make it feasible for others to reproduce my results, and I unfortunately couldn’t get Istio Ambient to run on a Civo cluster. It was easier for me, personally, to run on GKE than on Azure or Amazon, so I went with GKE. It would be lovely to figure out how to run Istio Ambient on Civo, though.
The Analysis
I collected CPU and memory usage data for all the pods in the cluster every 10 seconds, then computed averages for the mesh data plane and fit a quadratic curve to the averages.
This was harder than it sounds, because the Kubernetes metrics API is fairly low-resolution, and because I didn’t want to tear down the cluster and reinstall every time: installing everything is pretty quick, but GKE is awfully slow to spin up clusters! This means that a given usage metric tends to look like this:
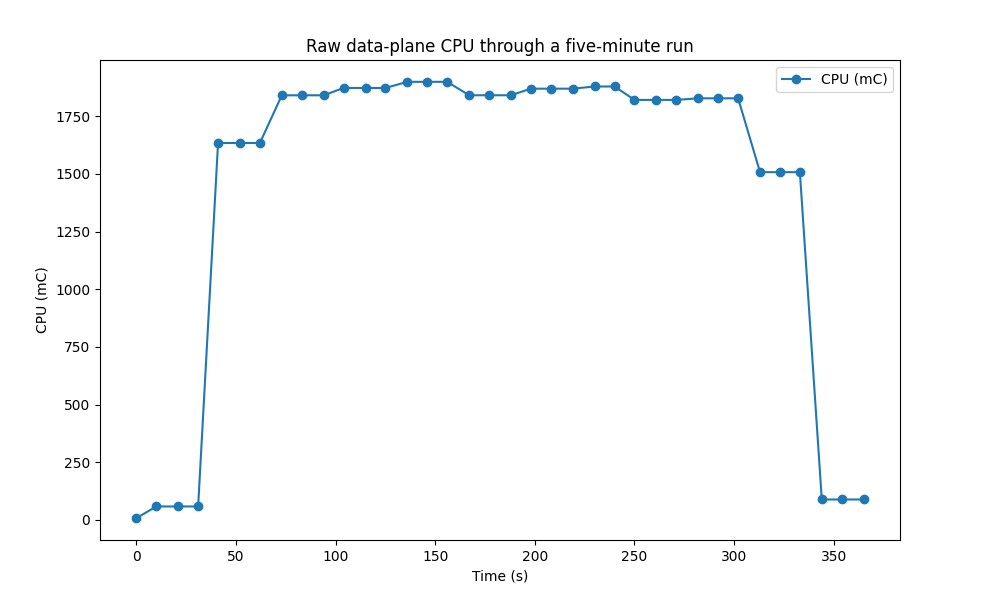
You can see that the usage starts very low and ends very low. What’s going on here is that the metrics API lags the real world:
- On the left, the load generator has started, but the metrics API hasn’t yet sampled the usage under higher load.
- On the right, the load generator has stopped, but the metrics API hasn’t yet sampled the usage under the absence of load.
Including all of these data would make the analysis much less useful. We really want the steady-state usage across the top of the graph; to get it, we filter in two passes.
First, we can see that the average of the first graph is pulled far down by the samples at the start and finish of the run:
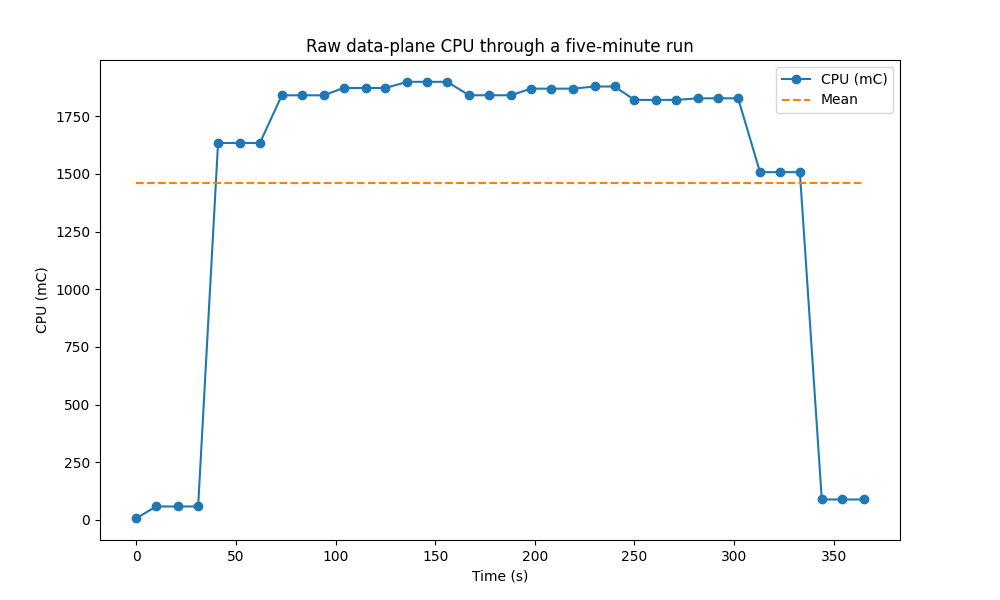
So for the first pass, we just drop any samples below the mean:
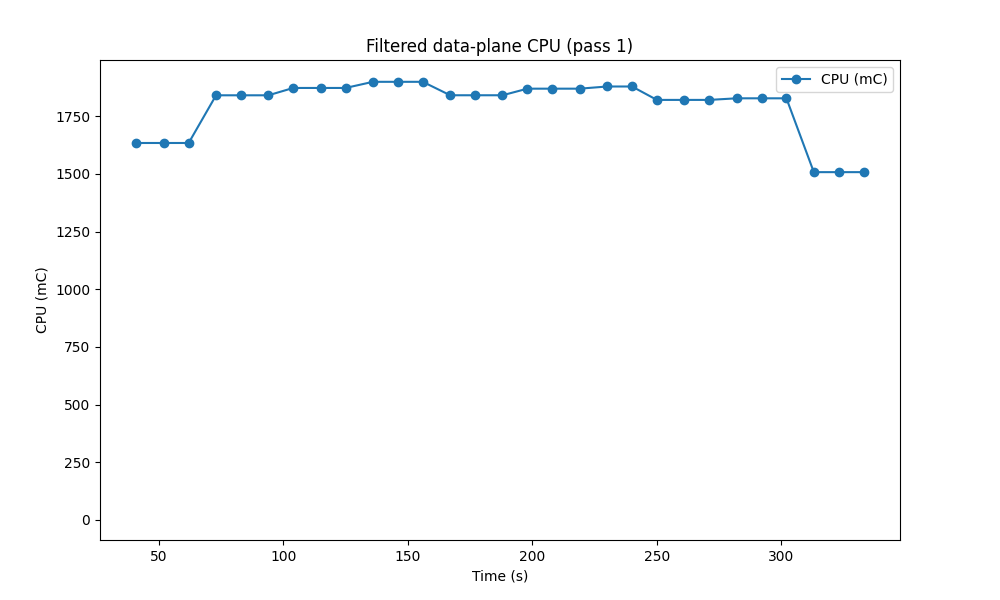
(There’s a safeguard in the code to make sure that, if we somehow missed the outliers at the ends, we don’t just drop all the data.) For pass two, we look at the standard deviation of remaining samples:
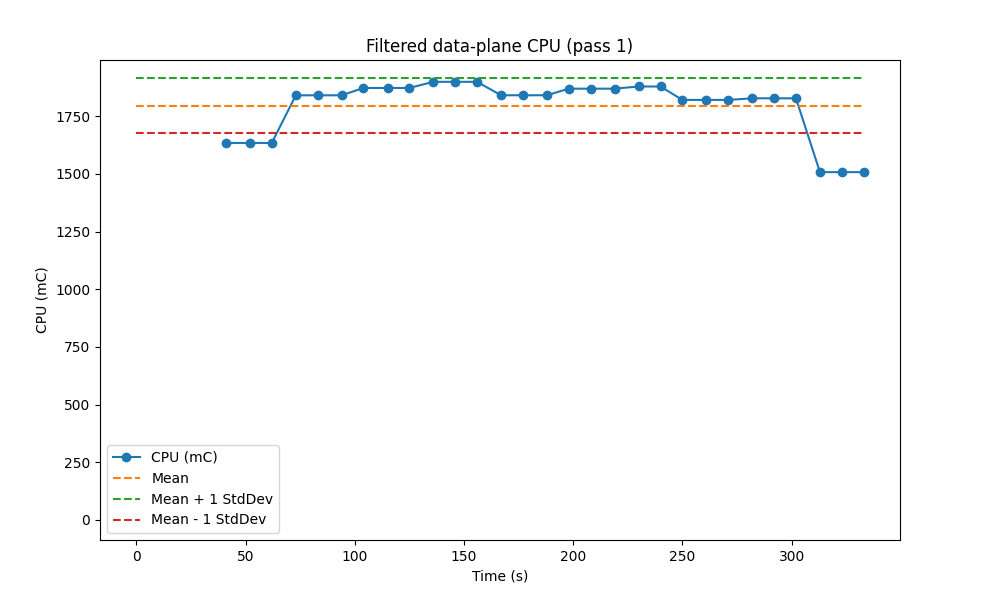
and we drop samples more than one standard deviation from the mean:
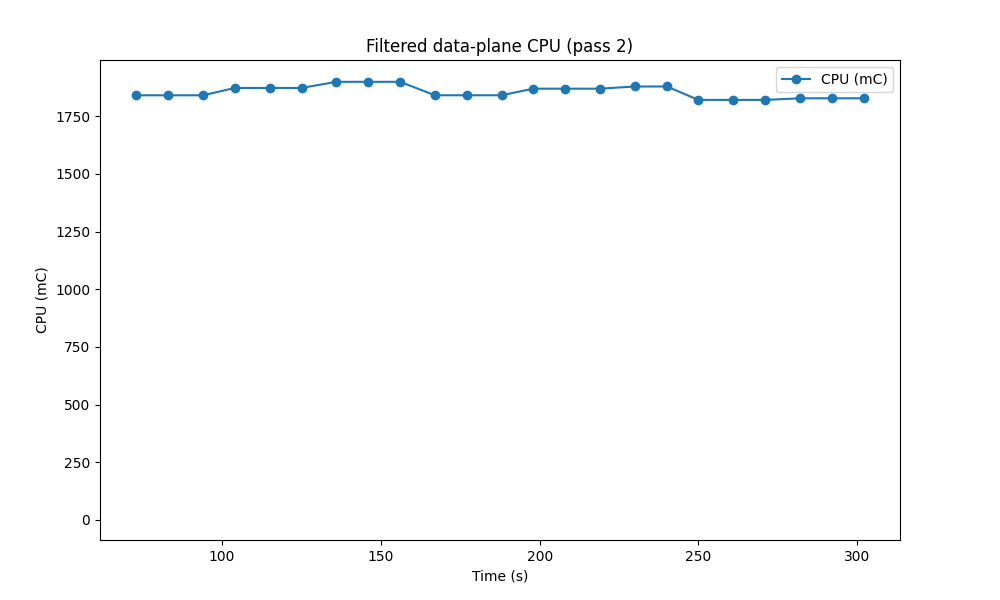
This gives us a much cleaner set of data to work with. Obviously this filtering is highly opinionated! My reasoning here is that the ramp-up and ramp-down periods are likely to mess things up more than anything else, and that in the steady state, we should expect the data on resource usage to be fairly stable.
The Results
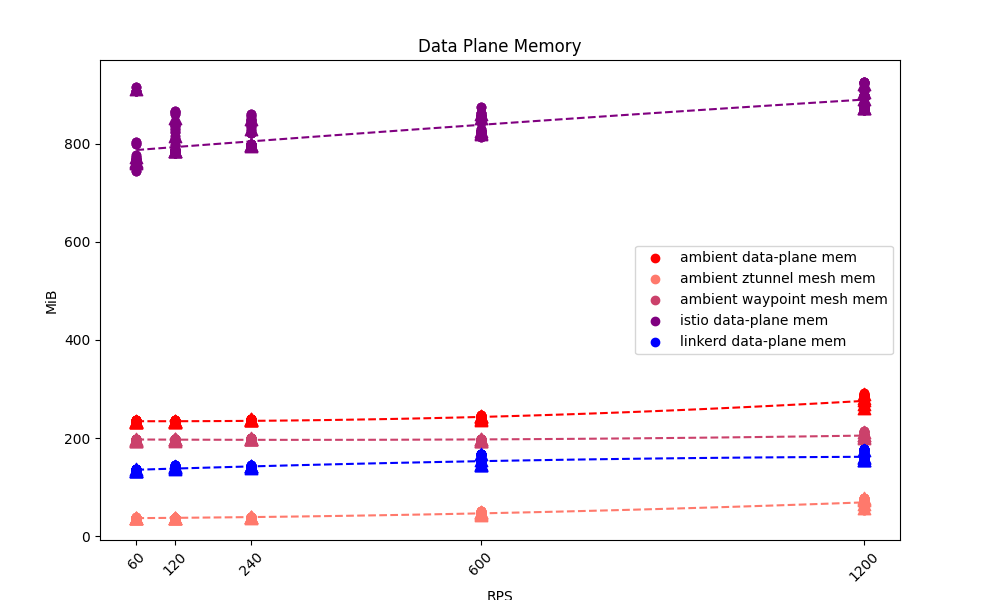
When I ran the basic benchmarks I described against Linkerd, Istio Legacy, and Istio Ambient, I was not at all surprised to find that Istio Legacy used more memory by far than either Linkerd or Istio Ambient:
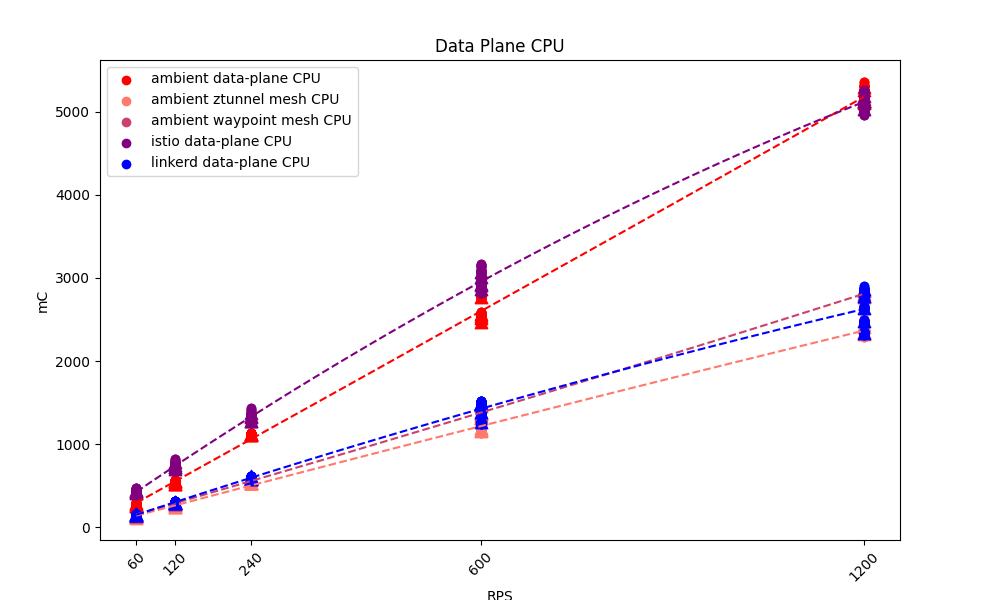
I was extremely surprised to find how close Istio Ambient and Istio Legacy were on CPU usage:
(If you work on Istio, I would love to hear thoughts about this – I’m honestly wondering if I somehow misconfigured Istio Legacy here.)
Zooming in on Linkerd and Istio Ambient, we can see that Linkerd still used less resource for its data plane than Istio Ambient:
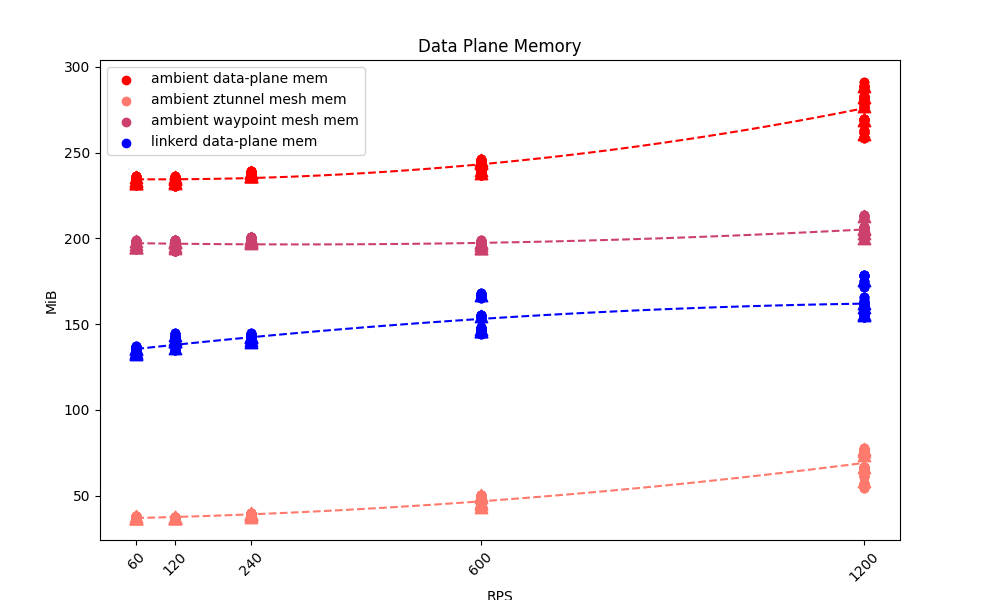
You can see that ztunnel has the least memory usage of any of the data-plane components, but it’s important to remember that ztunnel is limited to Layer 4 – it’s not doing all the hard work that Layer 7 requires. Layer 7 needs the waypoint, too, and once we include that in the mix, we see that Istio Ambient consumes significantly more memory than Linkerd (which is doing both jobs in one proxy).
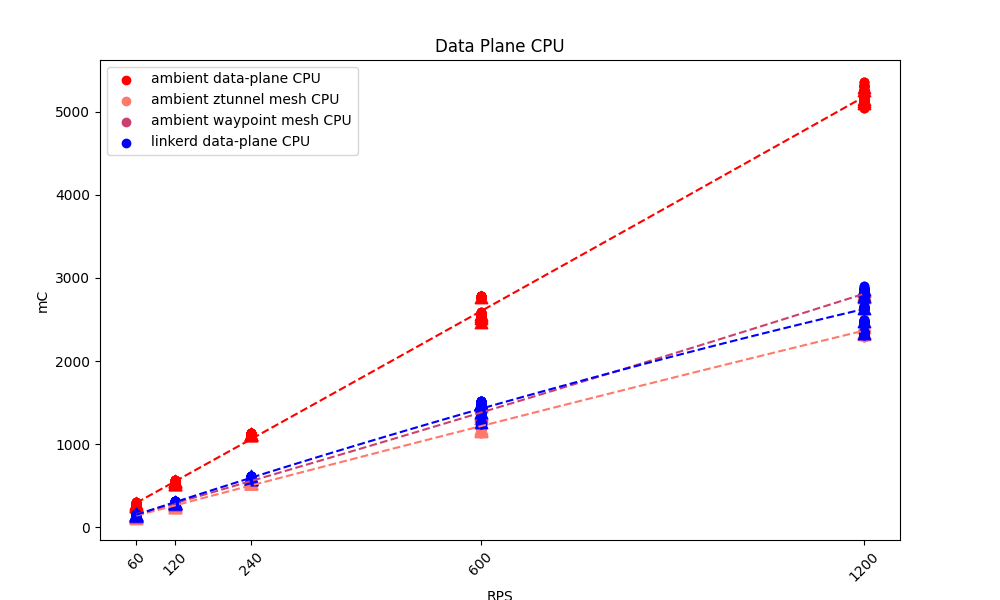
Interestingly enough, ztunnel’s CPU usage was not significantly below Linkerd’s. In fact, both ztunnel and the waypoint used nearly as much CPU usage as Linkerd, meaning that Istio Ambient as a whole nearly doubled Linkerd’s CPU usage.
Other Tests
I also ran a few other simple tests from the operational point of view. This is probably the most biased section of this post, so let me talk about that head-on: from the point that I first looked at Istio Ambient, I’ve worried that if anything went wrong with the ztunnel or waypoint, the set of pods that would be affected would be larger and less deterministic than the set of pods affected if something went wrong with a Linkerd proxy. For me, that’s an operational issue that the architecture of the mesh can affect: if the blast radius of a failing data-plane component is small, it’s likely to be easier to figure out what’s up and fix it than if the blast radius is large.
So yes, there are absolutely ways to make Linkerd’s proxies fail, and in fact the things I’m about to describe will make a Linkerd proxy very unhappy if you do them to it! However, when you do that, you’ll be affecting exactly one pod: that’s the difference I want to highlight here.
First I verified my impression that if a ztunnel or waypoint runs out of memory or dies, an effectively-random set of pods will be unable to communicate with each other. I feel like this would be very strange to debug when it happens, but I have to say that I was very impressed with how quickly Istio Ambient can restart either of these components when they die! (I did this both by using kubectl delete and by cranking memory limits down artificially.)
I also verified that if the ztunnel or waypoint hits a CPU limit, then an effectively-random set of pods will either see communications slow down or fail entirely. Here, of course, Kubernetes won’t restart the slow component; that’s not how CPU limits work. (I did this by artificially applying CPU limits.)
Finally, I verified that I could starve the Faces demo by running a ton of traffic from something else through the system. (Specifically, I ran iperf3 in the cluster with CPU limits lowered on the Istio Ambient data plane and watched Faces stop responding. Incidentally, I also found that iperf3 is a great way to make Istio Ambient’s waypoint consume dramatically more memory, and to hang onto that memory for a long time after you stop running iperf3. I don’t know why that happens.)
Again: Linkerd proxies won’t like these things either. I’d also be remiss if I didn’t point out that Istio Ambient’s normal requests and limits are high enough that you’re more likely to hit trouble running Istio Ambient on small nodes than you are to hit the limits.
Conclusion
Looking at the difference between Istio Legacy and Istio Ambient, it’s much more clear to me why the Istio crowd is excited about Ambient: the numbers on memory usage, in particular, are honestly shocking even if you know what to expect.
On the other hand, when you look at Linkerd and Istio Ambient, what I see is higher resource usage and more complexity for Istio Ambient, so I have a hard time recommending it over Linkerd. There are definitely interesting things about the Ambient architecture, and it was fascinating to dig into it a bit… but overall, I still feel that the tradeoffs that Linkerd has made are easier for me to get behind.
Of course, you may have other thoughts! if so, you can reach me as @flynn on the Linkerd Slack or by email at flynn@buoyant.io.
Linkerd is for everyone
Linkerd is a graduated project of the Cloud Native Computing Foundation. Linkerd is committed to open governance. If you have feature requests, questions, or comments, we’d love to have you join our rapidly-growing community! Linkerd is hosted on GitHub, and we have a thriving community on Slack, Twitter, and in mailing lists. Come and join the fun!