
Member post originally published on Greptime’s blog by Tison
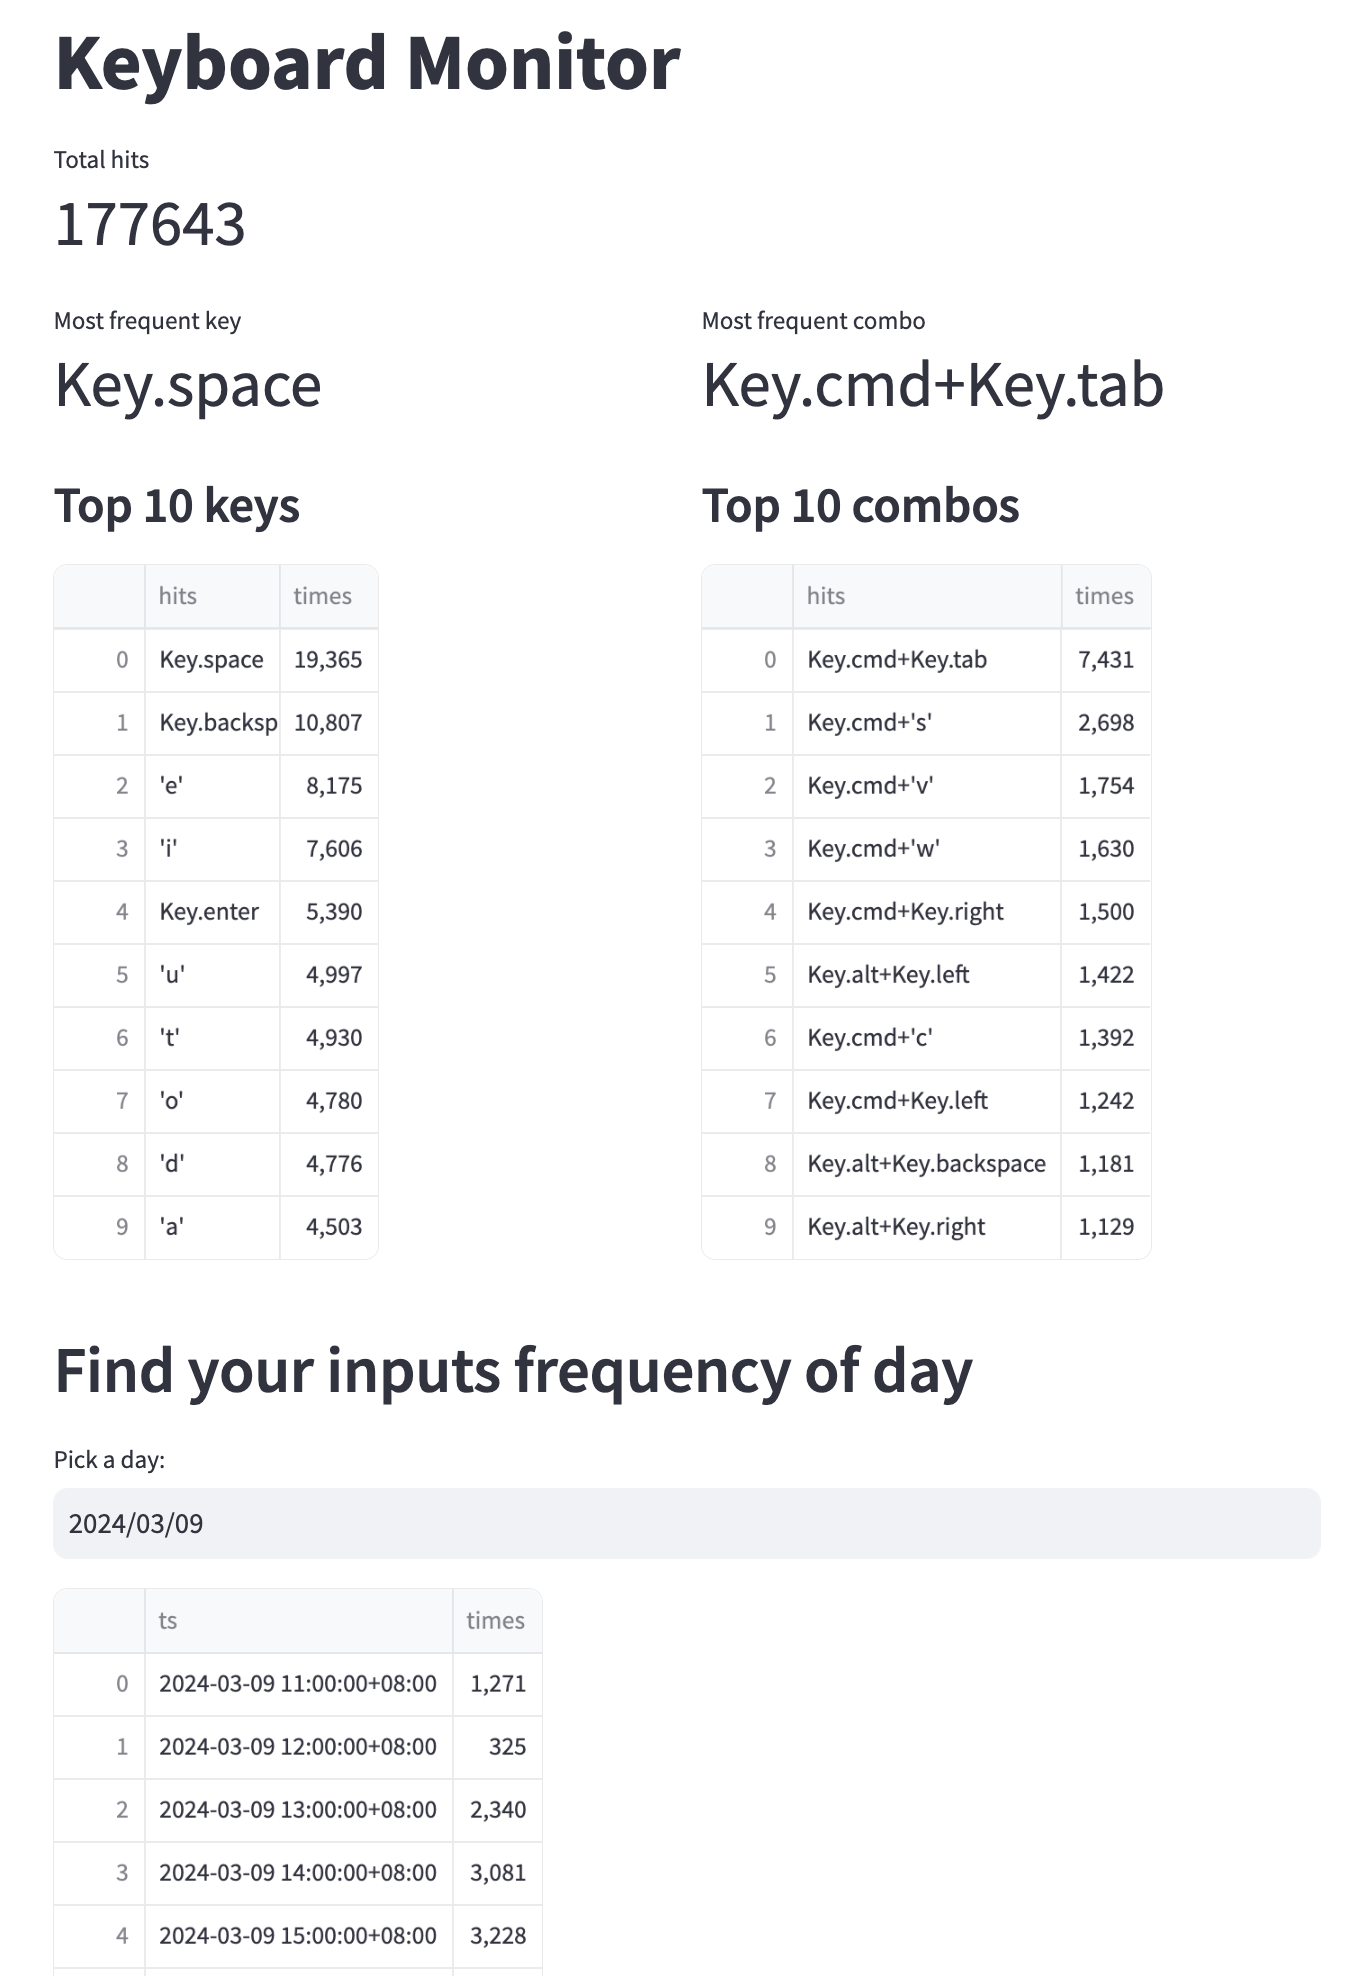
Nowadays, typing is a nearly daily occurrence for most people. Interestingly, your typing habits may vary significantly from what you might assume. Below, you’ll find a dashboard that provides a visualization of my own typing tendencies.
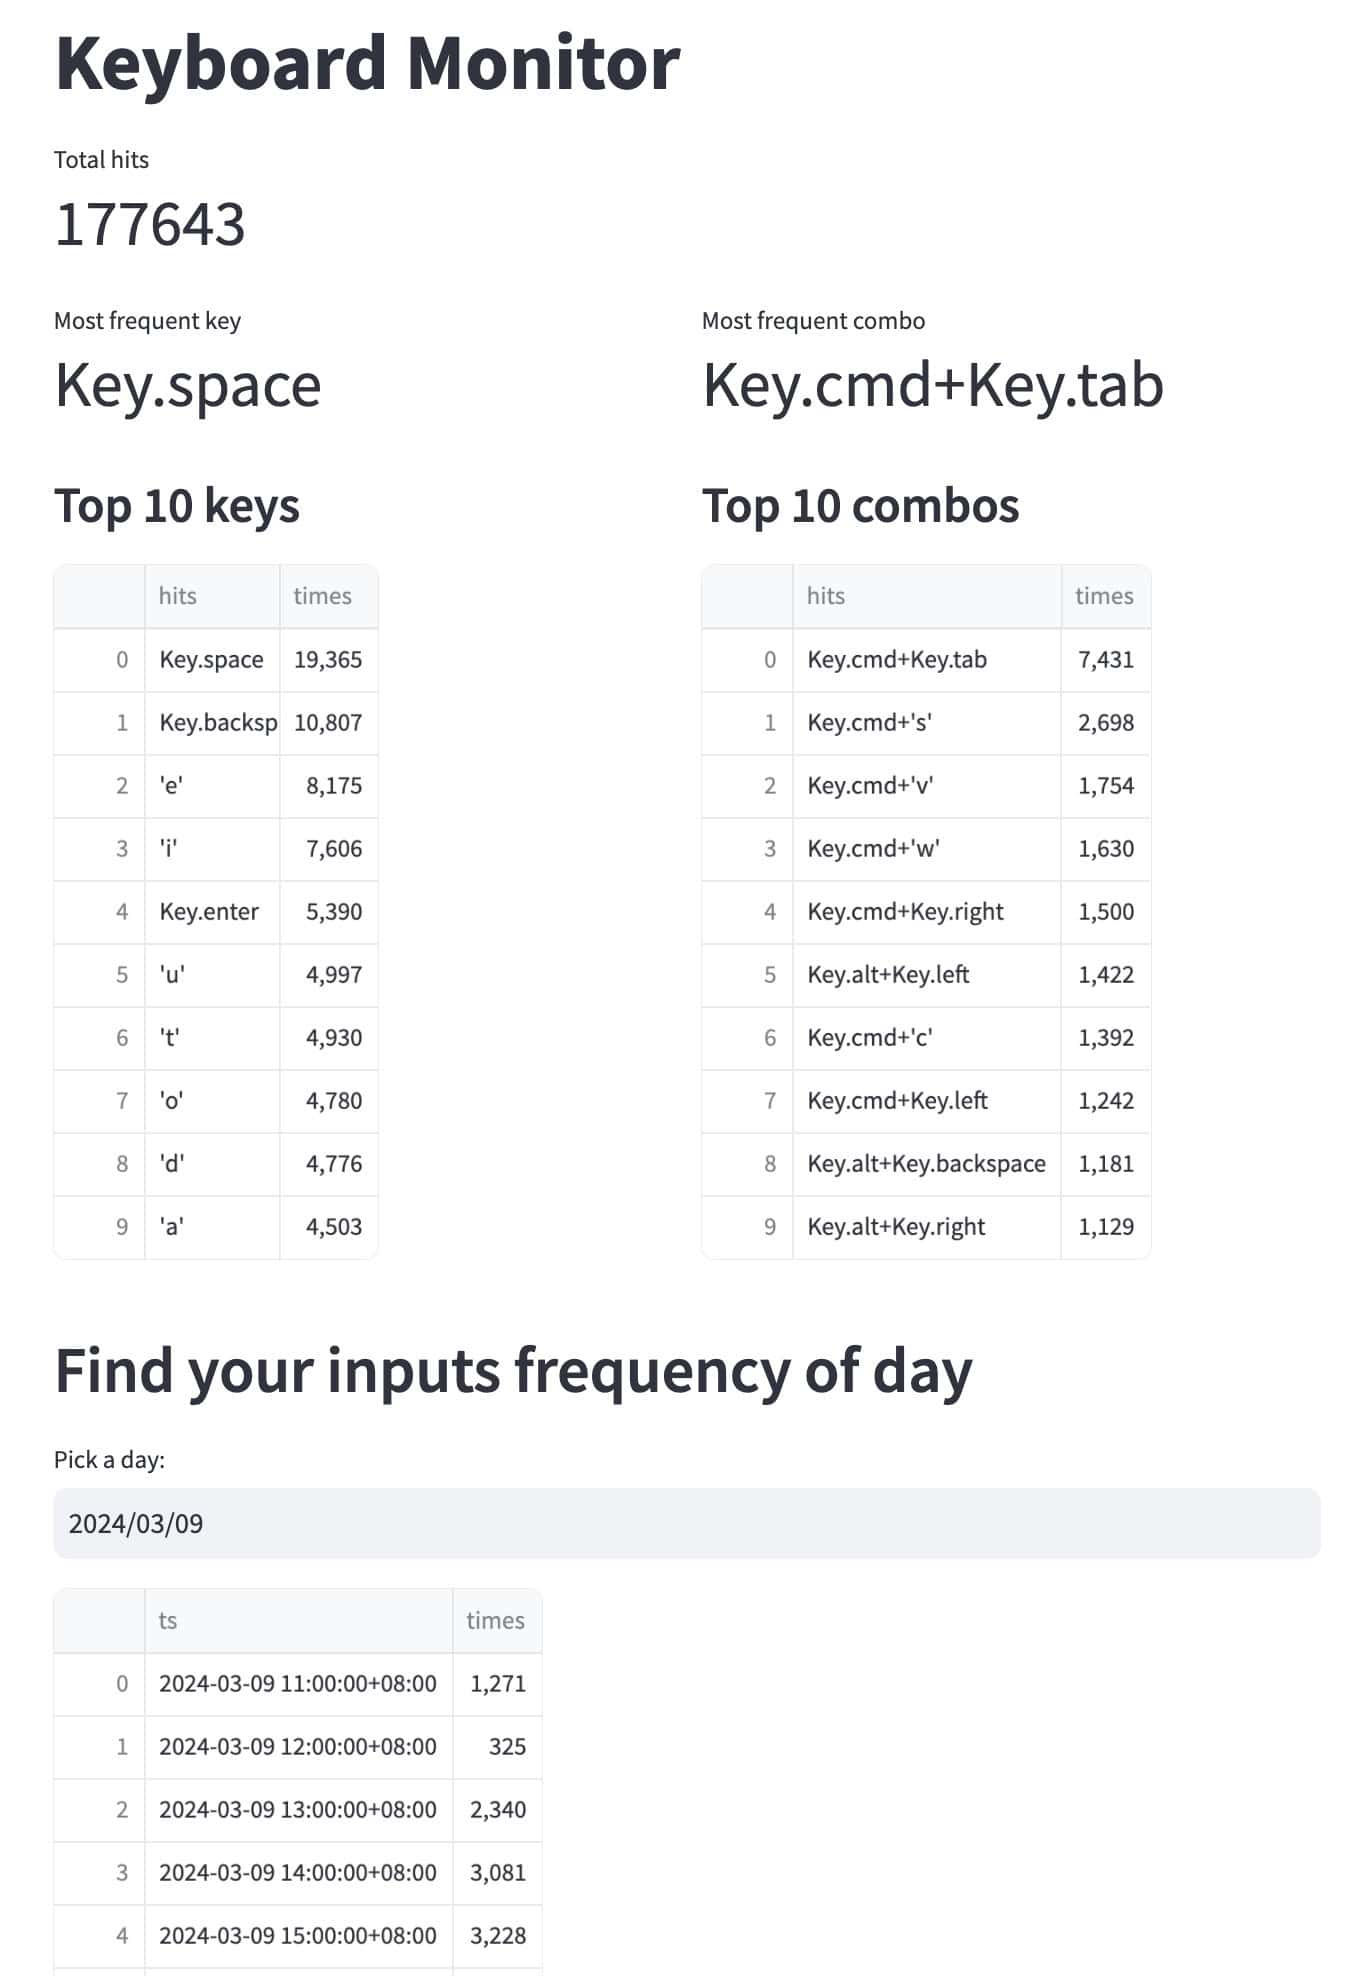
It’s expected that I always use Key.space to confirm my inputs and Key.cmd + Key.tab to switch between windows since I have only one displayer. But it’s surprising that I type Key.cmd + v much more frequently than type Key.cmd + c, and I keep unconsciously typing Key.cmd + s even though most of my editors can auto-save now.
If you find it interesting, this article will tell you how to build such a dashboard for you.
Prerequisites
All the source code you need to build this dashboard is available in the GreptimeTeam/demo-scene repository.
What is Streamlit?
In this demo, we use Streamlit to display the input frequency.
Streamlit is a free and open-source framework to rapidly build and share beautiful data science web apps. It is a Python-based library specifically designed for data engineers. Streamlit can easily display data and collect needed parameters for modeling, allowing users to create a stunning-looking application with only a few lines of code.
What is GreptimeDB?
In this demo, we store keyboard typing events into a GreptimeDB cluster.
GreptimeDB is an open-source time-series database focusing on efficiency, scalability, and analytical capabilities. Designed to work on infrastructure of the cloud era, GreptimeDB benefits users with its elasticity and commodity storage, offering a fast and cost-effective alternative to InfluxDB and a long-term storage for Prometheus.
Prepare the environment
Now, clone the source code and install all the dependencies:
git clone https://github.com/GreptimeTeam/demo-scene.git
cd demo-scene/keyboard-monitor
pip3 install -r requirements.txt
You will install Streamlit, SQLAlchemy to connect to GreptimeDB, and pynput to monitor the keyboard events.
Get a GreptimeDB cluster freely
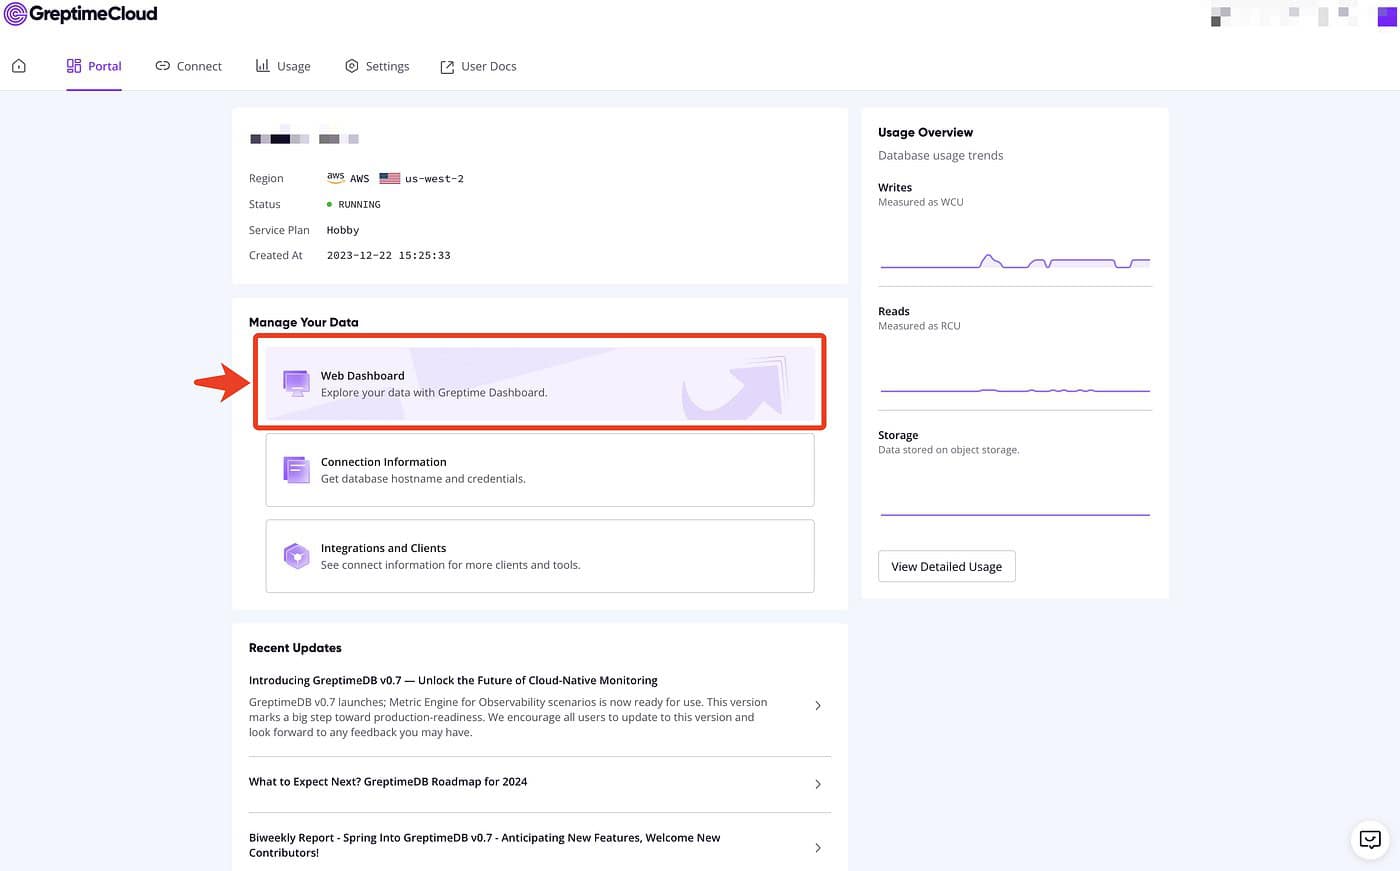
The fastest way to get a GreptimeDB cluster is to start a hobby plan (completely free, with no credit card info needed) service on GreptimeCloud.
Follow the instructions to obtain a new GreptimeDB service, head to its “Connect” tab and find the MySQL connection string in use.
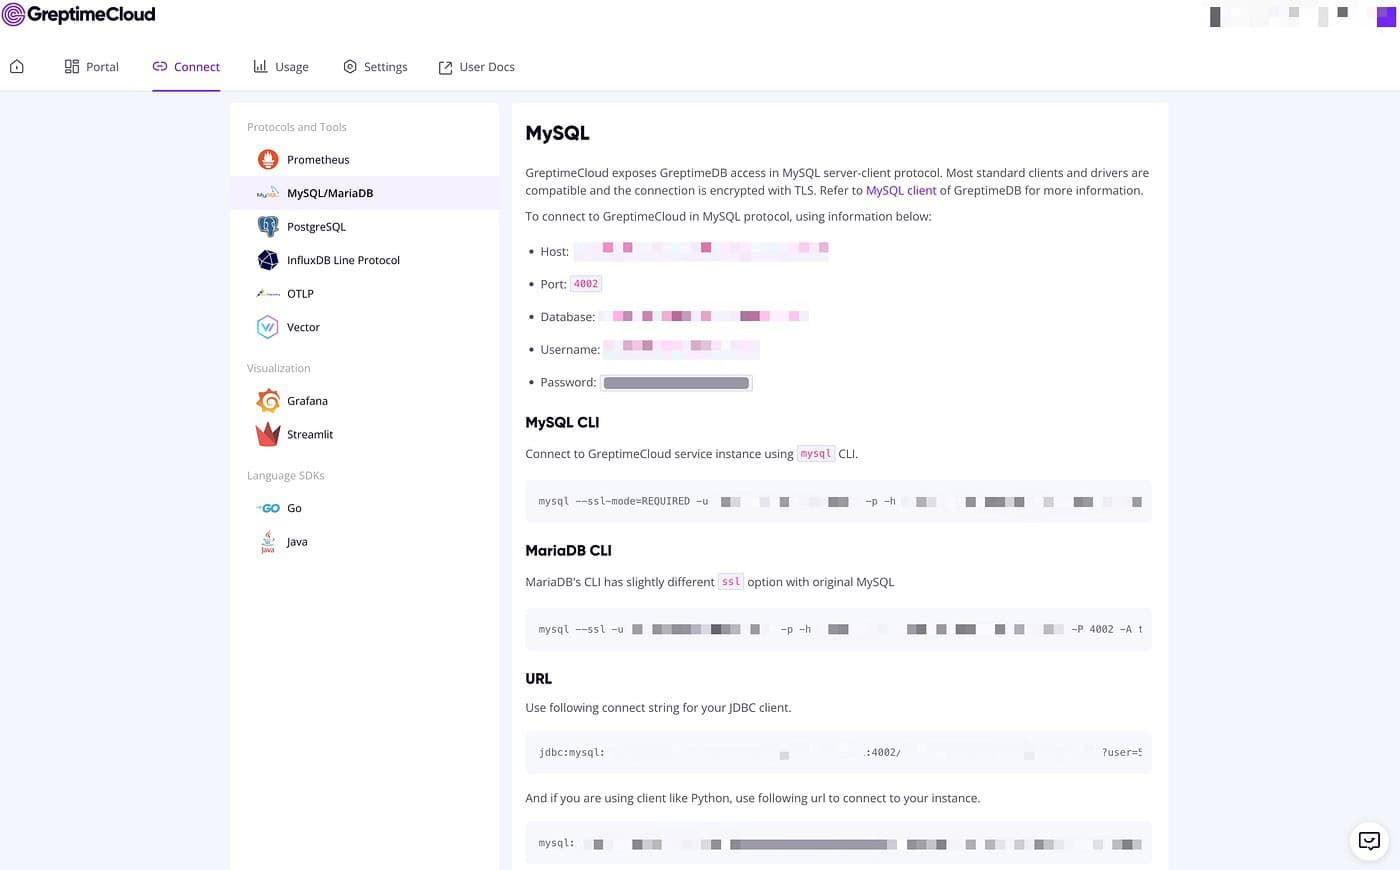
Create a file named .env with the following content (replace the coresponding fields with the connection string):
DATABASE_URL=mysql://[username]:[password]@[hostname]:4002/[database]Now, all the setups are finished. Go to the next step to capture your typing behavior.
Start keyboard monitor
Run the agent script to listen to keyboard inputs:
python3 agent.pyYou should see logs like:
2024-03-07 20:57:53,799 INFO listener_thread Listening...Then, keep typing as usual in any window, you will find the terminal running the agent script logs like:
2024-03-07 20:58:01,510 INFO sender_thread sent: Key.backspace
2024-03-07 20:58:01,947 INFO sender_thread sent: Key.enter
2024-03-07 20:58:02,498 INFO sender_thread sent: Key.shift+'#'
2024-03-07 20:58:02,938 INFO sender_thread sent: Key.space
2024-03-07 20:58:03,377 INFO sender_thread sent: Key.cmd+Key.right
2024-03-07 20:58:04,052 INFO sender_thread sent: Key.cmd+'s'
...
Query keyboard inputs statistics
When you see the “sender_thread sent” logs, it means that the GreptimeDB service is now receiving typing events. You can query the input statistics on GreptimeCloud Web Dashboard:
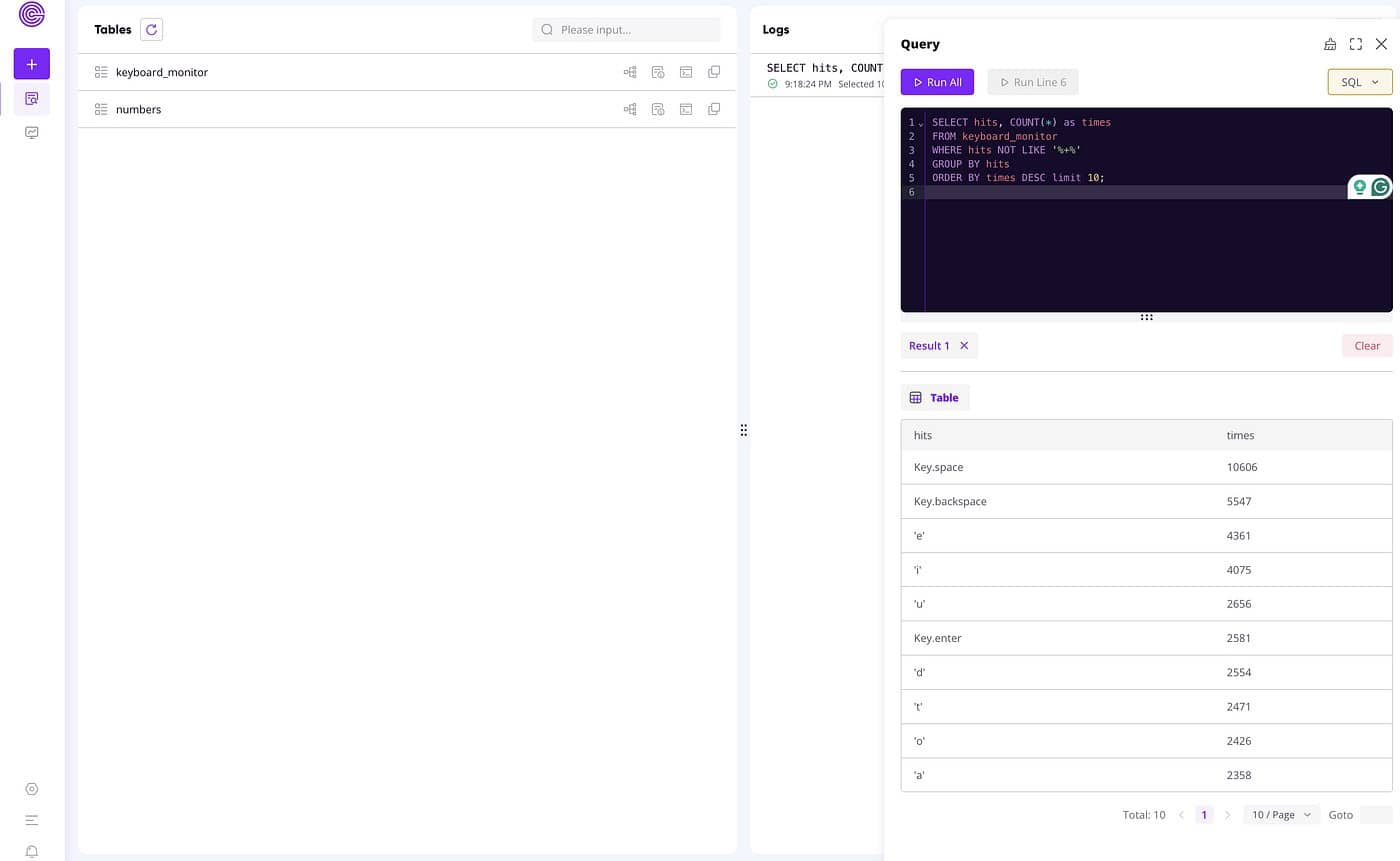
For example, you can find the most frequent keys with standard SQL:
SELECT hits, COUNT(*) as times
FROM keyboard_monitor
WHERE hits NOT LIKE '%+%'
GROUP BY hits
ORDER BY times DESC limit 10;
To calculate hits per minute, you can leverage GreptimeDB’s powerful RANGE QUERY:
SELECT
    ts,
    COUNT(1) RANGE '1h' as times
FROM keyboard_monitor ALIGN '1h'
ORDER BY ts DESC
LIMIT 10;
Visualization with Streamlit
It’s pretty easy to integrate GreptimeDB with Streamlit since it could be treated as an SQL backend with no need to develop an extra integration layer. Thus, you could easily utilize Streamlit to visualize your input frequency.
Run the following script:streamlit run display.py
It’ll open a window in your browser (http://localhost:8501/) and show the data frames:
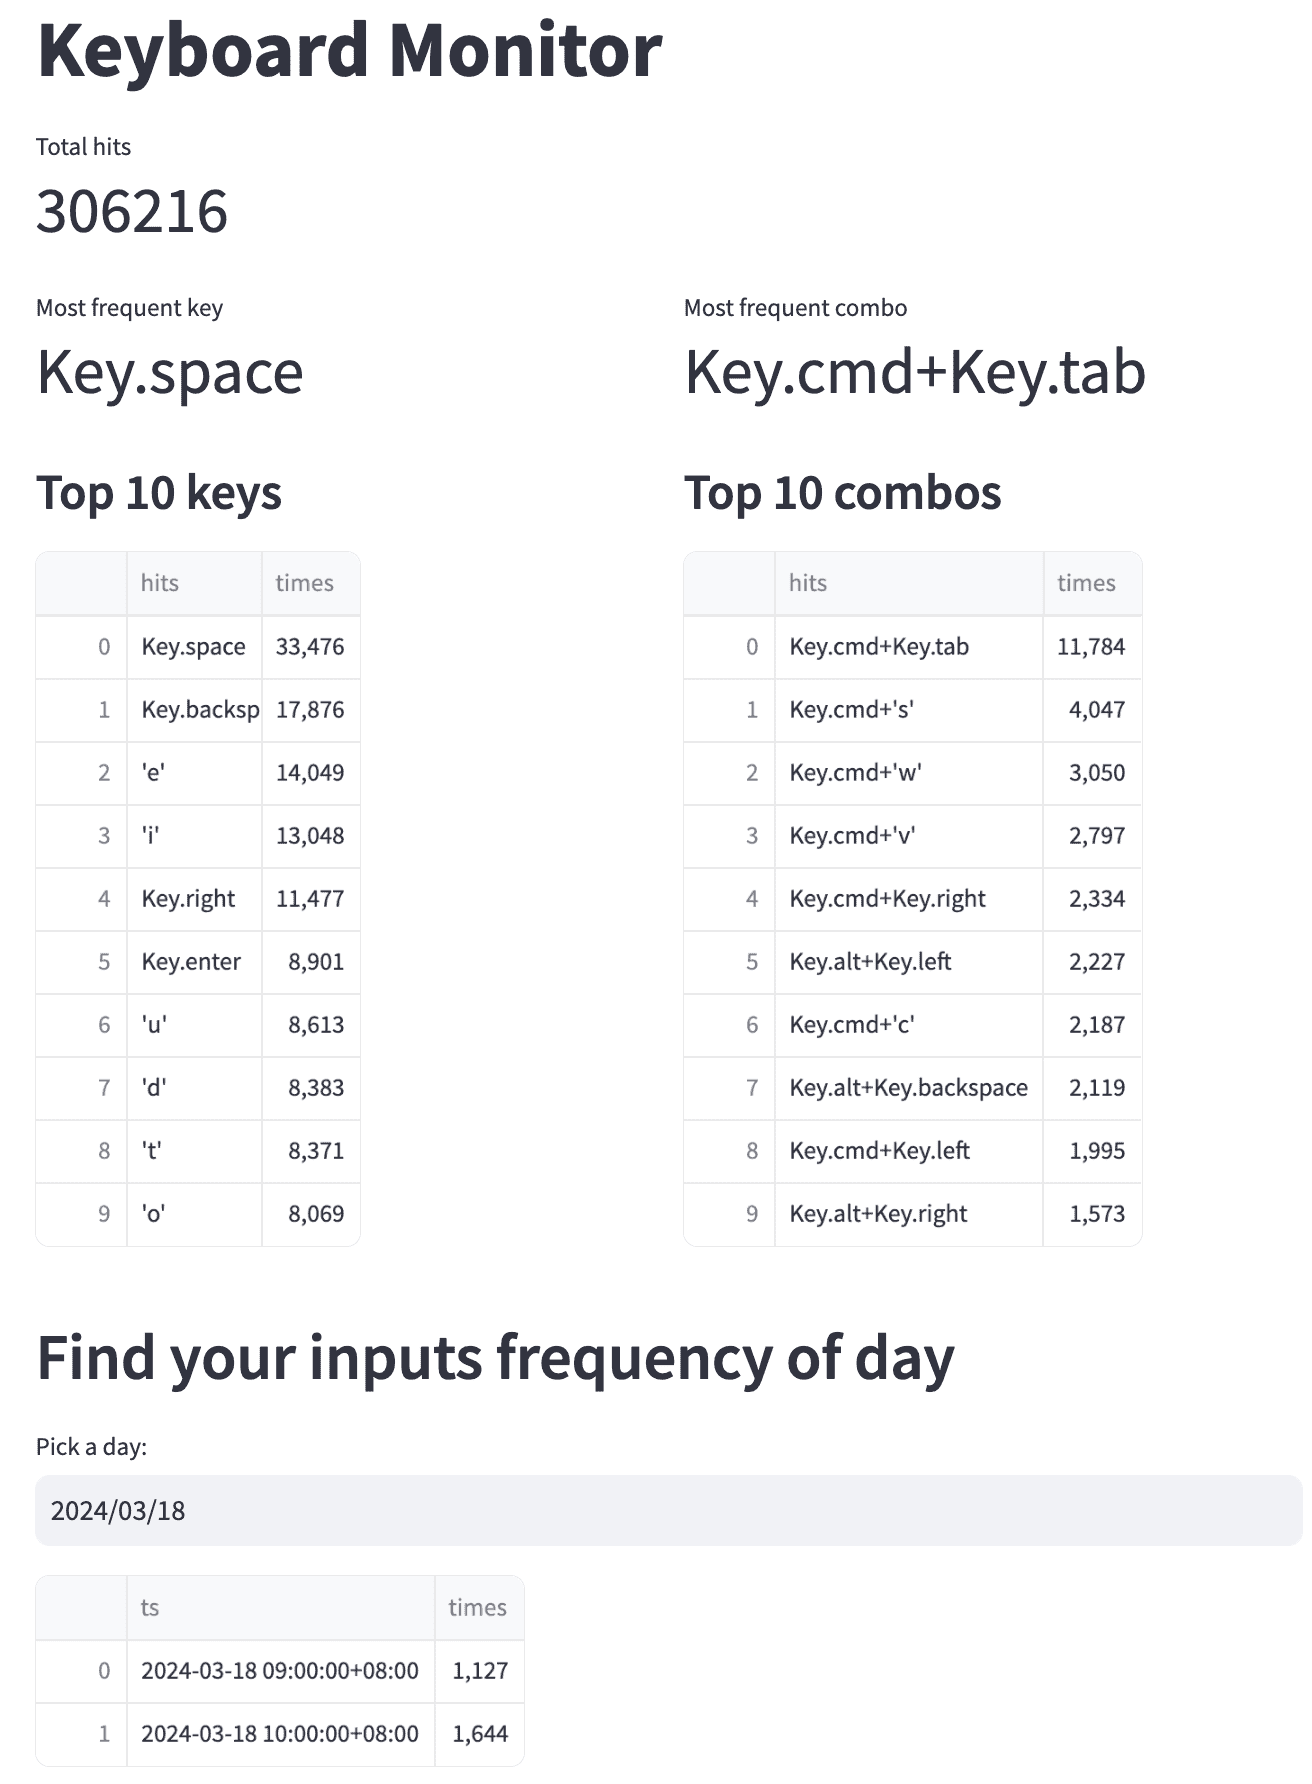
That’s all!
To sum up, in this guide, we’ve shown you how to create a dashboard for monitoring your typing habits. We invite you to embark on this journey of discovery and experiment on your own. You might uncover intriguing insights about your behavior that you’ve never considered before. Also, feel free to explore other behaviors using GreptimeDB and share your findings and demos on X (Twitter) or our Discussions forum.

About Greptime
We help industries that generate large amounts of time-series data, such as Connected Vehicles (CV), IoT, and Observability, to efficiently uncover the hidden value of data in real-time.
Visit the latest version v0.7 from any device to get started and get the most out of your data.
- GreptimeDB, written in Rust, is a distributed, open-source, time-series database designed for scalability, efficiency, and powerful analytics.
- GreptimeCloud offers a fully managed DBaaS that integrates well with observability and IoT sectors.
- GreptimeAI is a tailored observability solution for LLM applications.
If anything above draws your attention, don’t hesitate to star us on GitHub or join GreptimeDB Community on Slack. Also, you can go to our contribution page to find some interesting issues to start with.