
Member post originally published on Last9’s blog by Aniket Rao

Here’s a detailed blog post on monitoring Cloudflare Workers using Prometheus Exporter. We discuss the data flow of how Prometheus Cloudflare Exporter fetches metrics from your Cloudflare account; then, by scraping the exporter, we remote write to a long-term metrics storage like Levitate.
Monitoring Cloudflare Workers
Traditionally, Prometheus-based monitoring systems periodically scrape targets and pull metrics. However, this strategy does not work well with Cloudflare Workers. Cloudflare Workers are serverless, which means they run only when invoked. Very similar to Functions as a Service.
I have a written a post on monitoring Google Cloud Functions with Prometheus.
The metrics published by Cloudflare workers are not in the Prometheus format, so we need a Prometheus exporter to convert them into Prometheus format and then scrape them.
The following diagram explains the data flow.
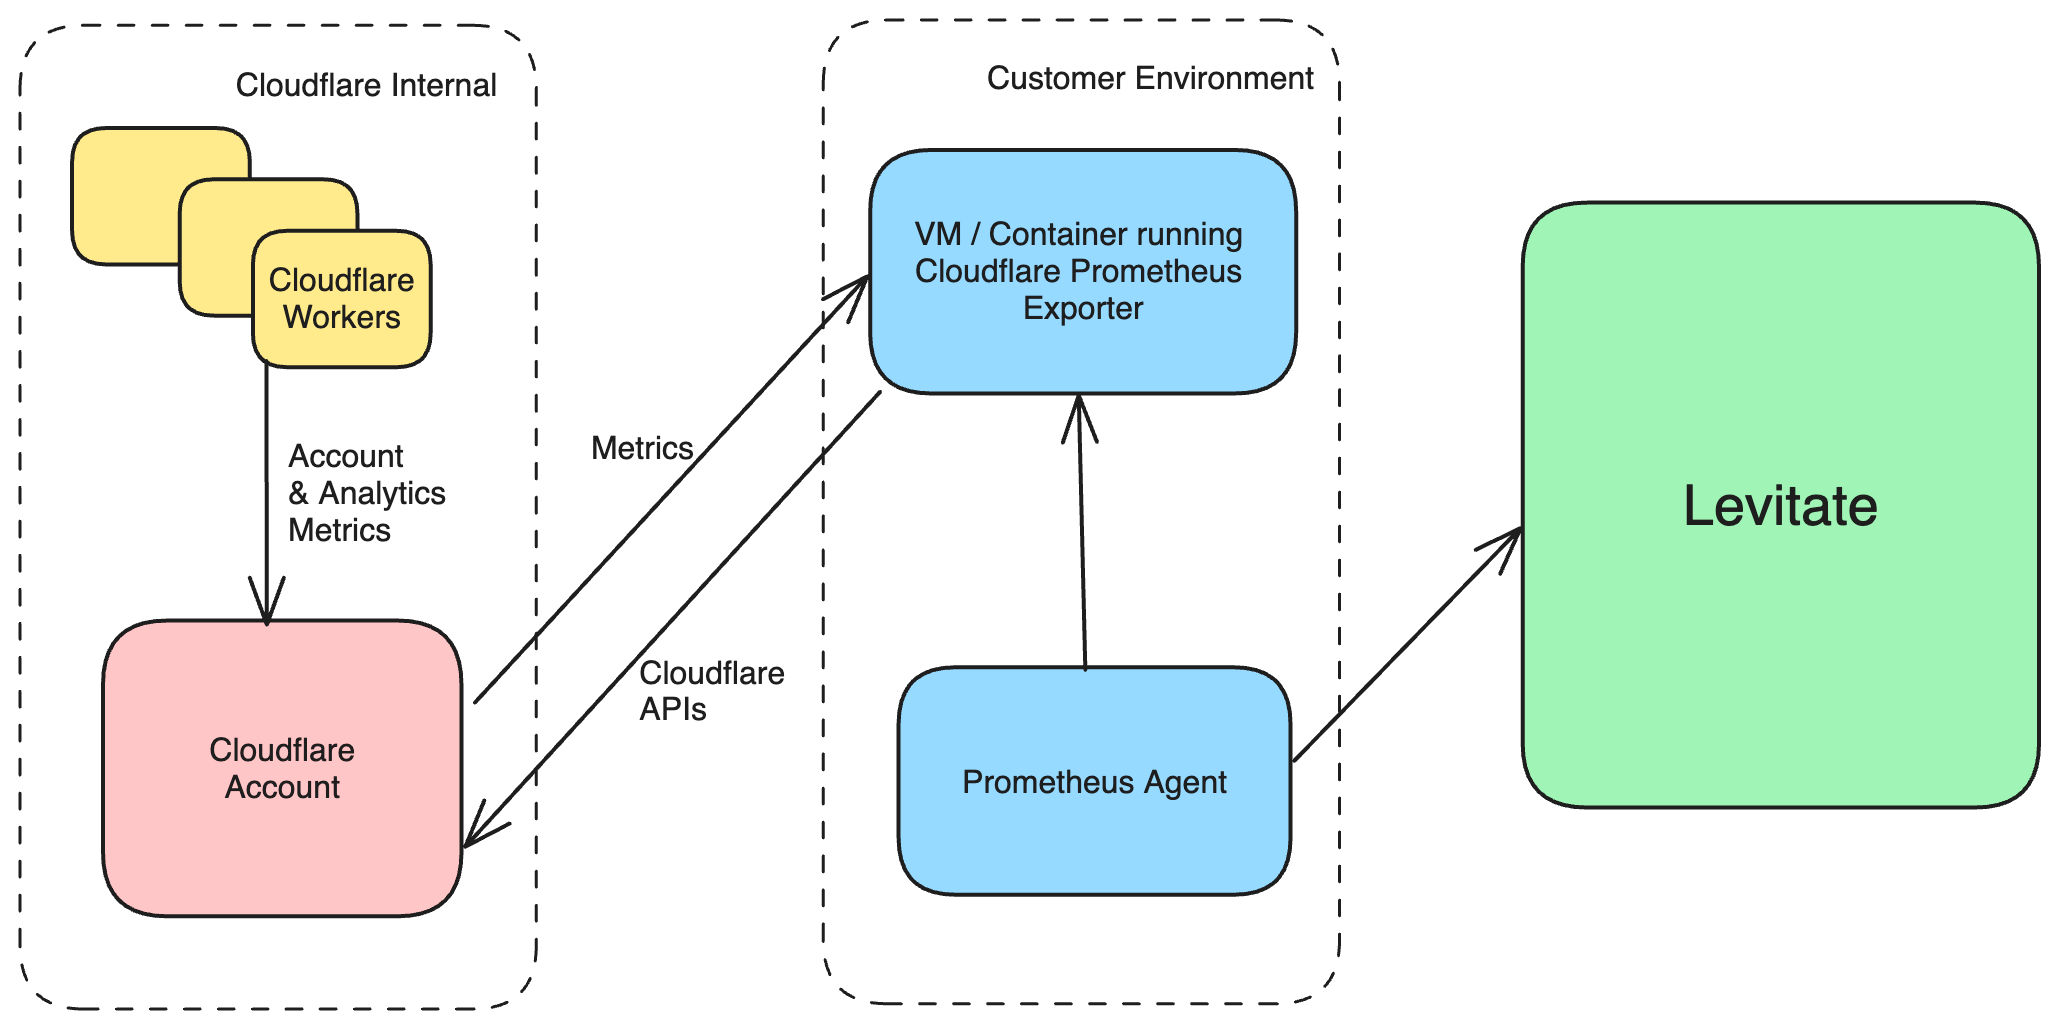
Cloudflare Prometheus Exporter
Since Cloudflare Workers are part of Cloudflare infrastructure, they publish their metrics to the respective customer accounts. These metrics can be queried using Cloudflare Monitoring APIs, which is precisely what the Cloudflare Exporter does. This exporter frequently queries your Cloudflare account for metrics, and depending upon your Cloudflare worker usage, the corresponding metrics and their values are part of the query result. As with any Prometheus Exporter, the collected metrics are available on the /metrics endpoint and a default port for any scraper to scrape.
The exporter needs the Cloudflare API Key to perform the query operations. A complete list of configuration options can be found here.
Installation
The Cloudflare Exporter can be deployed as a containerized workload or as a binary running as a systemctl service on a virtual machine. We can follow the instructions as per the documentation provided here.
Prometheus Scrape Job
We can configure Prometheus Agent to scrape metrics from the target, i.e., the deployed instance of Cloudflare Exporter. When Prometheus performs a scrape operation, it sends an HTTP request to the Exporter’s /metrics endpoint, which returns all the current metric data.
Below is an example scrape config.
global:
  scrape_interval: 1m
  scrape_timeout: 30s

scrape_configs:
  - job_name: "cloudflare-exporter"
    static_configs:
      - targets: ["<internal-ip-cloudflare-exporter-vm>:9090"]
If you are running this in Kubernetes, you can use this Helm Chart.
Remote Write Metrics
Prometheus has a feature called “remote write” which allows it to send the metrics data it collects to a remote data store; in this case, we use Levitate.
Follow the document to send metrics using Prometheus Agent.
What are the available metrics?
You can refer to the Cloudflare Exporter GitHub repository, which maintains a list of available metrics. Here are some Cloudflare Worker-related metrics.
# CPU time quantiles by script name
cloudflare_worker_cpu_time

# Duration quantiles by script name (GB*s)
cloudflare_worker_duration

# Number of errors by script name
cloudflare_worker_errors_count

# Number of requests sent to worker by script name
cloudflare_worker_requests_count
A complete list of metrics can be found here.
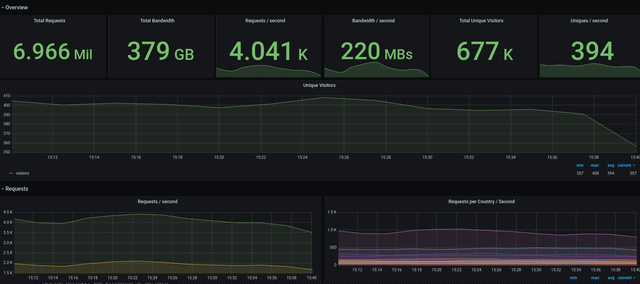
Grafana Dashboard
The good folks who built the Cloudflare Prometheus Exporter have also published a Grafana dashboard. It can be downloaded from here.
Conclusion
Using the Cloudflare Prometheus exporter, you can monitor your Cloudflare Workers. You can also push them to long-term storage, like Levitate, for durability and long-term analysis.