
Member post from Rob Williamson, Solace
The goal of OpenTelemetry is to have a common system for tracing across different (aka distributed) technologies. It solves the problems created when systems are deployed across hybrid and multi-clouds, up and down the technology stack, and across applications/microservices built independently of each other. Today’s distributed teams, systems and microservices deliver great benefits, but like any system it has its own problems. These problems include (but are not limited to) increasing the mean time to detect and resolve errors in development and during troubleshooting of production environments. We have heard our customer sum this up simply by saying, “by tracing we have less finger pointing between teams when something is going wrong.” And this is one of the promises of Observability.
The benefits also include reducing the difficulty in tracking the movement of data and events for compliance or audit. For example, in heath informatics HIPPA-compliance is critical. OpenTelemetry itself is not part of compliance, however, if somebody is looking to confirm that health data has not gone to the wrong application, and if you don’t have true end-to-end visibility of where that information flowed, then it could be argued that the lack of insight means you can’t prove it hasn’t. The real world is not a court of law where there is an assumption of innocence – but in fact a software application where you need to prove lack of guilt. Therefore, when there is a invisible piece in your architecture, it is a possible problem.
In summary, for true end-to-end observability you benefit from having native instrumentation of OpenTelemetry in the services and applications – including message brokers.
Architectural overview
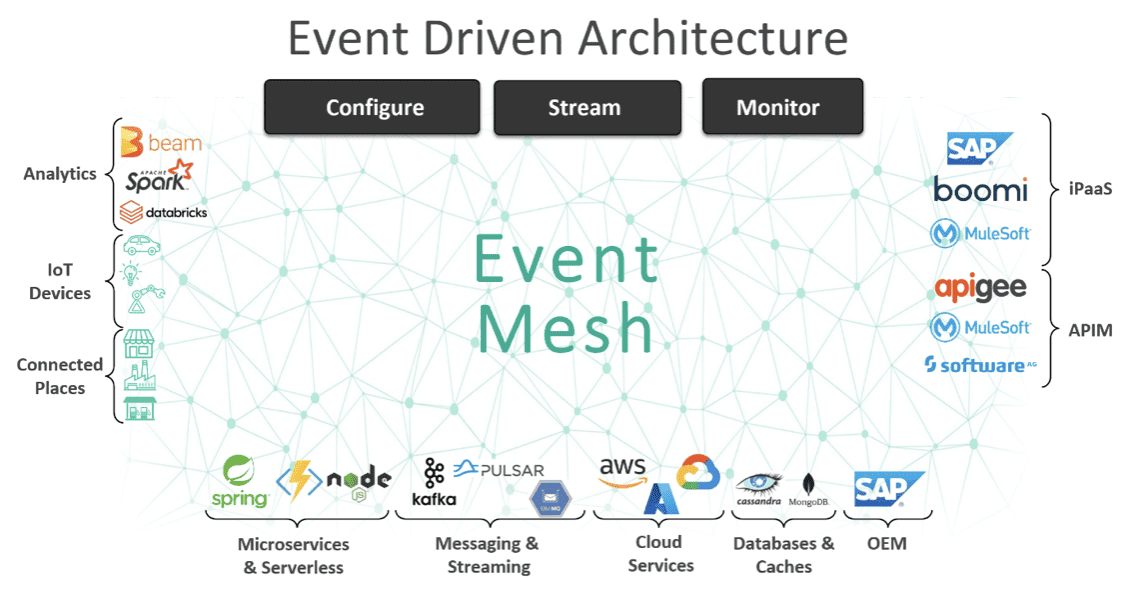
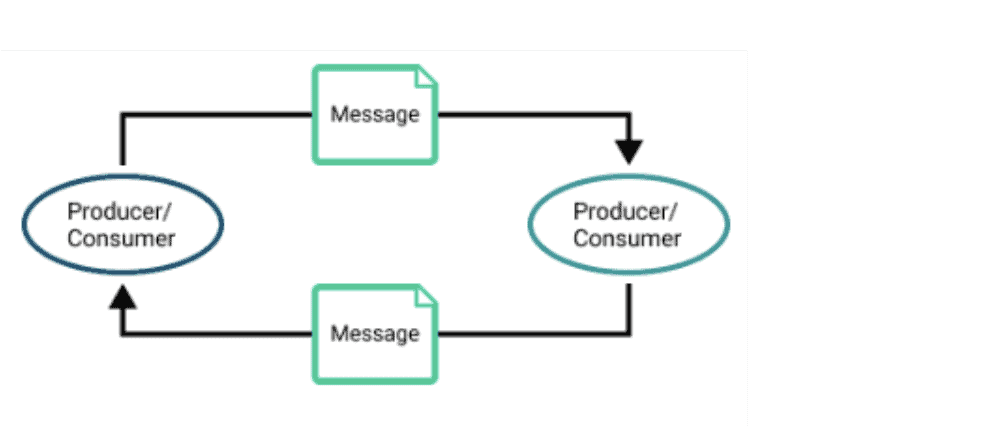
With the business objectives covered, let’s look at the technical implementation details. For organizations using an Event Driven Integration strategy they are generally deploying an event broker or a network of connected event brokers, called an Event Mesh. The event mesh decouples producers and consumers and allows for integrating different protocols, allowing for different rates of consumption, and makes event publication and discovery much more efficient.
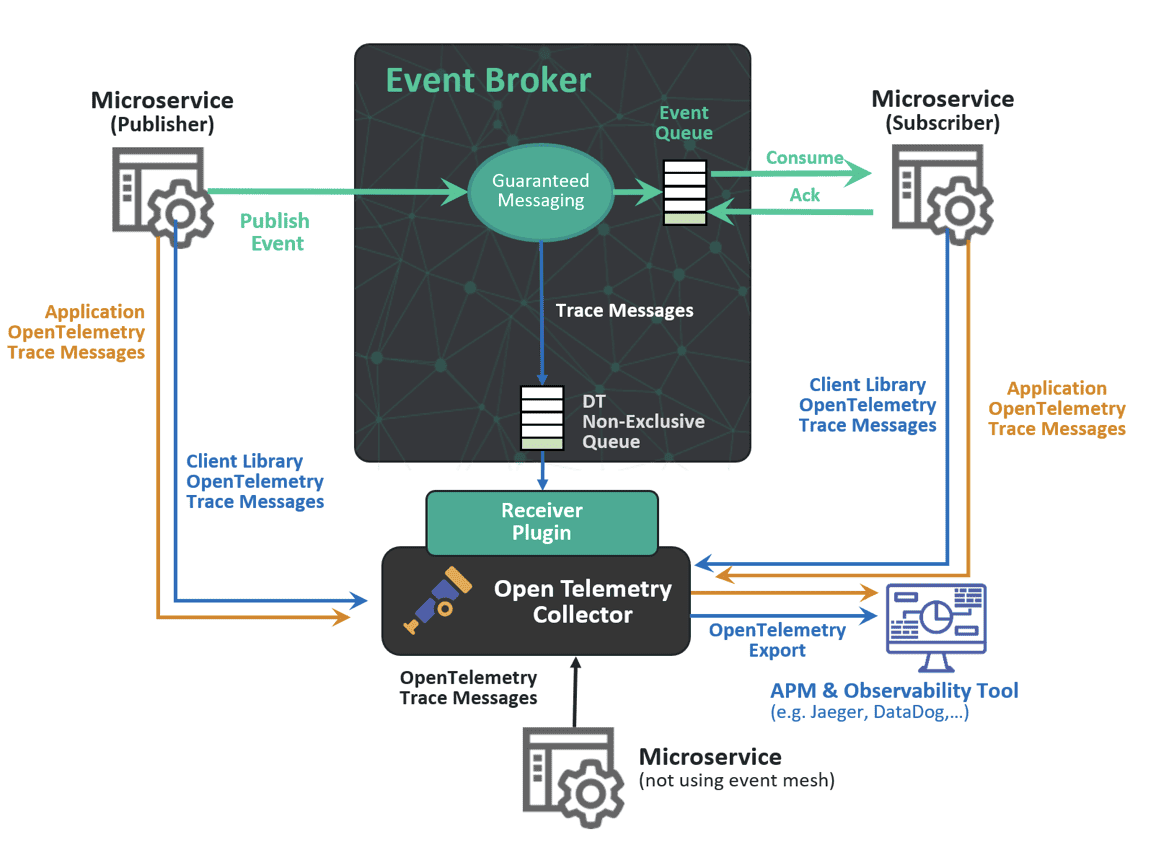
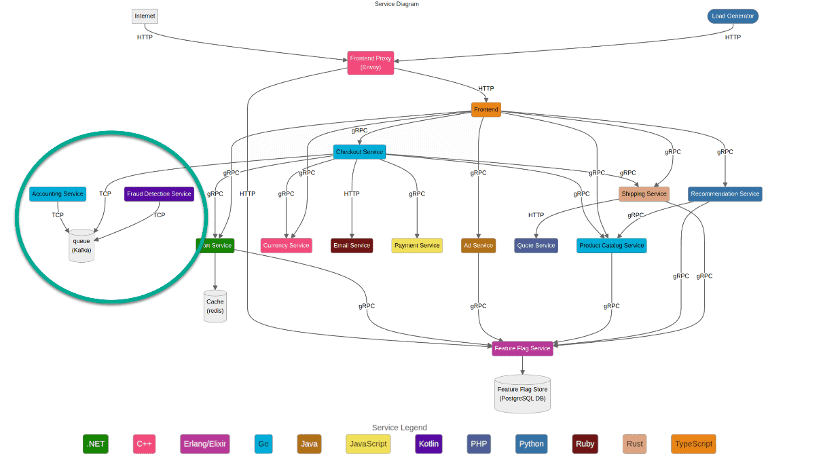
With an event broker, the implementation is native to the broker and sends the traces to a non-exclusive queue that can be used to send the trace messages to a collector of your choice. Shown in the image below we are also adding the cloud managed service where it includes (optionally) a supported OpenTelemetry collector for each broker. You can read more about the architecture in the solution brief – Tracing and Observability on an Event Mesh with OpenTelemetry.
What insight does OpenTelemetry give into event broker operations?
It provides insight in event messaging patterns for when things go wrong
Event brokers deployed in operational use cases publish events that any consumer can subscribe to. This is different than 1:1 RESTful integrations. It means that they need to have messaging functionality to allow for things like queueing events, guaranteeing delivery, managing slow consumers, and ensuring message order. Here are a few examples of commonly needed messaging architectures in enterprise applications:
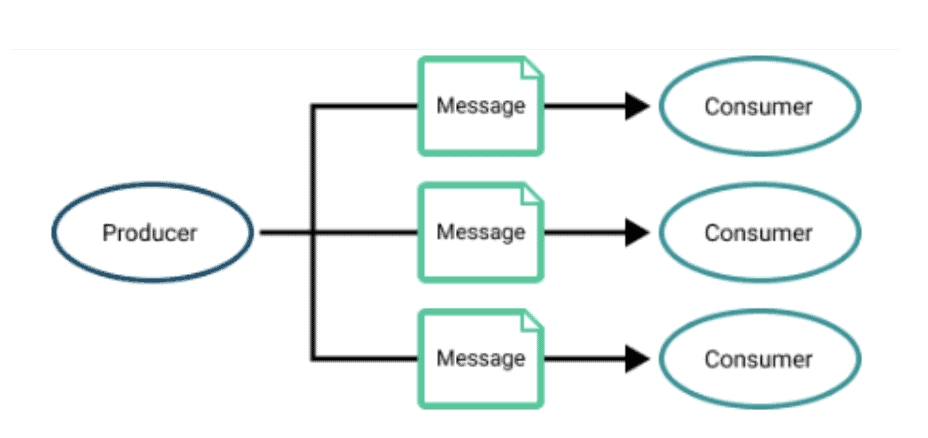
Pub/sub pattern where a message can be processed multiple times by different consumers
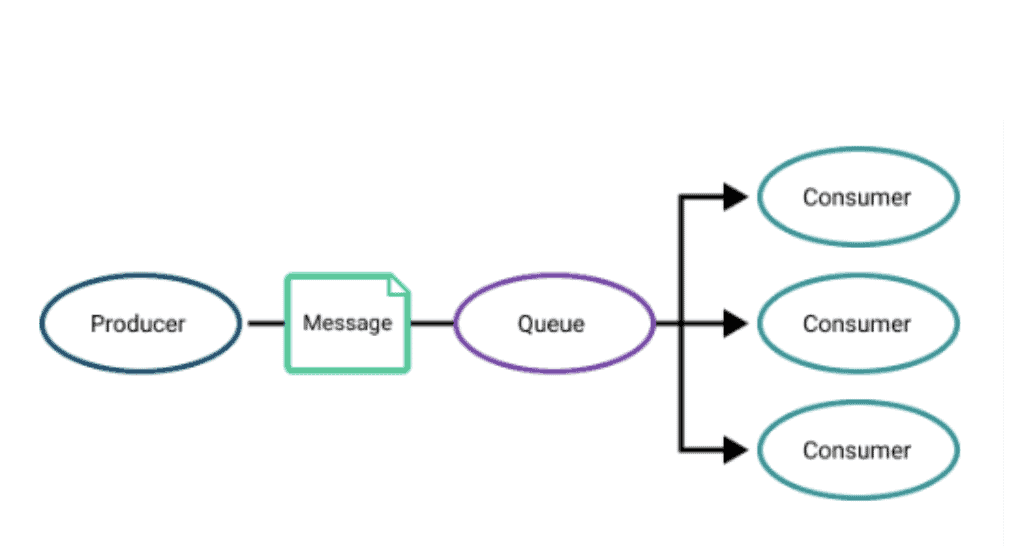
Non-exclusive consumption where multiple consumers share a queue but the message can only be consumed once
Request/reply used for guaranteed messaging. The reply can be configured when message is received or after the message is processed and the ability to re-send a message when the reply is absent can be configured.
Let’s consider a few scenarios where a problem could occur and that you couldn’t easily discover without native tracing implementation in the event broker.
Scenario 1 – malformed topic
Topics are used so events can be published, discovered, subscribed and routed to based on the consumer needs. In many cases topics are programmatically generated. For instance, a topic could be as simple as a city name, or a flight number or as complex as a customerID. Remember that these are decoupled development environments and events can be created on one service, consumed on another, published to a third (and so on). The consumers may be expecting a specific string type for a customerID but the publisher may malform it. Or the app creating the ID may have not had the needed parameter controls and may allow a malformed topic to be created. Without being able to trace on the broker, you will simply know that the subscribing application was sent the event based on the topic. The fact it couldn’t be executed would not be easy to solve.
Scenario 2 – expired time-to-live
There are many scenarios where an event is assigned a specific TTL before the event is deleted or sent to a dead message queue. For example, if a consumer fails, backs-up, or otherwise can’t receive a stock price data within the needed time then that data is no longer relevant. The broker sets the TTL before sending to a dead message queue. If that queue fills up based on the available cache then there is nowhere for it to go, and events are discarded. This is all traceable at the broker so that the events can be discovered and analyzed. Without this, all you would know is that the span length of the broker step was slow, that the consumer failed to process the event – but not have an easy path to why resulting in both teams doing investigations.
Scenario 3 – the client permissions don’t allow it to consume the event
Access Control Lists (ACLs) within an event broker define what clients can access the message VPN. Since publishers and subscribers are not aware of each other in a decoupled event-driven architecture a client connecting may not be able to receive the message – or perhaps the message publisher adds new controls for some business reason that the consuming application developers were not aware of. As the client is no longer receiving events, being able to identify those events and analyze the reason for the broker operation will tell the developer where things are not flowing and why.
It helps with decoupled autoscaling – which is like taking the hard parts of decoupling and hard parts of scaling and multiplying them together.
Autoscaling is very popular in microservice development because it helps organizations to better align resources to the demand without expensive overprovisioning. This is especially important as rising cloud costs are getting more scrutiny by those surly finance-types. It is why technologies like Kubernetes Event Driven Autoscaling (KEDA) are growing so popular.
When you combine the messaging complexity with microservice scaling, you create even more complexity on tracing individual events. With autoscaling, an event can move to multiple queues on the broker and be consumed by multiple consumers that are being added and removed based on queue depth (or some other pre-defined parameter). Without tracing native to the broker, you can’t easily determine the path the event took. Now just imagine it with multiple publishers and multiple consumers moving in hundreds of directions. This picture of only a few scaled consumers and only ten queue partitions will hopefully help understand the depth of the issue if you can’t trace the queues:
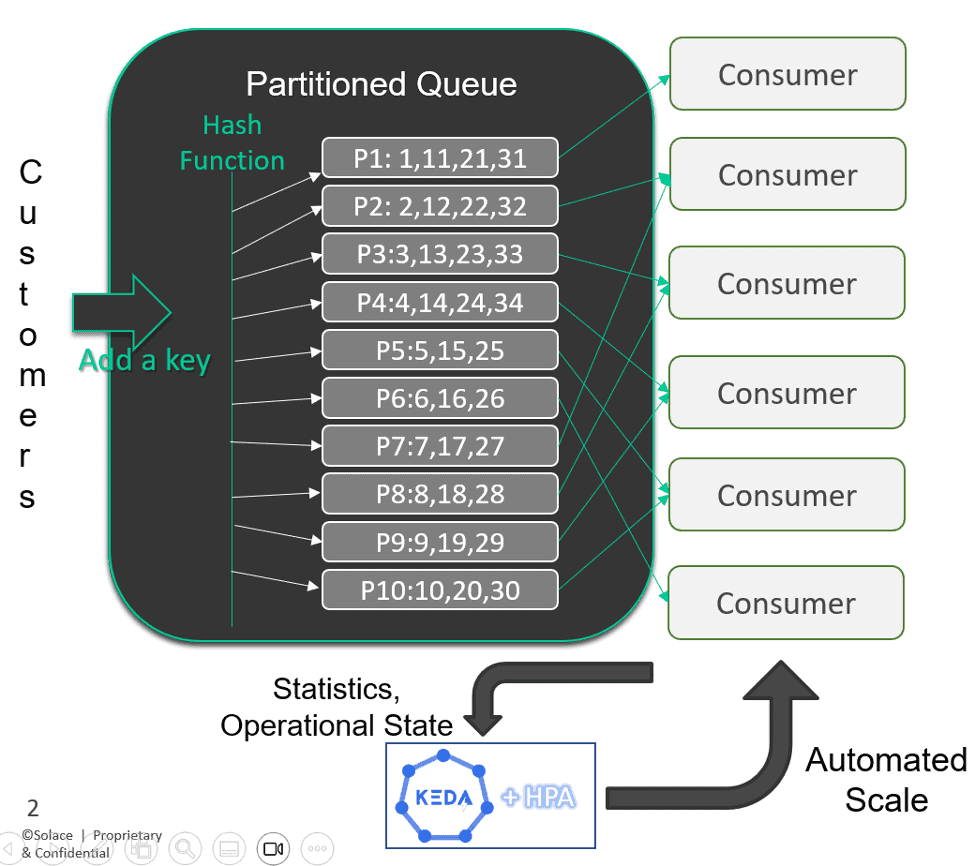
Each of the messages are assigned a partition that can only be consumed by one consumer. The message order needs to be maintained as well as the target consumer – while the whole thing scales up and down.
With distributed tracing in the broker, you can trace an event and know what partition, order, consumer, and more. If there is a problem scaling up or down due to a queue not being drained before the consumer is offline, the events impacted can be identified in the trace.
It helps with edge applications because tracing at the event broker is a bit like meta-tracing when the client applications aren’t instrumented for OTel
Some applications can’t be (or can’t easily be) instrumented with OpenTelemetry. This could be due to the application profile (i.e. IoT) or due to the cost to code a legacy application. This is a significant benefit of using the event broker enabled with OpenTelemetry. In effect, because you are beginning the trace when the event enters the system, and you can locate the application that received the event, by enabling the event/message you get “end-to-almost-end” visibility, where before you had none. And for many cases this may solve the business problem. Yes, it flies a bit in the face of the point of end-to-end tracing, but this is the real world, and it isn’t binary (yet).
Something to watch for if considering tracing in a log-based broker like Kafka
We have focused this on tracing for operational use cases where things like queues and guaranteed delivery (i.e. acknowledgement) are more critical. However, there are still instances where the organizations EDA may include a log-based broker that is instrumented via API. Kafka itself is instrumented via API, which limits the availability of operational data. This is sufficient when the event is in its end state – or when it is being transformed, it means that you are accepting some incomplete observability, which may be fine for certain use cases.
For analytics and streaming, a log-based broker is a common end point for operational brokers to deliver events into, for instance, a Kafka cluster. The challenges to watch out for when considering how to extend the tracing to the log broker include.
- Logs can be accessed via batch processes and would only have one trace. The performance benefits of a batch approach on huge datasets are clear – but you can’t see the individual events.
- Lack of visibility of events once they are inside the broker so you can’t deliver lineage, do full end-to-end monitoring and lowers ability to optimize the broker environments.
- Message transforms (i.e. that are often done on the broker) for analytics can’t be tracked since the instrumentation is not at this level. This can include things like masking values, renaming fields or introducing timestamps.
We always have to be careful when talking about what can’t be done because things are always evolving and, with code, there is always a way to do something. The challenge is simply whether this way is optimal for large-scale systems. At scale, and for operating environments versus analytics, a queue-oriented broker can generally offer some useful benefits when instrumenting telemetry across the distributed system. And your Kafka clusters can still be sources or sinks for events when the application use case fits that broker type.
Tracing sounds like the perfect solution – but you still need to plan for the capacity
Tracing, unfortunately, observes the laws of physics and so is not costless on the system. When you send an event, you are also sending a trace. This has a cost in processing, egress, and storage but there are certain steps that can be used to optimize the system – for instance batching traces for processing rather than 1:1. It means that the system needs to be spec’d to support the additional overhead. Because it can be set-up on each and every event and because event can be sent to multiple subscribers the number scales more than the publishing application designer may have considered. Being able to understand and manage the compute costs in the event layer is the job of the middleware team and they will need to ensure they have architected the system to the desired needs. To answer questions like:
- What environment has sufficient ability to vertically scale
- Where do I locate my primary OTel collectors
- Do I need to trace all events for my use case
- What is average size of traced messages
- What is the average size of message fanout
The traces themselves are generally much smaller than the payload for any events being distributed, but they do still have a cost and in some systems it may not make sense to use it. For instance, a high volume, high speed front office application like equities trading may have a lower ROI for introducing tracing, but the back office operations like settlement derives more benefits because the event flow and reliability is critical to operations and the consumers of the events are more variable.
Sounds great! How do I test this?
The OpenTelemetry project has built a very powerful test environment for you to go in and play for yourself. It includes a messaging section with Kafka as the broker. Solace has forked this git in order to include a queue-based broker so you can test the native implementation alongside one instrumented natively and see how they differ. Regardless of what your application needs are, we recommend checking this out to see how it performs and what data is available. Including things like, what is published, enqueued, delivered, acknowledged, rejected, moved to DMQ, etc.
Check out the demo of distributed tracing in two different broker types over on github
Growth in the OTel standard has been a net boon to the open -source community. As decoupled event driven architecture is the future of enterprise applications and it makes tracing using Otel that much more important. It also makes it that much more complex. A well architected system can deliver on event driven integration, allow for observability and delivers a positive cost-benefit of implementing OpenTelemetry.