Community guest post by Benoit Petit, co-founder of Hubblo as part of the cloud native sustainability week
- State of IT server energy consumption evaluation
- What final energy represents in Information and Communication Technology (ICT) environmental impacts?
- A bit of history, measuring the energy consumption of IT resources
- Means and realms of evaluation
- Software evaluation biases and improvements to come
- Powercap is nice, no equivalent on Windows?
- A RAPL survival guide
- Conclusion
- Bio
- Thanks
- Sources
This blog post is about sharing what thoughts and insights we got during developing Scaphandre with our contributors, discussing with researchers and IT practitioners, regarding ways currently available to evaluate an IT server energy consumption and the limits of each. From this we try to picture some of the challenges ahead and leads we identify to work with them.
State of IT server energy consumption evaluation
What’s final energy consumption’s share in Information and Communication Technology (ICT) environmental impacts?
First things first, this blog post should not to be interpreted as any solution of any kind. There is no solution regarding what’s happening to us, not in the terms we usually use and think of. 6 of the 9 planetary boundaries are passed, which basically means we have at least 6 reasons to think that current mankind’s activity on the planet has the potential to make human’s livability on earth uncertain. These 6 reasons are our impacts on: climate change, ocean acidification, biogeochemical flows in the nitrogen (N) cycle and phosphorus (P) cycle, global freshwater use, land system change, the erosion of biosphere integrity, and chemical pollution.
What is the weight of ICT in those impacts? Regarding greenhouse gasses emissions leading to climate change, it’s said to weigh between 2,1 and 3,9% of global emissions in 2020. What’s most important is the trend, as projections to 2025 spoke about 6 to 8% of global emissions. Moreover, IT contributes to the pressure on natural resources, especially abiotic/mining resources (which is linked to chemical pollution), fresh water use, etc. Usage phase and associated final energy consumption might be the most important part of the carbon footprint of a server or a network equipment, if the carbon intensity of the electricity consumed is high. However, this is not true for end user devices or even a server that would run on a low carbon electricity grid. In those contexts, manufacturing represents most of the impact (you could play with Datavizta’s charts to get an idea). This being said, we are only speaking here about direct environmental impacts, or “first-order effect”, “second” and “third” order effects are a complex story that are probably the hidden, biggest part, of the iceberg.
With this introduction, better measurements of IT energy consumption is no solution, only a part of necessary research to improve our understanding of the pressure IT has on electricity grids and find insights on how to reduce it. It is far from being the only thing to do in IT. Electricity (final energy) consumption in the usage phase of ICT is not only a matter of direct environmental impacts, but also of pressure put on electricity grids in times we need to move fossil-fuel based usages to electricity-based usages.
A bit of history, measuring the energy consumption of IT resources
For years, the only way to measure the energy used by an IT server was to plug it in a wattmeter, thus having a physical device dedicated to get the power of the machine. Things got a bit better in 1998 and the appearance of IPMI as we got a way to evaluate the energy consumed by the machine from a web interface or an API. SmartPDUs were a nice improvement as well, as it permitted them to get those metrics in monitoring tools, time series databases and reporting dashboards.
Those 2 ways share a common issue, we only get the global consumption of a machine. How to decide what actions to take to reduce the power used, beyond hardware changes, UEFI/BIOS configuration and firmware updates? How to get metrics from the infrastructures that would be useful to product and development teams and, moreover, everyone who is not working in the datacenter? Another question we might ask would be : how do we know the share of each component on the machine’s power? Here comes software-based power evaluation.
Means and realms of evaluation
Let’s start with a visual overview of the different ways to evaluate a machine’s components energy consumption and the realm they cover.
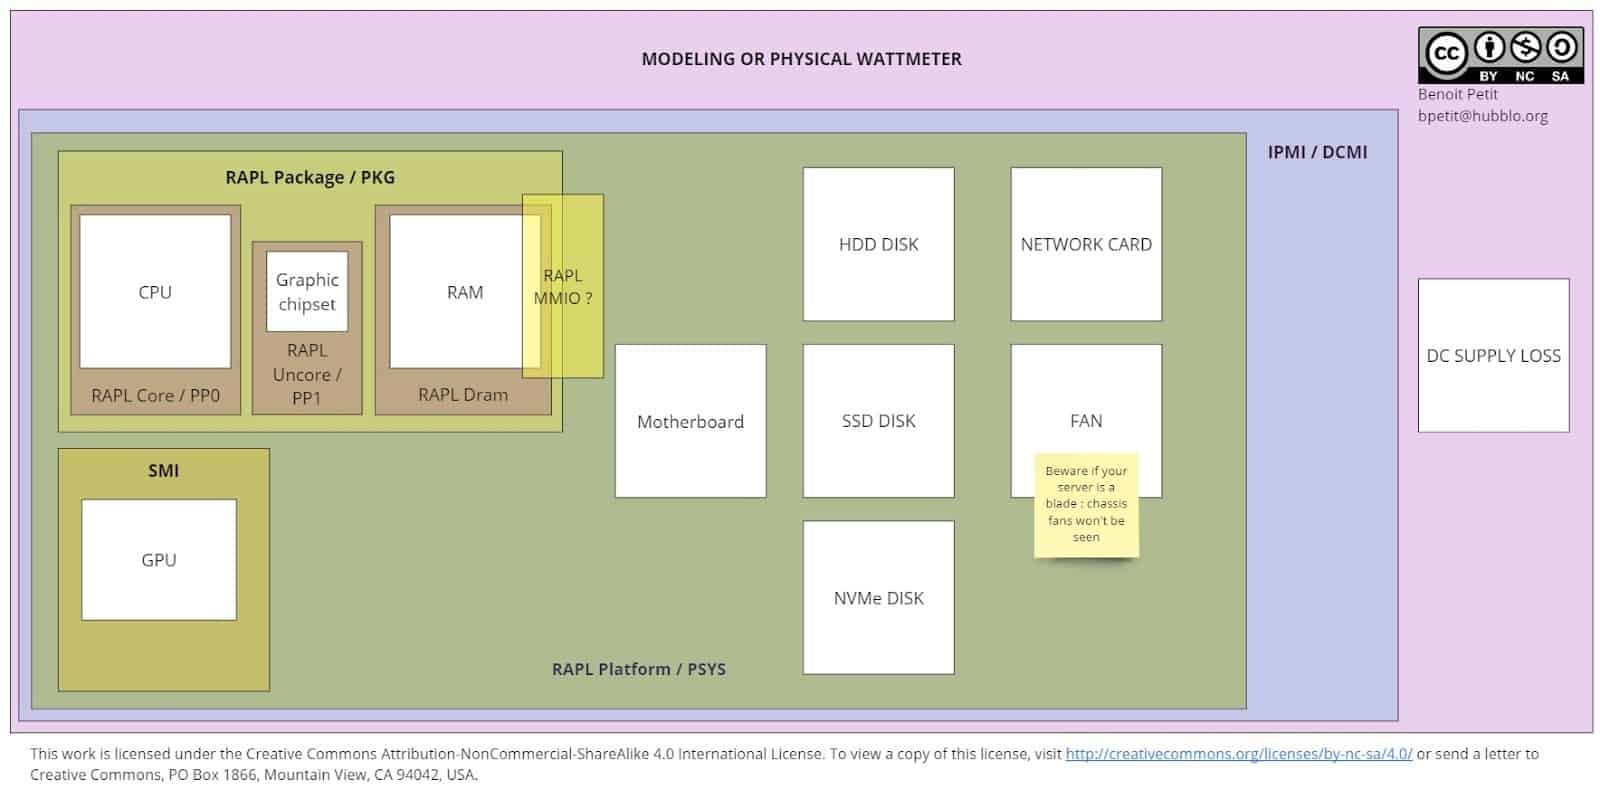
It’s important to distinguish the metrics coming from low-level sensors provided by hardware manufacturers, or coming from a measurement dedicated device like a wattmeter/smartPDU. We will call those metrics “bottom-up” or “primary”. The metrics that are actually generated through a model. To be clear, a model means a formula or an algorithm that will speculate on the actual metrics based on some primary information it has access to. We will call those metrics “estimations” or “models”. Some high-level/userland tools provide both “primary” and “estimation” metrics.
To evaluate the energy consumed by a **full server**, you might either use **a model**, or a **physical wattmeter/SmartPDU**. A model’s accuracy will depend on many parameters, as you have guessed, this is in the realm of pure estimation. A physical wattmeter, or a SmartPDU, will be (most probably) very accurate providing the whole machine power. It will also be great for evaluating the global energy consumption of a whole IT room or rack, maybe of a group of machines working for the same service, but it won’t be actionable to identify what components, applications or processes are responsible for the major part of this consumption, or to isolate the consumption of a given service differentiated from the other services running on the machines.
Another way to evaluate the energy consumed by a whole machine, on middle-end to high-end servers, are IPMI/DCMI compatible administration cards (they are called IDRAC at Dell or ILO at HPE for example). Those cards make metrics available on the network, either through a Web user interface, an HTTP API, and sometimes through a CLI tool accessible from the Host’s operating system. Depending on the implementation, you might have enough detail to know if the DC supply loss is accounted for in the “total” power measured. I couldn’t personally find or build a review of the different vendors’ administration cards power evaluation methods. It seems they are all based on primary data at a first look, but more tests seem to indicate this is not the case for all vendors…
Going deeper to get per-components power will feel a bit trickier. CPUs of x86 (x86_64) architectures, from Intel and AMD, built after 2012 (later for AMD), will most probably provide a feature called RAPL, for Running Average Power Limit. This feature enables softwares from the userland to set power limits on the CPU, the RAM and the integrated/packaged GPU. As it enables power capping, it enables power monitoring, for those components. We will see in the dedicated section that this is true for the “historic” version of RAPL and the realm it covers will vary with newer CPUs, in the dedicated session “a RAPL survival guide”.
ARM CPU’s don’t provide a feature like RAPL, until recently. I’ve read documentation that seem to indicate very recent ARM boards to have something similar, but couldn’t test this theory yet. Nvidia GPUs power can be measured with nvidia SMI. At the time of writing, I’m not aware of the equivalent feature for AMD GPUs (but if you do, please contact me !).
Software evaluation biases and improvements to come
While software evaluation tools are a great addition to the conscious IT practitioner toolbox, none of them is a perfect solution that covers all use cases. A combined approach is certainly necessary to have both a complete and a precise view of an infrastructure power usage.
Powercap is nice, no equivalent on windows ?
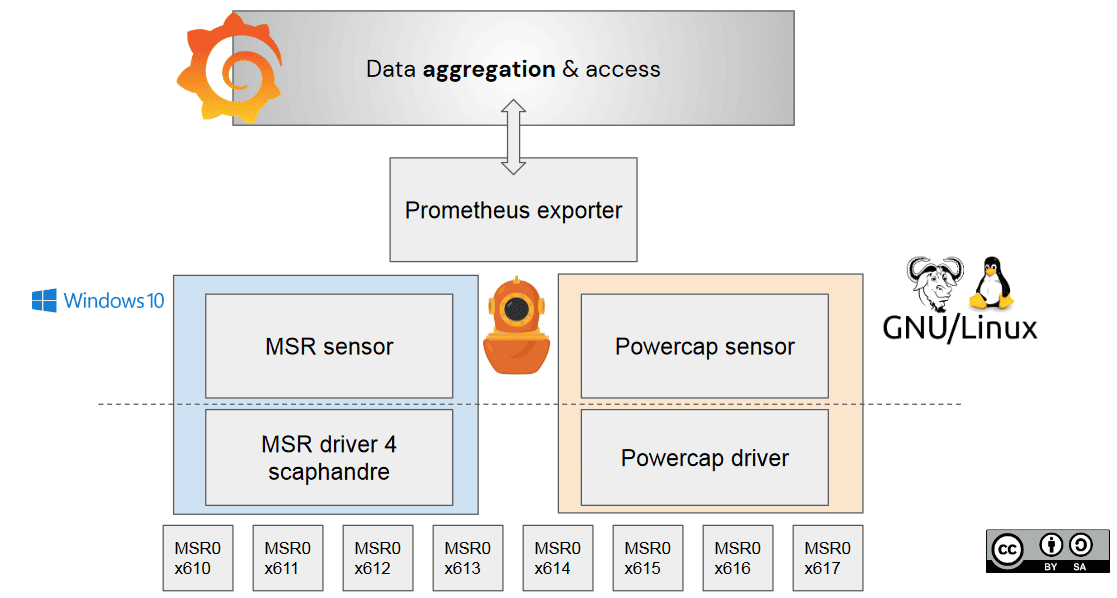
Having access to the right sensor is necessary, but not enough. We have experienced that, building Windows support in Scaphandre. On GNU/Linux, having access to RAPL metrics from userland is easy, thanks to the Powercap framework and kernel module. Interesting metrics are available in the /sys/class/powercap folder, one folder per CPU socket (physical CPU package) containing the energy consumed by PKG, another per RAPL Domain (Core, Uncore, or Dram) for each socket. In the case of PSYS and MMIO domains, they have a dedicated folder. Everything is a file, the Unix way, so everything is simple.
In the Windows world, each solution we have found that reads RAPL metrics (Intel Power Gadget and CPU-Z) have their own drivers. It’s needed to have a driver in kernel mode (which powercap and sysfs abstract us from, in the Linux world), as the __readmsr instruction is in kernel mode, so we wrote one. For the record, MSR stands for Model Specific Register, those are the CPU registers storing RAPL metrics.
Once you get metrics from the driver, you also need to ensure you query those metrics for the right CPU-socket, cpu core-pinning is required if you want to address bi-socket or quad-socket machines.
A RAPL survival guide
As it is an interface used by many power evaluation pieces of software, RAPL became famous in some IT and ESG circles. It seems to me that it is still sometimes misunderstood. The accuracy of RAPL and the perimeter it covers are two different topics.
According to my review of the literature, RAPL **is accurate**, starting from it’s **second generation** (post-Broadwell), but it is **not** covering a **complete** perimeter. As you have seen in the schema, “Package”, or “Pkg”, only includes the CPU (Core), the Ram (DRAM) and integrated GPU (Uncore) power. Comparing Pkg to an IPMI/DCMI-based or a SmartPDU-based evaluation will be likely disappointing if you look at energy consumed on a decent time-period. They are supposed to be closer as you look for times where the CPU is most active, and more different as the machine is close to idle.
RAPL gets a bit more **complete** regarding power measurements coming from its PSYS (or “Platform”) domain, which is available on post-Skylake CPUs and provides the whole motherboard or System On Chip (and connected components) power, according to the documentation. We are still experimenting with those metrics as it will be implemented in Scaphandre 1.0. Part of our future work is to document its behavior better, depending on the hardware available on the board.
As PSYS concerns pretty recent machines, this is not likely to be a perfect solution for a full infrastructure. In addition, please keep in mind that, despite usual sayings, it is usually **not** a sustainable strategy to replace existing IT servers by new ones. While newer machines could be more power-efficient, the impact of their manufacturing (regarding, GHG emissions, Abiotic Resources Depletion, …) certainly hinders the expected impact “savings” (this is debatable depending on the context, exact hardware configuration and service location). In this regard, realizing that new machines have better measurement capacities could tempt one to have a more modern infrastructure, I strongly encourage you to **not** do such a thing.
What about the MMIO domain ? This seems to be related to memory input and output activity. We are experimenting with it these days, will make it available (as a specific label) in Scaphandre 1.0 and hope to document it better in a near future.
In addition, you might also discover that depending on the userland tool you rely on to get those metrics, the way those metrics are provided may change. There is also a lot to say here, but that should be the topic of another blog post on hubblo.org. For Scaphandre, we are now feeding a compatibility page. You might find generic RAPL-related useful information there as well.
Last but not least, while using RAPL metrics could feel empowering as you have a pretty precise view on your machine’s components energy consumption, there is a catch. It should be said that this consumption profile will likely to be very specific to your hardware **and** configuration. The runtime context of a given software or service is also essential if you want to assess its energy consumption. Depending on its runtime, whether it’s running natively, in a virtual machine (hypervisor configuration will also be important then), or in a container and depending on the other services running on the physical host and their behavior, the evaluation may be more or less impacted. Moreover, from one machine to another, even if the hardware is the same, you may have a closer look to (at least): hyper threading, turbo boost, energy efficiency mode, …
Conclusion
As you may have understood, we are far from having everything we need to get both a precise and complete understanding of a server’s energy consumption, thus to optimize everything we could to reduce it. So what could we do? How could we match the gap between accurate, global energy consumption metrics coming from SmartPDUs and smaller-grain, incomplete, evaluations of per-component or per-process power usage?
As you might have guessed, we will need to build and use power estimation models in addition to primary data measurements. Even if manufacturers provide a more and more complete set of sensors, older IT equipment is not likely to disappear, and I don’t think relying on hardware innovation only is the key (it has proved not to be).
The road to get more generic, complete but accurate-enough models to get a machine’s power without any physical device or sensor available is, to our knowledge, first composed of a better understanding and documentation of the existing ways to evaluate power. Second, we’ll need detailed, hardware-specific data, to then provide models that allow power evaluation in different or more difficult contexts, including but not limited to : IoT, old hardware, Public Cloud IaaS (this one will need more complementary work already started in Boavizta).
To get those metrics, we need you. We need to get more data, from more diverse machines and hardware configurations, either running benchmarks on them or collecting those metrics as passively as possible while they operate as usual. You could help us with that through the Energizta project.
In addition to helping us with the Energizta project, do not hesitate to contact us about any imprecisions or suggestions you might find relevant, regarding this post. This is open and collaborative knowledge building. We know we might understand things wrong, that this is a biased presentation of the topic, that there is a lot more to do, and we want to do it with every person who wants to help.
Bio
Benoit Petit, co-founder of Hubblo, a consultancy and open-source editor company for ICT environmental impacts evaluation and reduction. In this regard, I’m also a maintainer of Scaphandre, the open-source energy monitoring agent described in this post. I’m also a contributor to Boavizta, a non-profit organization encouraging collaboration of private and public organizations through digital commons, for making ICT compatible with planetary boundaries.
Thanks
I’d like to thank Victorien Molle for his great contribution to the Windows driver Scaphandre relies on, Guillaume Subiron for his amazing work on Energizta, the great Scaphandre contributors community, David Ekchajzer, Leonard Pahlke and Guillaume Subiron again for their reviews of this blog post.
Sources
https://en.wikipedia.org/wiki/Planetary_boundaries
https://www.cell.com/patterns/fulltext/S2666-3899%2821%2900188-4
https://link.springer.com/chapter/10.1007/978-3-319-09228-7_1
https://developer.nvidia.com/nvidia-system-management-interface
https://hubblo-org.github.io/scaphandre-documentation/explanations/rapl-domains.html
https://hubblo-org.github.io/scaphandre-documentation/compatibility.html
https://github.com/hubblo-org/windows-rapl-driver/