

Guest post originally published on Afzal Ansari’s Blog by Afzal Ansari
What if you didn’t find the information by searching through the documentation when you didn’t understand it beforehand in a complex environment? You’d get stuck. You are right, this article makes it easier by reducing the complexity of an end user. You can obtain a clear map of how things interact with each other in a visual way. This allows you to take full advantage of grasping Jaeger’s flexibility with OpenTelemetry. In this article, we will cover in detail how to improve the efficiency and cost of running workloads in Kubernetes in a simplified way.
OpenTelemetry is an open-source observability framework that provides standardized APIs and components for collecting and exporting telemetry data.
Here are some examples of standardized APIs and components in OpenTelemetry: Instrumentation Libraries: OpenTelemetry offers instrumentation libraries for popular programming languages like Java, Python, and Go, and others like OpenTelemetry-GO SDK for Go applications. These libraries provide standardized APIs for adding instrumentation to applications. For example, OpenTelemetry provides APIs for capturing traces, recording metrics, and capturing contextual information.
Tracing API: OpenTelemetry defines a standardized tracing API that allows developers to capture and propagate distributed traces across different components of a system. The tracing API includes methods for creating spans, adding attributes and events to spans, and managing context propagation.
Metrics API: OpenTelemetry provides a standardized metrics API for collecting and exporting metric data. It offers methods for defining and recording various types of metrics, such as counters, gauges, histograms, and summaries.
Context Propagation: OpenTelemetry defines a standardized context propagation mechanism that allows contextual information to be carried across different service boundaries. This context propagation ensures that trace and context information is passed between components of a distributed system, enabling end-to-end observability.
OpenTelemetry SDKs: OpenTelemetry SDKs (Software Development Kits) provide implementation-specific libraries and components that facilitate the usage of OpenTelemetry APIs. The SDKs include exporters to send telemetry data to various backend systems, processors for transforming and enriching data, and other utility components.
Exporters: OpenTelemetry supports a wide range of exporters that allow telemetry data to be sent to different backend systems for storage, analysis, and visualization. Examples of supported exporters include Jaeger(deprecated), Prometheus, Zipkin, Elasticsearch, and more. These exporters provide a consistent way to export telemetry data across different observability tools and platforms.
OpenTelemetry Collectors: OpenTelemetry Collectors are components that receive telemetry data from applications and systems and perform tasks such as aggregation, filtering, and exporting. These collectors enable centralized management and processing of telemetry data before it is sent to backend systems.
How an application is instrumented
Let’s understand the easy way; When an application is instrumented with OpenTelemetry SDKs, it starts generating telemetry data, including distributed traces. The SDKs collect this data and provide integration with different exporters. In the case of Jaeger, the OpenTelemetry SDKs can directly send telemetry data to the Jaeger Collectors.
Here’s how the flow works:
Instrumentation: Developers use OpenTelemetry SDKs to instrument their applications. This involves adding code to capture telemetry data, such as distributed traces, metrics, and logs.
Data Collection: The OpenTelemetry SDKs collect telemetry data from the instrumented application. This includes capturing traces that represent the flow of requests across various components in a distributed system.
Jaeger Collectors: The Jaeger Collectors receive the telemetry data from the OpenTelemetry SDKs. They act as intermediate components responsible for processing the data for validation and clean-up/enrichment.
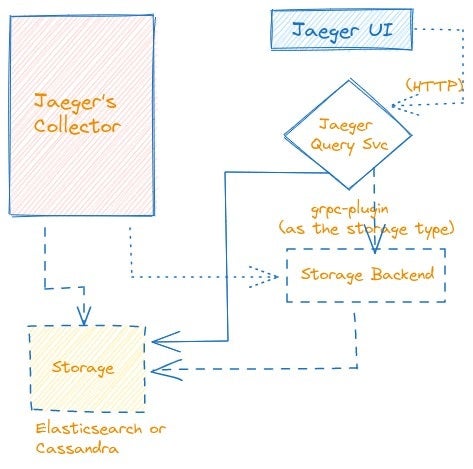
Jaeger Storage Backend: Jaeger supports multiple storage backends such as Elasticsearch, Cassandra, etc., that provide the underlying infrastructure for persisting and querying trace data. After the Jaeger Collectors receive the telemetry data, they forward it to the Storage Backend, which is responsible for storing and retrieving the collected traces to analyze and visualize distributed traces in the Jaeger UI or other monitoring tools.
Jaeger Query Service: Jaeger Query is a service that exposes the APIs for retrieving traces from storage and hosts a Web UI for querying and analyzing trace data. It enables users to explore and gain insights into the behaviour, performance, and dependencies of their distributed systems based on the collected traces. For example, a trace can be retrieved via GET request to https://jaeger-query:16686/api/traces/{trace-id-hex-string}
How the OTEL collector bypasses sampling requests and its different modes of deployments
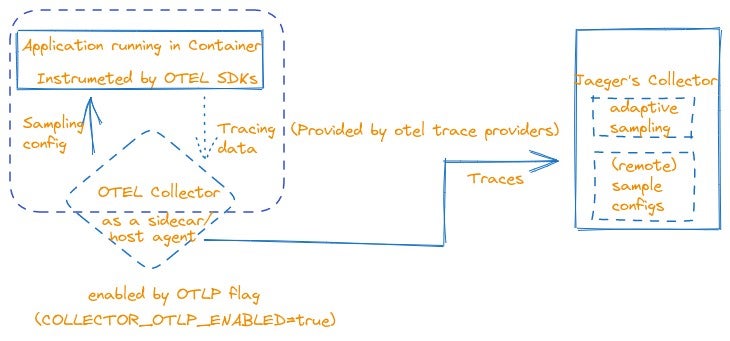
When the instrumented applications generate sampling requests, they send those requests to the OpenTelemetry(OTEL) Collector instead of directly communicating with the Jaeger backend components. The OpenTelemetry Collector receives these sampling requests from the applications and then forwards them to the Jaeger backend on behalf of the applications. In this proxy setup, the OpenTelemetry Collector handles the communication between the applications and the Jaeger backend. It takes care of transmitting the sampling requests from the applications to the backend and relaying the responses back to the applications.
By placing the OpenTelemetry Collectors between the OpenTelemetry SDKs and the Jaeger Collectors, the capabilities of the collectors can be leveraged to perform additional processing on the trace data, integrate it with other telemetry data sources, and apply custom logic. This setup allows for more advanced trace data management and analysis before it reaches the Jaeger tracing system.
OpenTelemetry Collectors can be deployed in different modes depending on the specific requirements and architecture of your application and infrastructure.
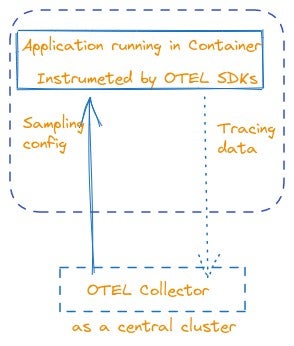
e.g. Central Cluster deployment
Here are three common deployment options for OpenTelemetry Collectors:
Application Sidecar: In this deployment mode, the OpenTelemetry Collector is deployed as a sidecar container alongside your application containers within the same pod or deployment unit. The sidecar pattern allows the collector to collect telemetry data directly from the application without requiring any modifications to the application code. The sidecar container receives telemetry data from the application and performs tasks such as aggregation, filtering, and exporting. It can then forward the processed data to the desired backend systems, including the Jaeger Collectors.
Host Agent / Daemon: For such mode, the OpenTelemetry Collector is installed and runs as a standalone process on the host machine or as a background service. The collector acts as an agent or daemon that runs alongside your applications on the host. It can collect telemetry data from multiple applications running on the same host and perform aggregation, filtering, and exporting tasks. The collector can then send the processed data to the Jaeger Collectors or other backend systems.
Central Cluster: In this mode, the OpenTelemetry Collector is deployed as a centralized cluster of collector instances that receive telemetry data from various applications and systems across your infrastructure illustrated below. This deployment pattern is suitable for large-scale environments where you have multiple applications distributed across different hosts or clusters. The central cluster of collectors collects telemetry data from the applications and performs aggregation, filtering, and exporting. It can handle the processing and forwarding of telemetry data to the Jaeger Collectors or other backend systems. The central cluster deployment mode provides a scalable and centralized approach to collecting and managing telemetry data across your infrastructure.
How Jaeger Collectors work together with other components
The Jaeger Collectors are many instances of jaeger-collector that can be run in parallel running them through a processing pipeline for validation and clean-up/enrichment and stored in a storage backend. Jaeger comes with built-in support for several storage backends, as well as extensible plugin frameworks for implementing custom storage plugins as described in the docs.
Here is the flow of Jaeger Collectors process the tracing data:
Data Reception: The Jaeger Collectors act as the entry point for tracing data into the Jaeger system.
Data Processing: Once the Jaeger Collectors receive the telemetry data, they perform essential processing tasks. This can include decoding, validating, and parsing the received data to extract the individual spans that make up the trace. The Collectors also handle any necessary transformations or enrichment of the data as per the configuration.
Storage and Indexing: After processing the telemetry data, the Jaeger Collectors store the extracted traces in a suitable storage backend, such as Elasticsearch or Cassandra. The Collectors ensure that the traces are efficiently indexed and organized to enable fast and effective querying and retrieval.
Sampling: The Jaeger Collectors can apply sampling strategies to control the amount of trace data stored and analyzed. They can employ different sampling techniques, including probabilistic sampling or adaptive sampling serving its policies at /api/sampling, to determine which traces should be stored based on predefined rules or dynamic conditions.
Exporting: In addition to storing the trace data, the Jaeger Collectors can also export the processed traces to external systems or exporters for integration with other monitoring or observability platforms. Accepts spans directly from clients in jaeger.thrift format via UDP with binary thrift protocol (POST to /api/traces) (deprecated as supported by OTEL SDKs) and in OpenTelemetry OTLP format if –collector.otlp.enabled=true. This allows the collected trace data to be leveraged by various tools and applications beyond the Jaeger system itself e.g. jaeger-remote-storage
Conclusion
In conclusion, we’ve explored three key aspects related to distributed tracing, focusing on the instrumentation of applications, the OpenTelemetry (OTEL) Collector’s role in managing sampling requests and its deployment modes, and the collaborative function of Jaeger Collectors within the broader tracing ecosystem.
https://www.jaegertracing.io/docs/1.46/architecture/#with-opentelemetry