
Member post by Nathan Wade, ScoutAPM
Overview of Apollo Link
Apollo Link is a set of tools that includes aides intended to address frequent issues that may arise between the Apollo Client on your frontend application and the GraphQL API server on your backend.
The Apollo team has explained that varied requirements for a GraphQL client library has made it near impossible to add all of the needed functionality to the Apollo Client core. To solve this problem Apollo Link was created. This allows the community to create customized versions of Apollo Client to satisfy their specific GraphQL Client needs, providing middleware hooks.
OpenTelemetry and Apollo Link
In order to make a system observable, it must be instrumented. We will use the javascript OpenTelemetry SDK to capture custom trace data surrounding GraphQL calls. We can do this with a small piece of manual instrumentation. Apollo Link provides us with the tools to instrument our GraphQL calls.
```
           /‾ Initiated ‾\    /‾ Initiated ‾\            /‾ Request  ‾\
GQL Operation             Link             Terminating Link          GQL Server
      \_ Completed _/    \_ Completed _/            \_ Response _/
```
Apollo Link allows us to wrap middleware around the GraphQL request cycle in two places, one pre- and one post-request. We define functions that receive the context object of the request, which contains information about the GraphQL operation being invoked. Our post-request hook will have access to the raw response data as well.
With these two hooks, we can capture a great deal of information about the request being made and the outcome. In OpenTelemetry, a unit of work like this is captured as a discrete Span. So,
the first link in our chain should create a new Span. We will call it our CreateSpan link. This will give us a complete picture of this request and response.
```ts
// Create Span Link
import { trace, SpanKind } from "@opentelemetry/api";
// ...
export const createSpanLink = new ApolloLink((operation, forward) => {
	const tracer = trace.getTracer("@apollo/client");
	const span = tracer.startSpan(`gql.${operation.operationName}`, {
		startTime: operation.getContext().start,
		attributes: {
			user.id: myUser.id,
			// ... other attributes
		},
		kind: SpanKind.INTERNAL, // 0: Internal, 1: Server, 2: Client, 3: Producer, 4: Consume
	});
	operation.setContext({ span });
	return forward(operation).map((data) => {
		span.end();
		return data;
	});
});
```
In the example, we create a new ApolloLink() and inside we create a tracer and span. We use operation.setContext() to make sure that the same span can be called on each link as needed with operation.getContext().span. The return of all Links gets called once the GQL server has sent a response. This allows us to use span.end() verifying the completed round trip.
Our chain would now effectively look like this:
```
            /‾ Initiated ‾\          /‾ Request  ‾\
GQL Operation               CreateSpan              GQL Server
	         \_ Completed _/          \_ Response _/
```
Adding functionality to record exceptions
Now, there will be instances where there is a GQLError or NetworkError during the trip. Luckily, Apollo Link already has a built-in solution to exception handling with the onError() link. A simple setup may look something like this:
```ts
// Create Error Link
import { onError } from "@apollo/client/link/error";
export const errorLink = onError(
	({ graphQLErrors, networkErrors, operation }) => {
		if (graphQLErrors) console.log(graphQLErrors);
		if (networkErrors) console.log(networkErrors);
	}
);
```
We now want to add context to our onError() link in order to give our span more information into what’s happening during an error. OpenTelemetry spans have a special function for recording exceptions using span.recordException(). This function accepts either: an object with 1-4 optional keys (code, message, name, and stack) or a string. We can also set the status code with span.setStatus() which takes a SpanStatusCode as a parameter. Here is an example:
```ts
// Create Error Link
import { onError } from "@apollo/client/link/error";
import { SpanStatusCode } from "@opentelemetry/api";
export const errorLink = onError(
({ graphQLErrors, networkError, operation }) => {
const span = operation.getContext().span;
span.setStatus({ code: SpanStatusCode.ERROR });
if (graphQLErrors) {
graphQLErrors.forEach(({ message, locations, path }) => {
span.recordException({
message: `[GraphQL error]: Message: ${message}, Location: ${locations}, Path: ${path}`,
});
});
span.end();
}
if (networkError) {
span.recordException({
message: `[Network error]: ${networkError}`,
});
span.end();
}
}
);
```In this example, there are three important parts:
1. We set the status to SpanStatusCode.ERROR
2. We used span.recordException() to add the error to the span
3. We triggered span.end() to complete this span
It is recommended in the Apollo Link documentation that the onError() link be added to the start of your chain. However, since we want our CreateSpanLink to observe our entire chain so it makes sense to add this link second. Our completed chain should look something like this:
```
	       /‾ Initiated ‾\      /‾ Initiated ‾\        /‾ Request  ‾\
GQL Operation           CreateSpan            onErrorLink           GQL Server
		   \_ Completed _/      \_ Completed _/        \_ Response _/
```
Visualizing ApolloLink Traces in TelemetryHub
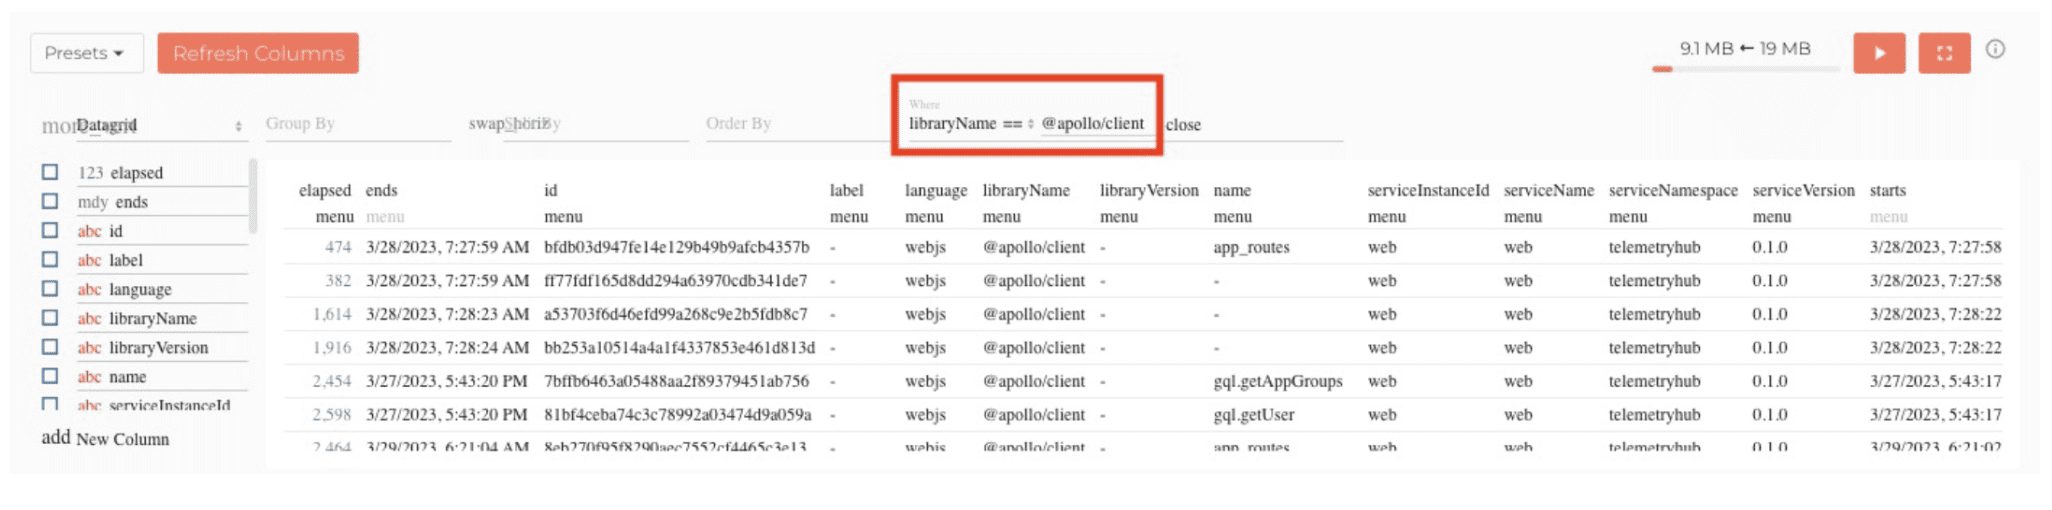
Now that we have traces and spans that observe our GraphQL calls, we can easily visualize them in TelemetryHub. Navigate to the Traces tab in the app, and in the perspective table at the bottom of the page, we can filter out all traces to show the new ApolloLink traces by using the Where filtering function: where LibraryName == @apollo/client.
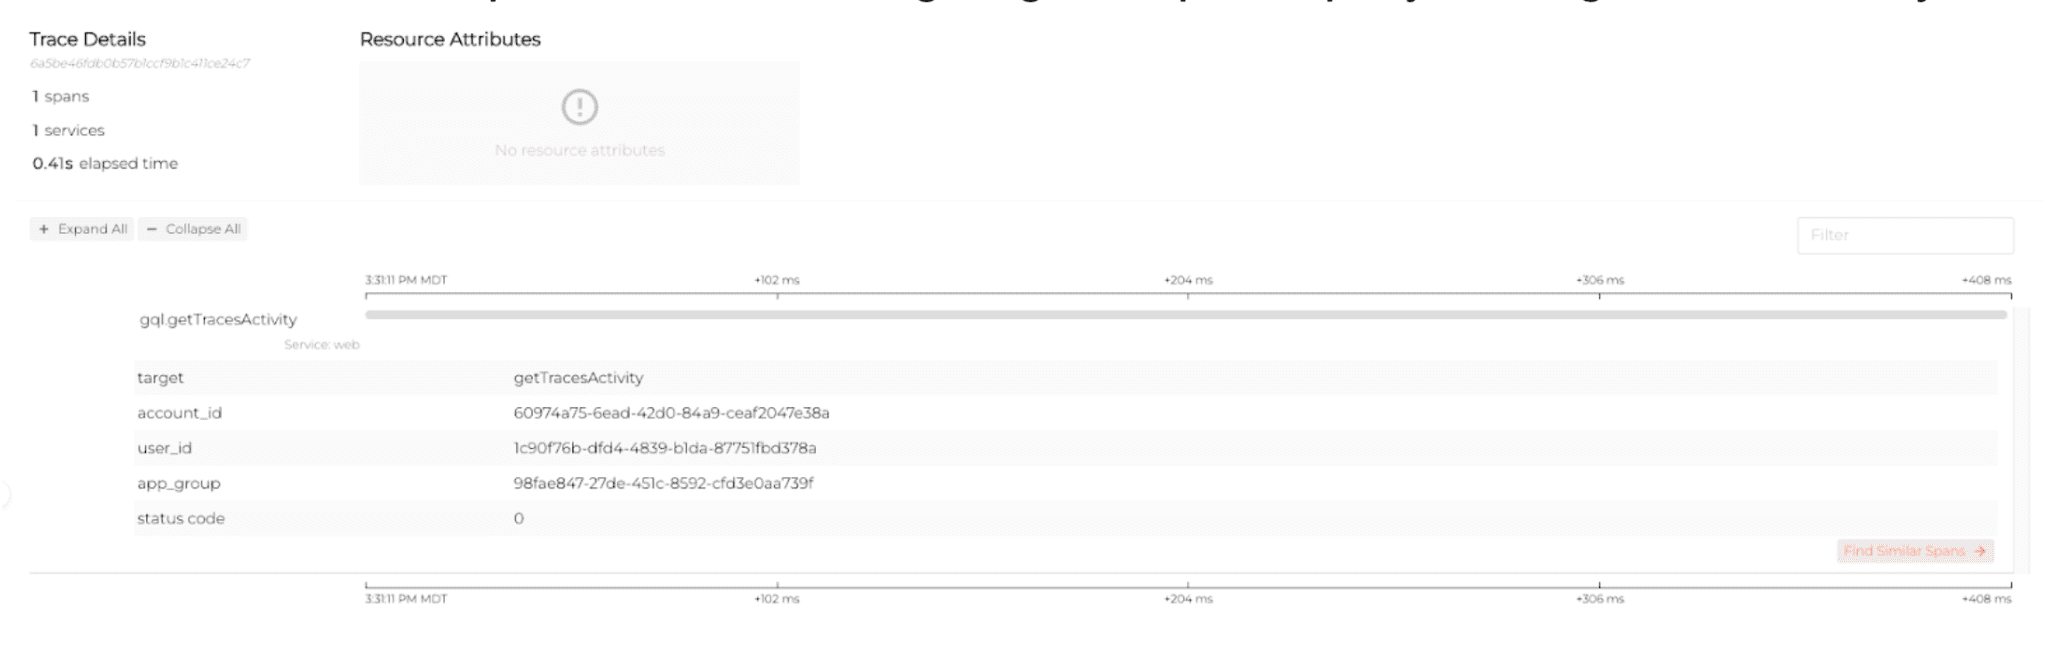
From there, we are able to investigate each individual trace with the information we set up earlier. Here’s an example of a trace investigating a GraphQL query called getTracesActivity:
Completed Setup
```ts
import {
  ApolloClient,
  ApolloLink,
} from "@apollo/client/core";
import { trace, SpanKind } from "@opentelemetry/api";
import { onError } from "@apollo/client/link/error";
import { SpanStatusCode } from "@opentelemetry/api";

// Create Span Link
export const createSpanLink = new ApolloLink((operation, forward) => {
	const tracer = trace.getTracer("@apollo/client");
	const span = tracer.startSpan(`gql.${operation.operationName}`, {
		startTime: operation.getContext().start,
		attributes: {
			user.id: myUser.id,
			// ... other attributes
		},
		kind: SpanKind.INTERNAL, // 0: Internal, 1: Server, 2: Client, 3: Producer, 4: Consumer
	});
	operation.setContext({ span });
	return forward(operation).map((data) => {
		span.end();
		return data;
	});
});

// Create Error Link
export const errorLink = onError(
	({ graphQLErrors, networkError, operation }) => {
	    const span = operation.getContext().span;
		span.setStatus({ code: SpanStatusCode.ERROR });
		if (graphQLErrors) {
			graphQLErrors.forEach(({ message, locations, path }) => {
				span.recordException({
					message: `[GraphQL error]: Message: ${message}, Location: ${locations}, Path: ${path}`,
				});
			});
			span.end();
		}

		if (networkError) {
			span.recordException({
				message: `[Network error]: ${networkError}`,
			});
			span.end();
		}
	}
);

const apolloClient = new ApolloClient({
  link: from([
    createSpanLink,
    errorLink,
  ]),
});
export default apolloClient;
```