Member post originally published on the InfluxData blog by Jay Clifford
Earlier this year, I had the pleasure of speaking at the Open Source Summit North America. When choosing a topic, I felt it was time to return to our roots and discuss the subject that originally put InfluxDB on the map: infrastructure monitoring.
What was especially exciting was the opportunity to showcase the new capabilities of InfluxDB 3.0 to the open source community and explain their significance for the future of infrastructure monitoring use cases.
This blog breaks down the key points from that presentation and delves deeper into those topics, offering further insights and discussion.
Monitoring vs observability
InfluxDB has the ability to tackle both monitoring and observability use cases. 3.0 not only improves the performance of both but also makes Observability use cases viable at scale. Before we jump into the details, let’s level set and discuss what exactly the difference is between monitoring and observability:
Monitoring:
Monitoring involves the collection and analysis of metrics, logs, and events to keep track of system performance. Using predefined rules and thresholds, the monitoring process detects potential issues and generates alerts when threshold breaches occur, thereby helping to maintain system health. You can apply this approach across various types of infrastructure, in both the physical and the digital realms.
Observability:
Observability takes monitoring a step further to include the instrumentation of both code and infrastructure to expose pertinent data. This empowers teams to deeply understand the behavior of their systems. By correlating data from diverse sources, it facilitates the diagnosis of issues and the identification of root causes. This, in turn, provides actionable insights for effective problem-solving. Tracing, which maps the journey of requests or transactions through components of a system, is the quintessential observability tool.
At a glance, monitoring and observability might appear to serve the same purpose, but they approach system health from distinct angles. Monitoring is proactive, setting predefined rules and thresholds to ensure systems are operating within desired parameters. It’s about ensuring everything is “on track” and alerting when it’s not. On the other hand, observability is more diagnostic in nature. It’s about understanding “why” something happened and drilling down into system behavior. While both aim to maintain system health and performance, monitoring is more about detecting known issues, whereas observability focuses on exploring unknown issues. However, in the landscape of modern system management, they are complementary. Together, they provide a holistic view of system health, performance, and behavior, ensuring both robustness and resilience.
Monitoring and observability fields
We can further categorize these concepts into several distinct fields, each with its specific focus and application:
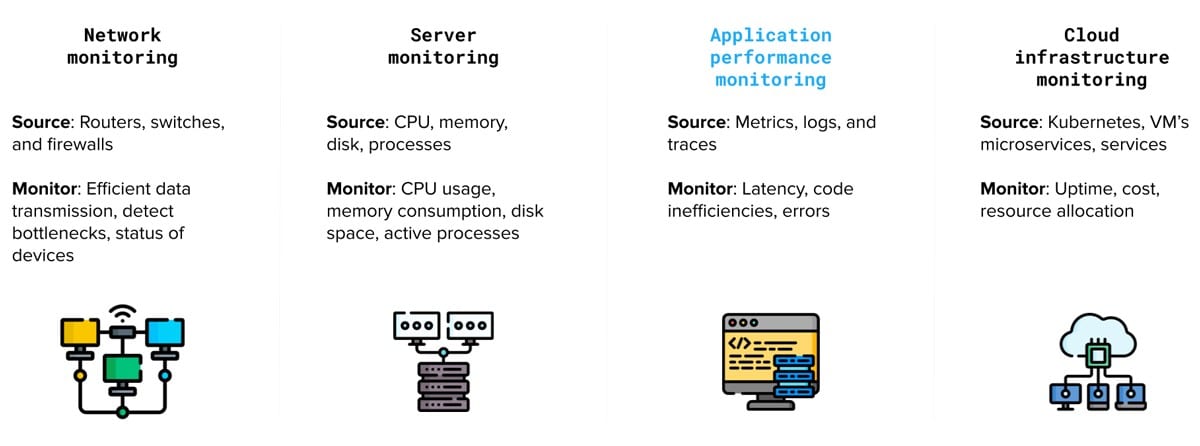
Network monitoring: Observing the performance of network components such as routers, switches, and firewalls to ensure efficient data transmission, detect bottlenecks, and identify security threats.
Server monitoring: Tracking the performance and availability of physical or virtual servers, including CPU usage, memory consumption, disk space, and response times, to ensure optimal performance and reduce downtime.
Application performance monitoring (APM): Monitoring the performance of software applications to identify issues, bottlenecks, and inefficiencies in the code, databases, or infrastructure components. (Application performance monitoring has been highlighted in blue as it can also fall into the realm of observability which we will cover later on).
Cloud infrastructure monitoring: Tracking the performance and availability of cloud-based services, such as virtual machines, storage, and databases, to optimize resource allocation and minimize costs.
A problem to solve
Now, onto the fun part! I always find that when you have a problem to solve, it is easier to do so if you first learn about the solution you wish to employ. Let’s ask ChatGPT to create an infrastructure problem which involves creating a solution to monitoring each field we discussed earlier.
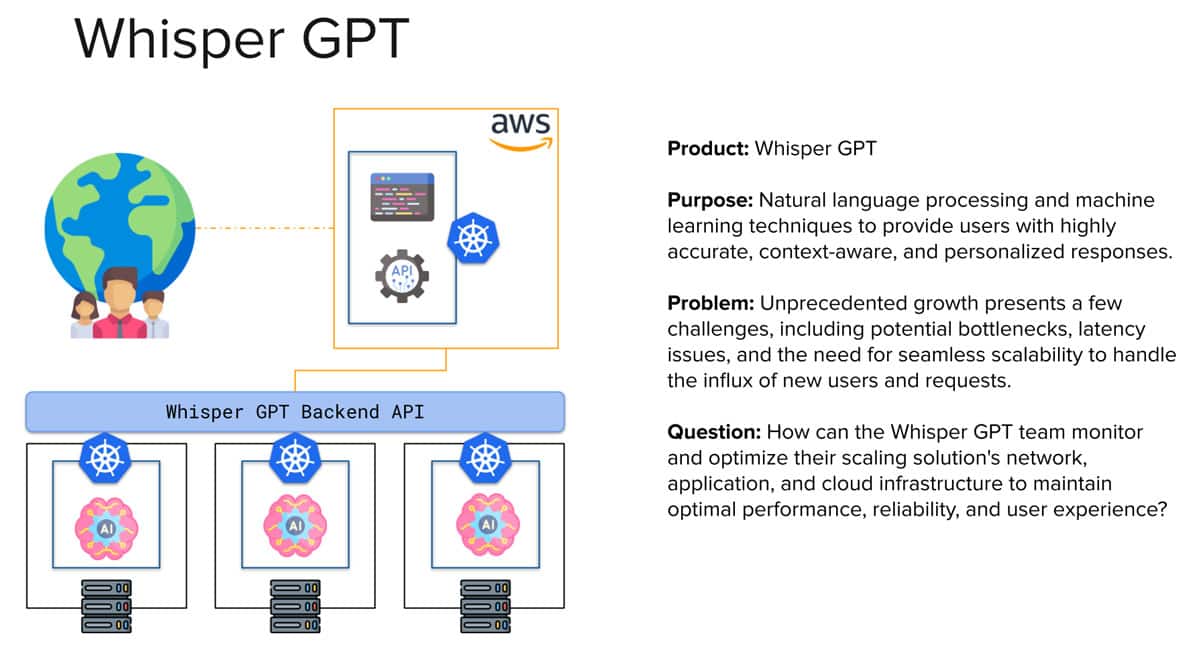
So based on this problem, we can break the architecture down into our monitoring and observability subfields:
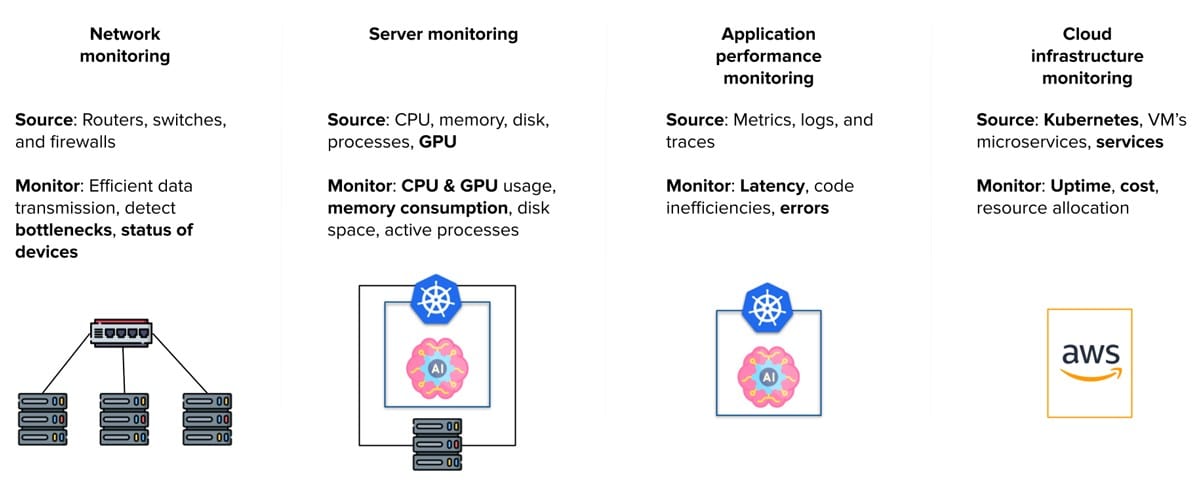
Network monitoring: Monitor network traffic, especially requests to models.
Server monitoring: Track the performance of Whisper GPT servers hosting their primary models, focusing on CPU and GPU metrics.
Application performance monitoring (APM): This encompasses two aspects:
- Monitoring our Kubernetes cluster on barebone infrastructure.
- Providing developers with tools to proactively analyze code within the Whisper platform.
Cloud infrastructure monitoring: Utilize services like App Runner or Amazon EKS for front-end management.
Solving the problem
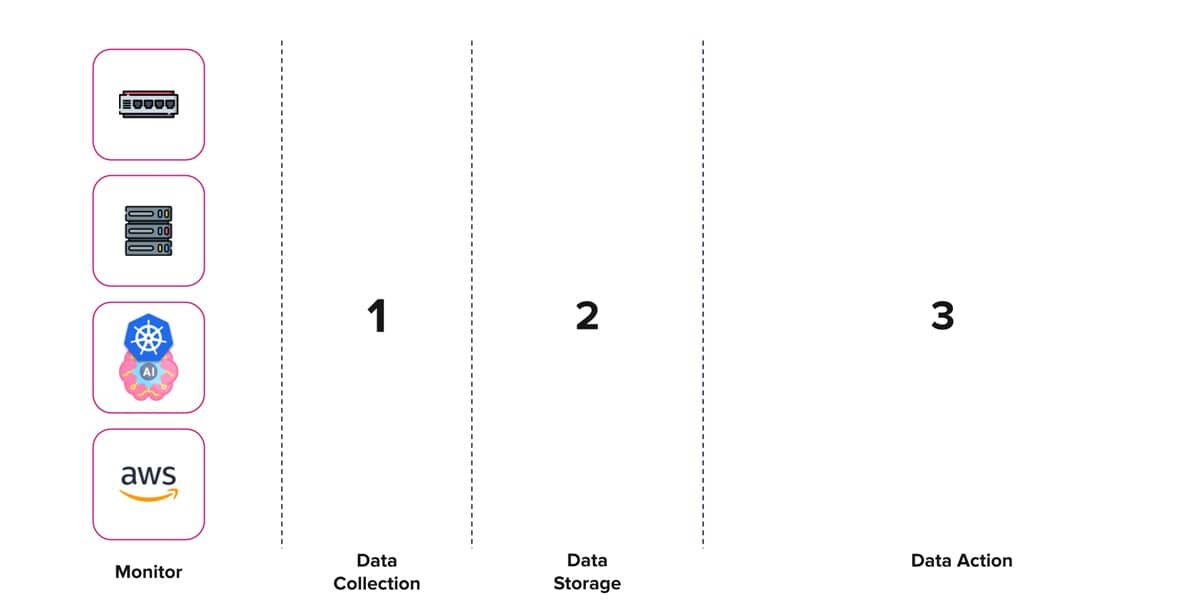
Now, I am going to show you how we can tackle each of these problems using the TIG stack (Telegraf, InfluxDB 3.0 and Grafana) and OpenTelemetry. Before we get ahead of ourselves let’s start by creating an architectural blueprint.
Data collection
Telegraf is our go-to open source data collection agent designed specifically for gathering metrics and events. Equipped with more than 300 plugins for both ingesting, transforming, and outputting data, it is a versatile agent for time series data. The community refers to it as the Swiss army knife of monitoring and observability data collection due to its ability to deploy both pull and push collection methods based on the plugin’s use. It is also equipped to handle the parsing of a considerable number of data formats, including Prometheus, JSON, XML, CSV, and many more.
Let’s take a look at some of the plugins we might use to solve our Whisper GPT problem:
| Field | Plugins |
| Network monitoring | gNMI Net SNMP |
| Server monitoring | CPU Disk Diskio Mem Processes Nvidia SMI System |
| APM | Kubernetes Inventory Kubernetes OpenTelemetry Prometheus |
| Cloud infrastructure monitoring | CloudWatch Kubernetes Inventory Kubernetes |
By design, Telegraf acts like a data pipeline that you can route through different plugins to process and aggregate the data before reaching its final output. The following architecture diagram visualizes this nicely.
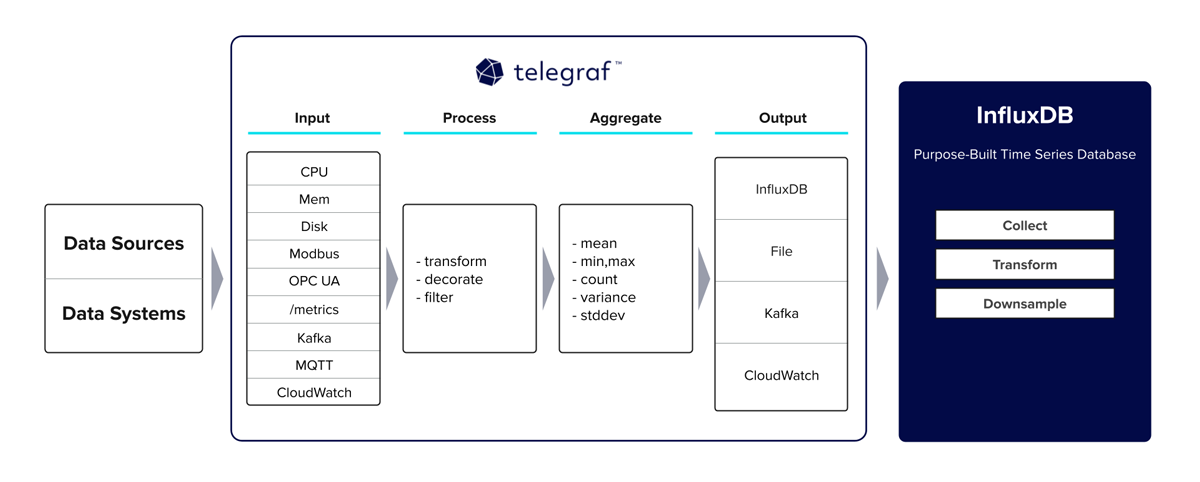
At this point of the presentation, I delved into Telegraf best practices and initial deployment. I highly recommend checking out our InfluxDB University course on Telegraf to learn more about this part.
Data storage
Having checked data collection off our list, now let’s move on to establishing the keystone within our infrastructure monitoring architecture… data storage.
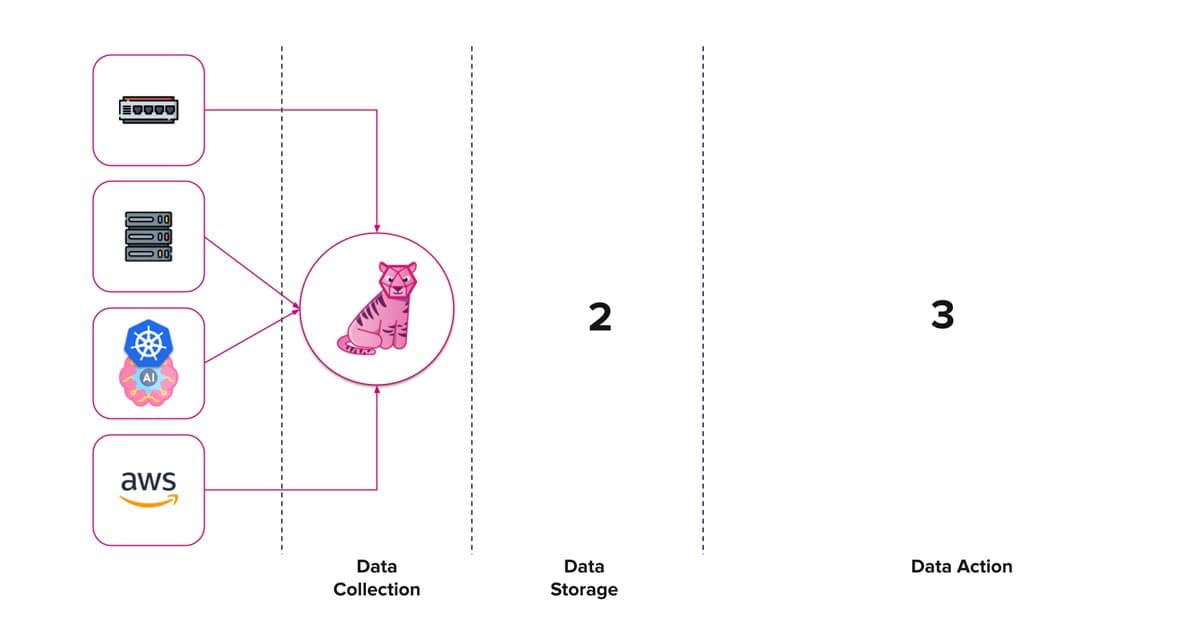
InfluxDB 3.0 is a purpose-built time series database built for handling metrics, traces, and logs at a massive scale for real-time analytics. This is driven by the three core open source technologies we use to create our database engine: Apache Arrow, Parquet and DataFusion. If you would like to learn more about how we deploy these technologies, I highly recommend checking out this blog.
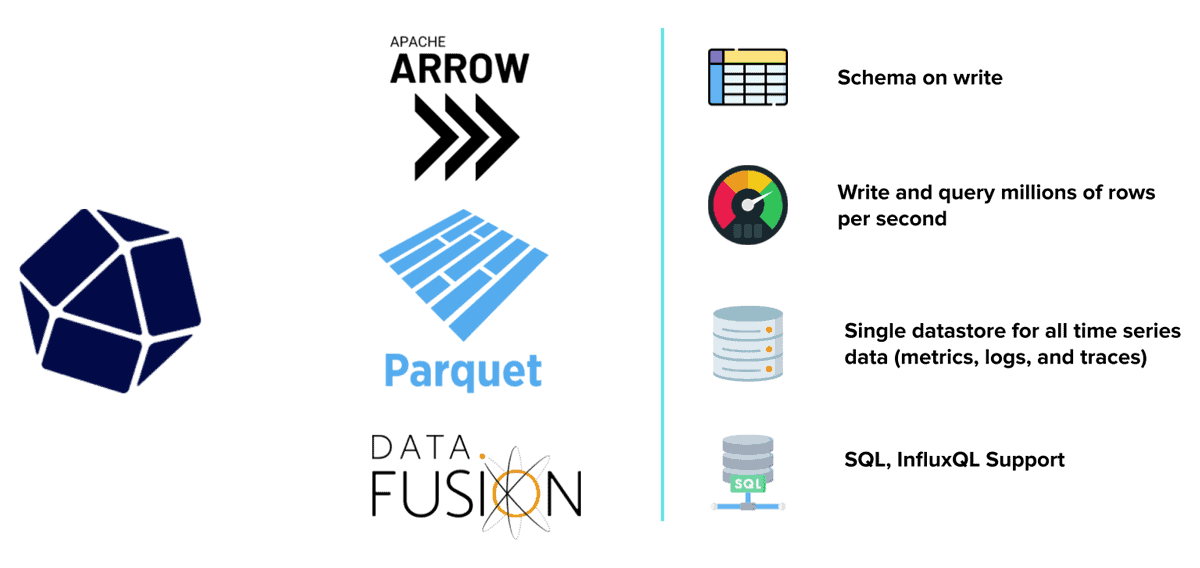
At its very core, InfluxDB offers us some considerable benefits when it comes to our use case:
| Benefit | Description |
| Schema on write | This is a no-brainer when it comes to monitoring use cases. Schema design is one of the most costly and time-consuming tasks developers need to focus on when using a conventional database. It is also an issue that will not go away because, depending on how Whisper GPT evolves, the schema will as well. InfluxDB constructs the schema on initial data ingest, removing the need to build out a schema from scratch. This capability allows the schema to evolve along with our solution. |
| Write and query performance | In most monitoring use cases, users require near-real-time visibility on the data they are ingesting and this can come from hundreds of data sources generating gigabytes of time series data a day. InfluxDB can ingest over 4 million values per second while providing millisecond query return times. I highly recommend checking out this blog to see some of our performance stats. |
| Single data store | One of the most interesting issues to solve within the monitoring and observability space is the storage of different types of time series data: traces, metrics and logs. Most seasoned providers use different data storage technologies for each and then provide an interface for joining these results at query time. InfluxDB 3.0 allows us to keep everything in a single store, reducing the overall cost of ownership. |
| Query support | With InfluxDB 3.0, we wanted to emphasize meeting developers where they are. This meant providing query languages that most users, whether current and new, can engage with. InfluxQL and SQL give developers performant options for interfacing with their data. They also provide a rich ecosystem to third-party solutions that make use of both languages. |
At this point, I, again, discussed best practices and getting started with InfluxDB 3.0. I highly recommend checking out the InfluxDB 3.0 Essentials course to catch up on this content.
Data in action
We have reached our second milestone. At this point, our Whisper GPT infrastructure monitoring process is collecting and storing data.
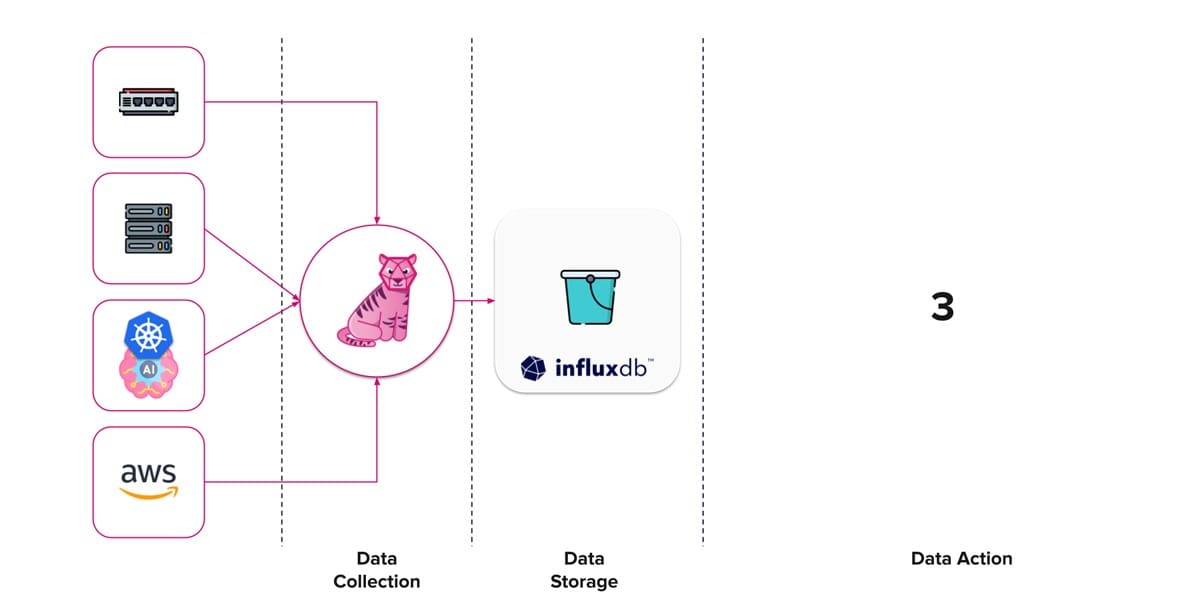
Now we need to do something with this data. Depending on your own initiatives or current company infrastructure, you might have a pretty good idea how this part is going to shape out. For the sake of completeness, let’s discuss some ideas.
Grafana is an open source data visualization and monitoring platform. It allows users to create interactive dashboards for real-time data analysis and tracking of metrics across various data sources. It is one of the most widely used platforms with InfluxDB. There are hundreds of blogs and articles on utilizing both Grafana and InfluxDB so let’s focus on the parts that are new with 3.0.
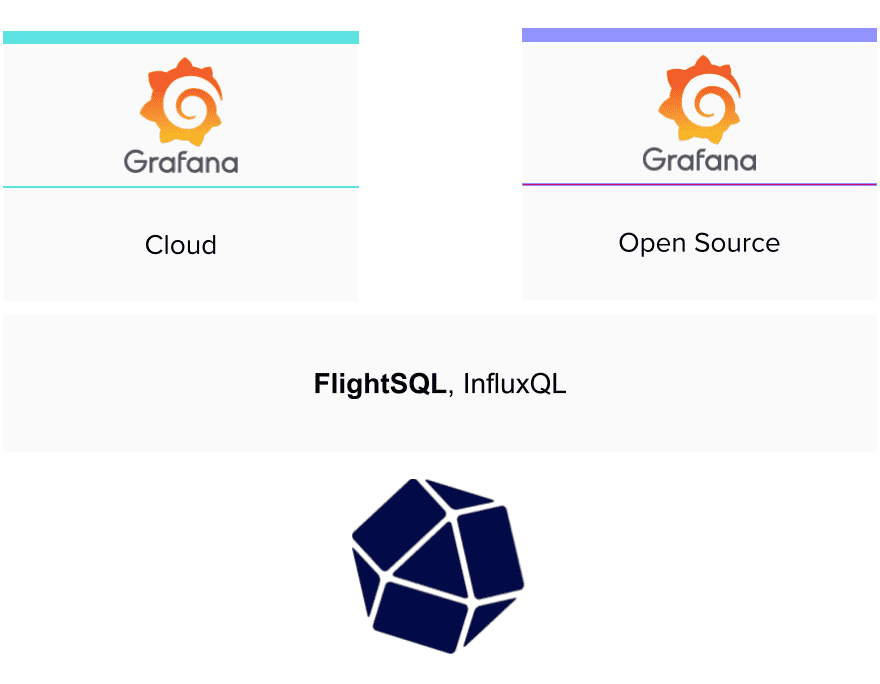
The FlightSQL plugin provides a new connection method between InfluxDB and Grafana allowing users to build dashboards with native SQL. The table below provides some useful SQL queries within Grafana.
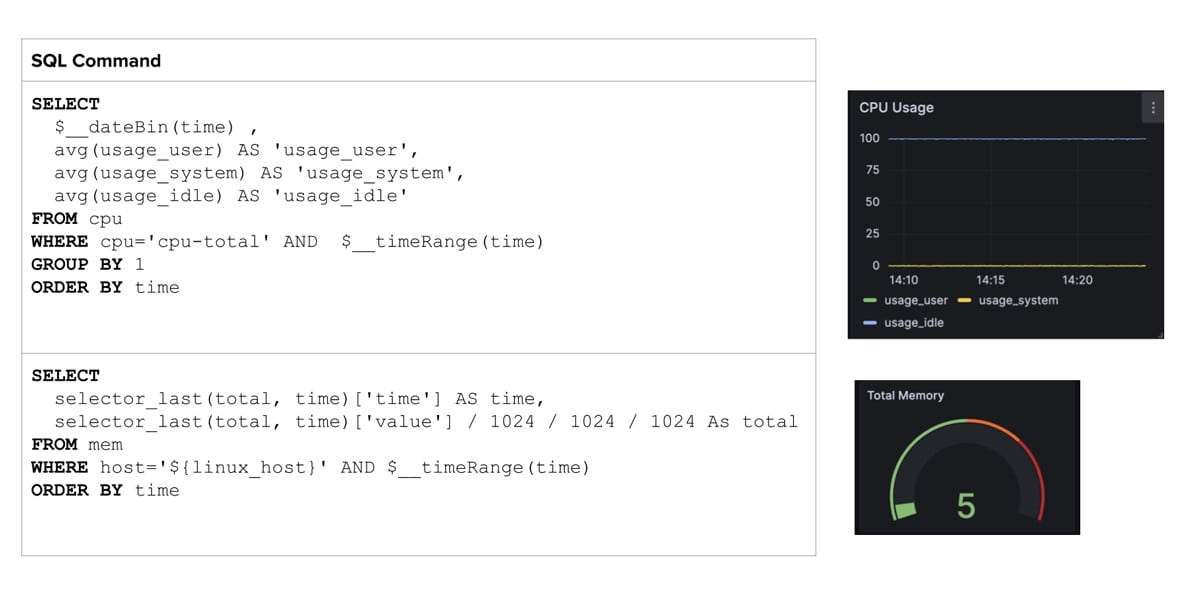
Note how we can deploy $__ variables to make our queries dynamic. The example above shows methods for monitoring our CPU usage over time and the last known total memory reading.
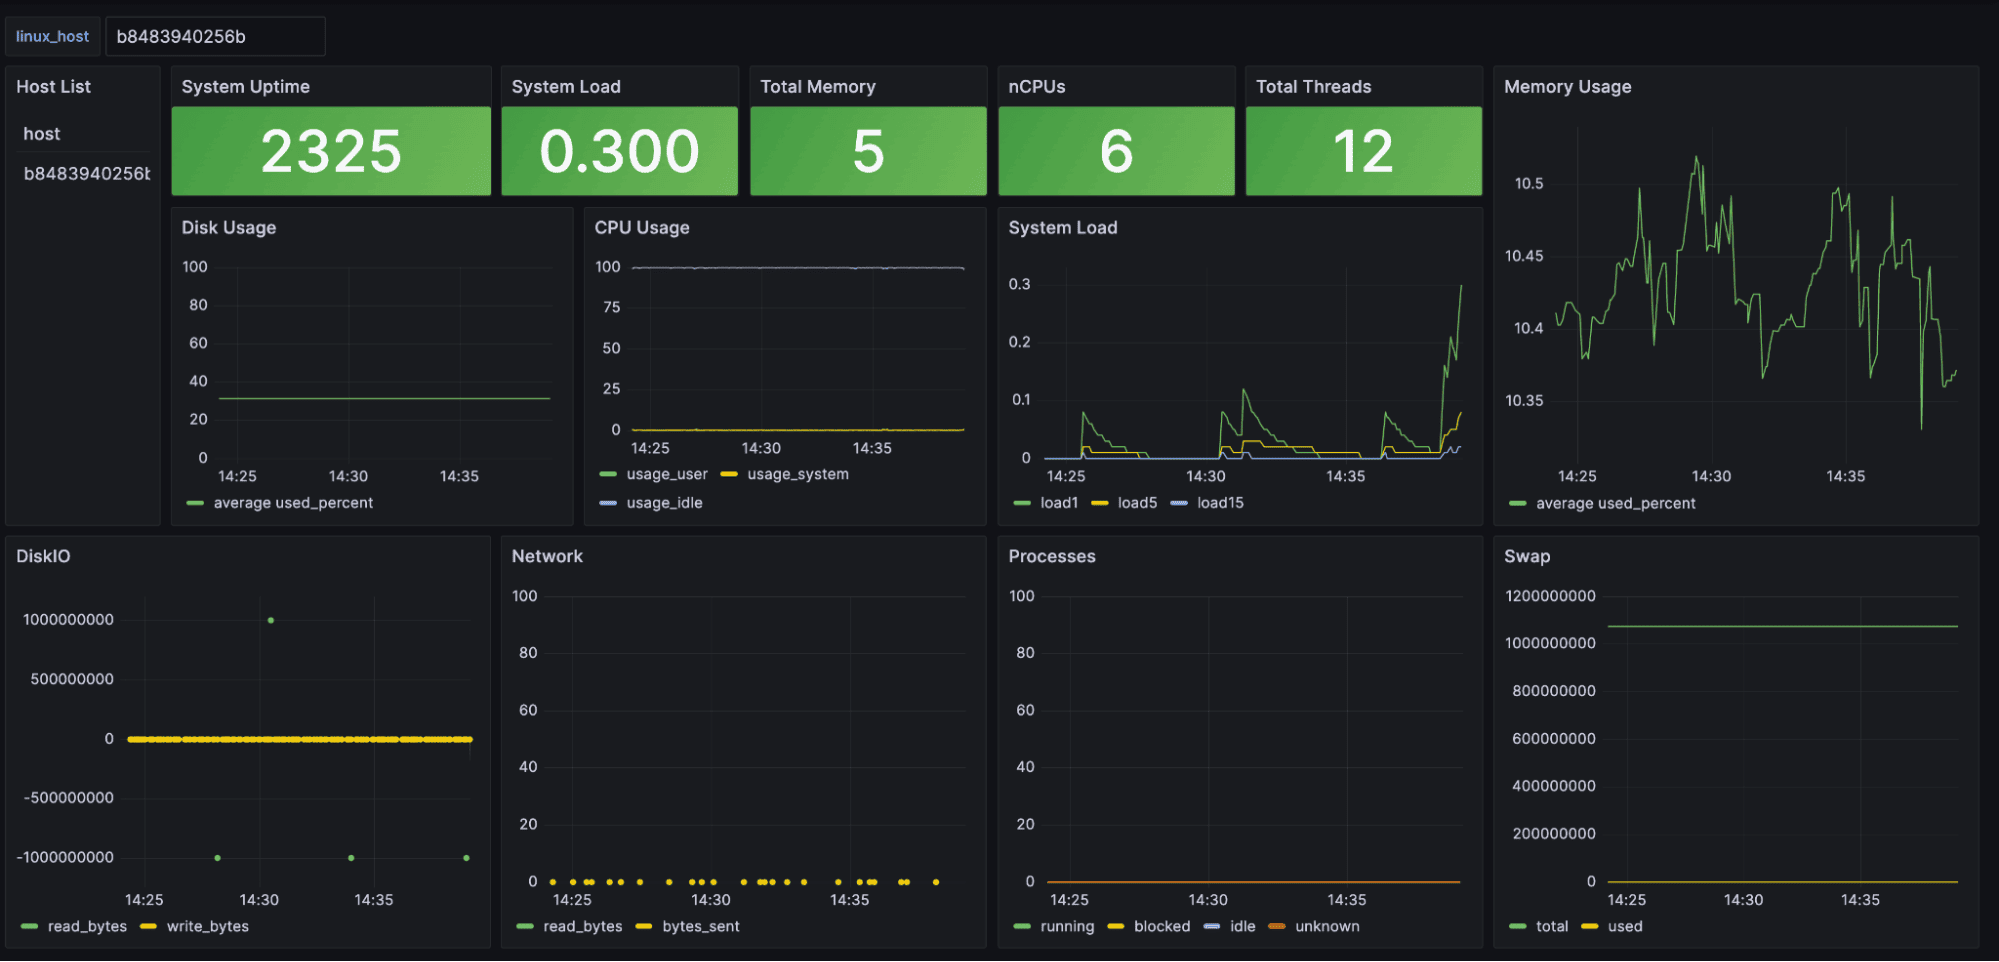
You can find the full dashboard here.
OpenTelemetry
The last point I wanted to touch on is OpenTelemetry. InfluxDB 3.0 provides one datastore for metrics, logs, and traces. We are working hard to provide the integrations required to make InfluxDB a plug-and-play solution for your OpenTelemetry stack. The ultimate goal is to provide the ability to visualize and inspect traces alongside metrics using a single pane of glass through Grafana.
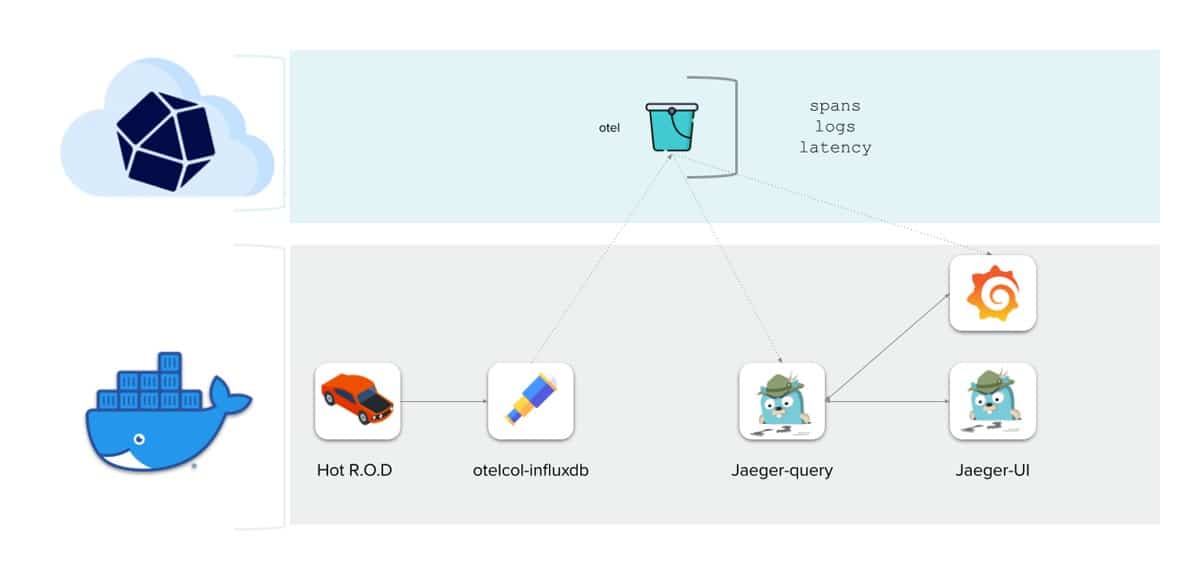
We use Killercoda to provide an online interactive demo, which you can try out here.
The finishing touch
Our three-step milestones to building an infrastructure monitoring platform.
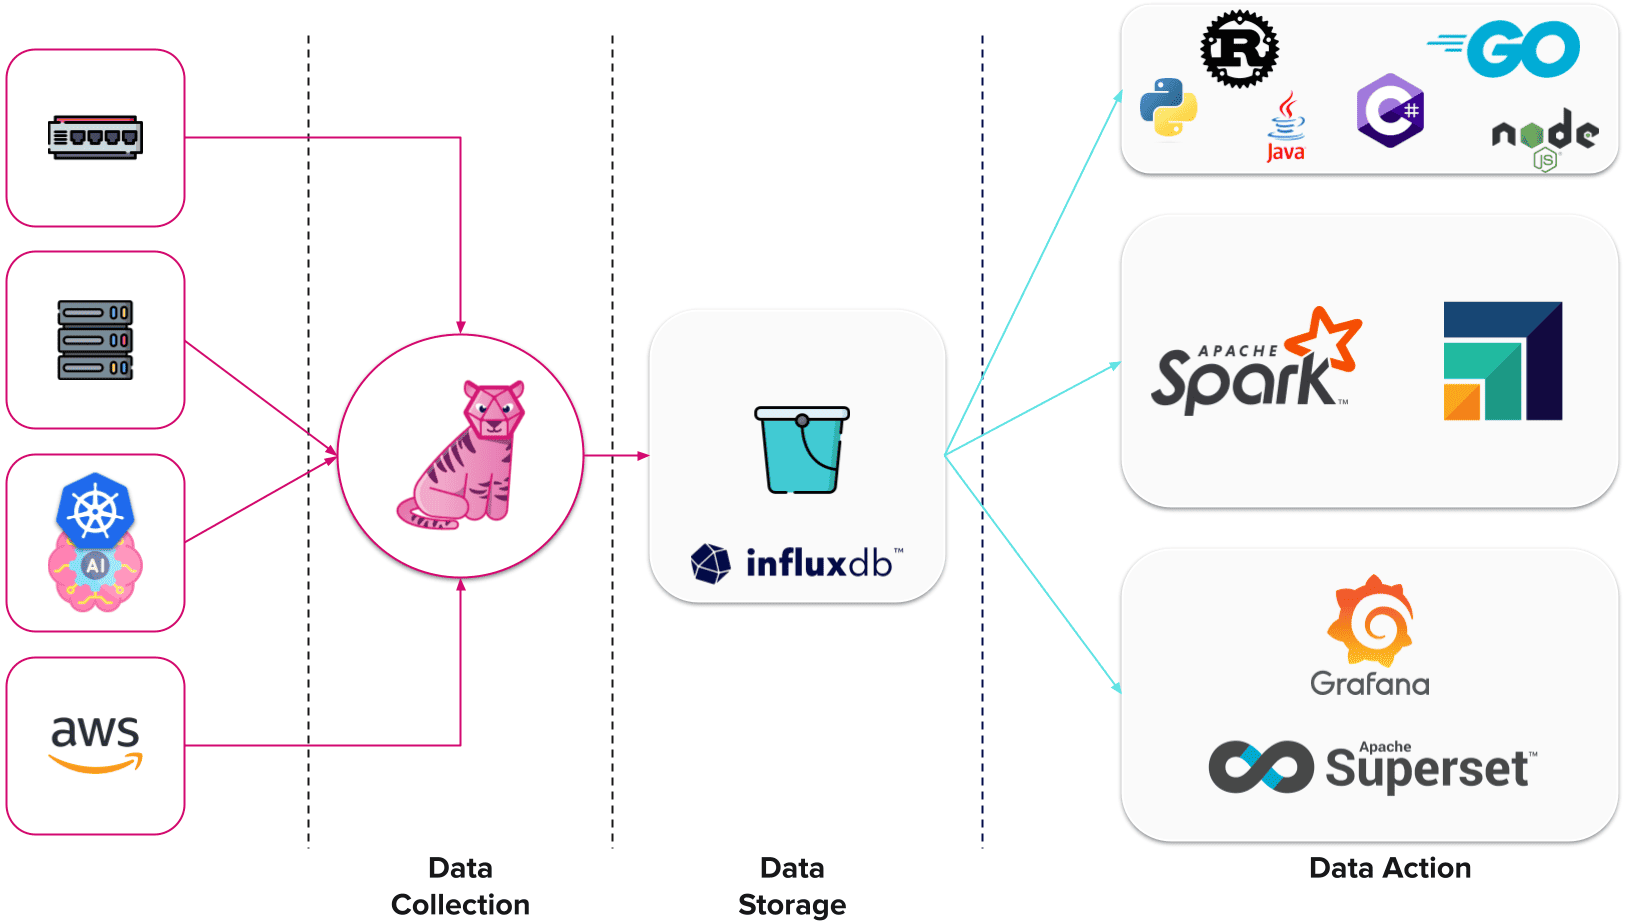
I took the liberty of adding some further integrations to the Data Action list. Let’s conclude by applying this to our Whisper GPT platform.
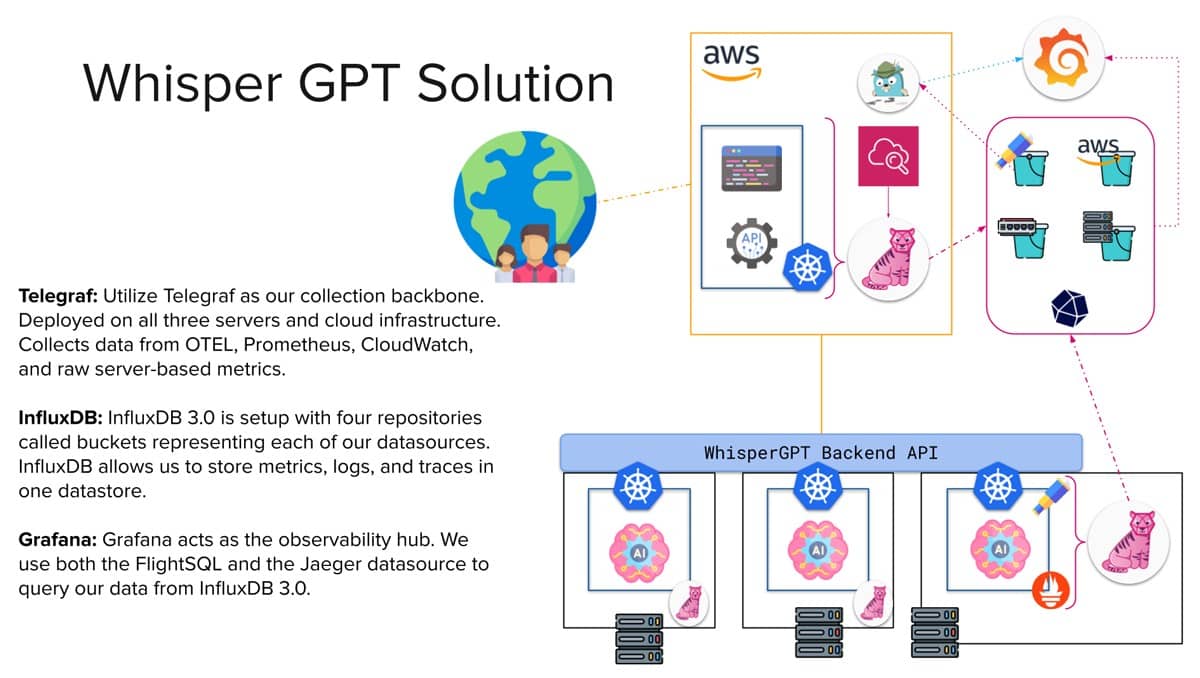
Through the integration of Telegraf, InfluxDB, and Grafana (aka the TIG stack), we architected a scalable solution adept at collecting, storing, and processing infrastructure data across diverse domains.
It’s my hope that this blog not only enlightens you about the journey of InfluxDB 3.0 and infrastructure monitoring, but also kindles your interest in the expansive world of Open Source. Open architecture offers a wealth of benefits, and the deeper you dive the more you will find. If you have any questions or comments on InfluxDB, Telegraf, or infrastructure monitoring in general please do not hesitate to reach out to me via Slack. I would love to hear from you.