

Guest post originally published on Grafana Labs’ blog by Goutham Veeramachaneni
Grafana Labs has always been actively involved in the OpenTelemetry community, even working with the predecessor projects OpenTracing and OpenCensus. We have been supporting OTLP as the primary input protocol for our distributed tracing project, Grafana Tempo, since its inception, and our Grafana Agent embeds parts of the OpenTelemetry Collector. Our teammate Juraci Paixão Kröhling has also been an OpenTelemetry Governance Committee member since 2021, and several others of us are voting members of OpenTelemetry as well.
In recent years, our investment in the open source project has continued to increase as we identify areas that make sense, whether that’s incorporating OpenTelemetry as an integral part of our Application Observability strategy in Grafana Cloud or supporting Prometheus native histograms in the OTel Collector.
As always, our mission in these engagements is very simple:
- Be where users want us to be.
- Be where users need us to be, before they know it.
- Honestly be experts in this field, before our users ever need us to be.
Two main areas of focus have been interoperability with Prometheus, another open source project Grafana Labs is heavily invested in, and instrumentation SDKs. Now that OpenTelemetry Metrics is stable, we’re seeing it gain traction among our users, and more people are coupling OTel with Prometheus as the backend. Our dedication to creating a great user experience for both of these projects is clear: Grafana Labs is the only company leading in contributions to Prometheus and OpenTelemetry.
In the last year, there have been massive strides in the usability of Prometheus with OpenTelemetry led by the Prometheus working group, which is made up of OpenTelemetry members and users who have an interest in Prometheus and Prometheus members and users who helped OTel become and remain Prometheus compatible. And yes, there are some Grafanistas in the mix. For my part, I am a Prometheus maintainer who is also actively involved in the Prometheus WG and have been connecting the two projects for the past year and half.
Despite all the impactful developments in both OSS projects, there are still some tips, tricks, and tweaks that we’ve picked up over the years from our deep experience with both projects.
In this blog post, I’ll cover some of the best practices for emitting your metrics with OpenTelemetry, storing them with Prometheus or Grafana Mimir, and getting the most out of using OpenTelemetry and Prometheus together.
1. Use full metric normalization
By default, the OTel Collector exporters don’t add units to metric names. For example, when you try to visualize an OTLP metric http.server.duration, you will by default see http_server_duration_bucket in Prometheus. The Prometheus metric doesn’t contain the unit for the metric, and hence it is hard to understand if the metric is in milliseconds or seconds.
As a temporary workaround, the fix for this is to enable a feature flag on the Otel Collector:
otelcol --config=config.yaml --feature-gates=pkg.translator.prometheus.NormalizeName
Once this feature flag is enabled, the above metric will become http_server_duration_seconds_bucket.
We will deprecate the feature gate and switch it on by default in the near future.
2. Copy common resource attributes
By default, resource attributes are added to a special metric called target_info. To select and group metrics by resource attributes, you need to do a join on target_info. For example, to select metrics with k8s_namespace_name attribute equal to my-namespace:
app_ads_ad_requests_total * on (job, instance) group_left target_info{k8s_namespace_name="my-namespace"}
PromQL
Or to group by a particular attribute (for ex. k8s_namespace_name):
sum by (k8s_namespace_name) (app_ads_ad_requests_total * on (job, instance) group_left(k8s_namespace_name) target_info)
PromQL
This is not a common pattern in Prometheus, and we recommend copying the most common resource attributes into metric labels. You can do this through the transform processor:
processor:
  transform:
    metric_statements:
- context: metric
        statements:
- set(attributes["k8s_namespace_name"], resource.attributes["k8s_namespace_name"])
- set(attributes["k8s_container_name"], resource.attributes["k8s.container.name"])
- set(attributes["k8s_pod_name"], resource.attributes["k8s.pod.name"])
- set(attributes["k8s_cluster_name"], resource.attributes["k8s.cluster.name"])
YAML
After this, grouping or selecting becomes as simple as:
app_ads_ad_requests_total{k8s_namespace_name="my-namespace"}

sum by (k8s_namespace_name) (app_ads_ad_requests_total)
PromQL
3. Understand naming conventions and limitations
OpenTelemetry allows UTF-8 in the metric and label names, while Prometheus has a more restricted set of characters. But what is problematic is that OpenTelemetry uses the dot (.) character quite frequently to namespace, and this means most of the OpenTelemetry metric names will have . in them. When converting the OTel metric into a Prometheus metric, we convert the . characters into _.
For example, http.server.duration with attributes http.route becomes http_server_duration{http_route=”...”} in Prometheus. There is progress in the Prometheus community to remove this limitation, but until that is merged, understanding the naming mismatch would help avoid surprises.
4. Stick to semantic conventions where possible
OpenTelemetry defines a broad set of semantic conventions as part of its specification. For example, the HTTP semantic conventions specify a metric: http.server.duration with http.route, http.request.method, etc. as required attributes.
Always look for existing semantic conventions. Anything HTTP should use the convention above. If you were to need database metrics for example, adopt the existing conventions to what you are trying to do. As more and more products integrate with OpenTelemetry, they will start expecting these attributes to be present and following explicit and implicit conventions ensures you get all the out-of-the-box automation and integration.
This is also true for resource attributes and you can see our documentation on how to add attributes that are compatible with semantic conventions to your data.
5. Use seconds as the time unit
In Prometheus, we use SI units as the default units for measurements. This allows for easy math across metrics from different services, as you don’t need to do constant unit conversions. The most common measurement is time measurements, and Prometheus uses seconds. However, it is not fully standardized in OpenTelemetry, and only the semantic conventions specify seconds.
To ensure full compatibility with the wider Prometheus and CNCF ecosystem it is recommended that all measurements are in seconds.
In Java, the most popular instrumentation option in javaagent. The -Dotel.semconv-stability.opt-in=http option switches the http.server.duration and http.client.duration metrics to seconds, automatically adjusting the bucket boundaries. The remaining metrics, such as rpc.client.duration cannot be switched to ms so far. When you create a histogram manually, use s as the unit and set the histogram buckets explicitly:
public static final List<Double> DURATION_SECONDS_BUCKETS = Arrays.asList(
0.0, 0.005, 0.01, 0.025, 0.05, 0.075, 0.1, 0.25, 0.5, 0.75, 1.0, 2.5, 5.0, 7.5, 10.0);

static DoubleHistogram createDurationHistogram(
    Meter meter, String name, String description) {
  DoubleHistogramBuilder durationBuilder =

    meter.histogramBuilder(name).setUnit("s").setDescription(description);
  if (durationBuilder instanceof ExtendedDoubleHistogramBuilder) {
    ((ExtendedDoubleHistogramBuilder) durationBuilder)
    .setAdvice(advice -> advice.setExplicitBucketBoundaries(DURATION_SECONDS_BUCKETS));
  }
  return durationBuilder.build();
}
Java
6. Use Prometheus Remote Write exporter
When exporting metrics to Prometheus through the OTel Collector, you could use either the Prometheus exporter or the Prometheus Remote Write exporter. The architecture when using Prometheus Exporter is the following:
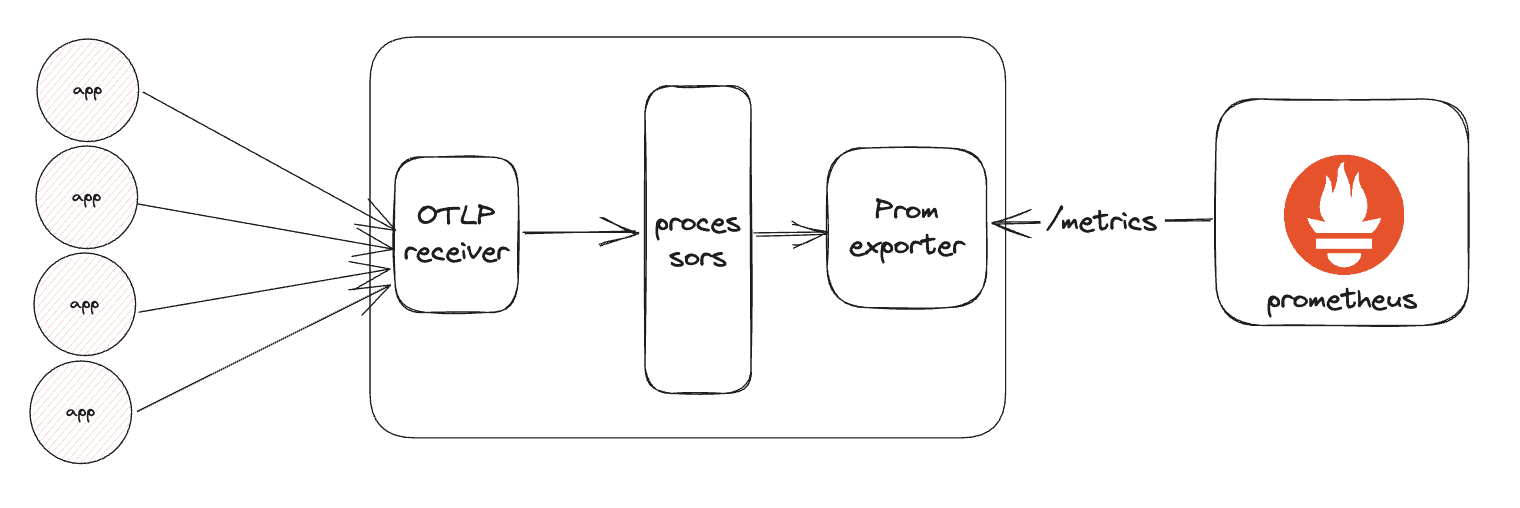
This means all the metrics exposed by many different applications are all exposed in a single /metrics endpoint. This endpoint exposes a huge amount of data and makes scraping inefficient as the load is not evenly spread across time, but there is a huge ingest spike every scrape interval. Further if we load-balance the OTLP requests between a cluster of Collectors, scaling becomes harder because it is likely that all the metrics are available in every single Collector.
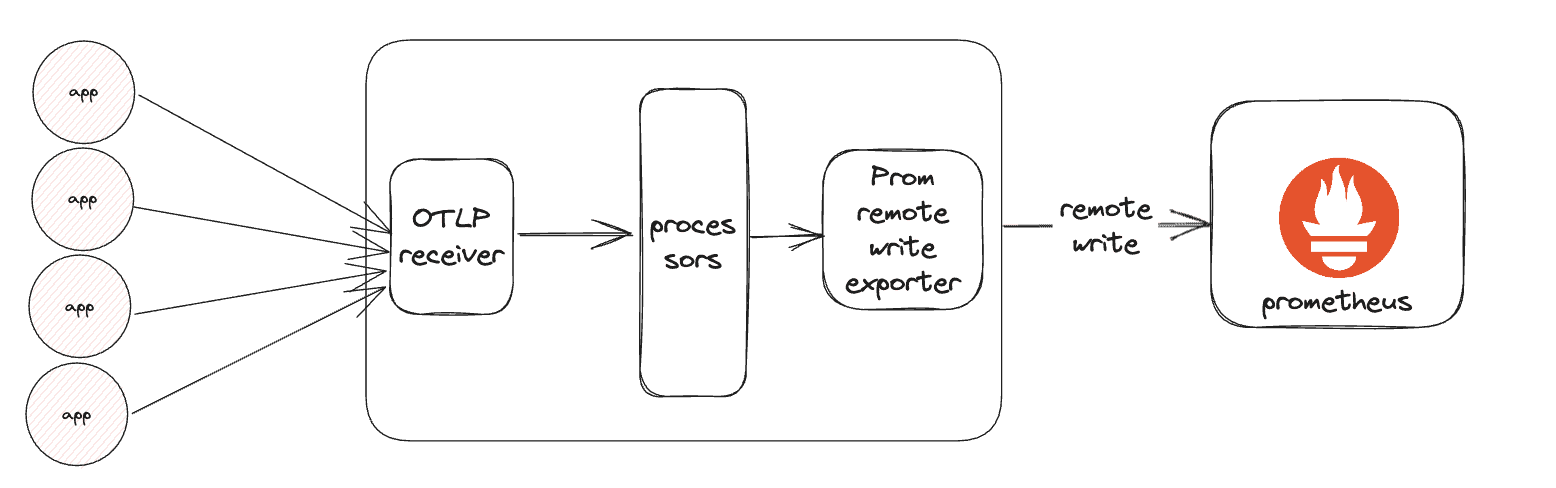
However, when using the Prometheus Remote Write exporter, you can easily push data to Prometheus, even from multiple Collector instances without any issues:
7. Configure out-of-order (OOO) writes
There are no guarantees that OpenTelemetry data will arrive in order. However, Prometheus expects data to be in order by default. This is one of the nicer properties of a scrape-based system in which the timing is controlled centrally, and it allows substantial efficiency gains.
Yet, because of this data may be dropped if sending OTel data directly to Prometheus.
The fix is easy: Simply enable OOO ingestion in Prometheus:
tsdb:
  # A 10min time window is enough because it can easily absorb retries and network delays.
  out_of_order_time_window: 10m
YAML
If you’re using Mimir, you can set the OOO config in limits:
limits:
  out_of_order_time_window: 10m
YAML
Future improvements to OpenTelemetry and Prometheus
The above options will help improve your experience with OpenTelemetry and Prometheus today. However, we are working to make sure a lot of these are switched on by default as well as doing more to further improve the integration between the two projects, such as with native OTLP ingestion in Prometheus.
As we continue to identify areas of development that would be valuable to our community, we will continue to take the lead. For instance, Grafana Labs is leading the efforts to add the fourth observability signal, continuous profiling, to OpenTelemetry. We look forward to working with the OpenTelemetry community to continue innovating, implementing, and iterating on new OTel functionality as the project keeps growing.