


Guest post originally published on Medium by Hubert Dulay
Gartner States:
“By the end of 2024, 75% of organizations will shift from piloting to operationalizing artificial intelligence (AI), driving a 5 times increase in streaming data and analytics infrastructures.”
https://www.gartner.com/en/newsroom/press-releases/2020-06-22-gartner-identifies-top-10-data-and-analytics-technolo
There are several reasons why data streaming is becoming more popular:
- The increasing volume and velocity of data: The amount of data generated by businesses and individuals is growing exponentially. This data can be used to gain insights into customer behavior, identify trends, and improve decision-making.
- The need for real-time insights: Businesses need to be able to make decisions based on real-time data. This is especially important in industries such as finance, healthcare, and manufacturing, where timely choices can significantly impact the bottom line.
- The availability of scalable and affordable streaming platforms: There are a number of scalable and affordable streaming platforms available, which makes it easier for businesses to implement data streaming solutions.
In this post, I’ll be showing you how to build a streaming stack that supports real-time analytics quickly. We’ll be using these technologies for simple setup:
- Kubernetes (k8s) is an open-source system for automating the deployment, scaling, and management of containerized applications.
- Kind: a tool for running local Kubernetes clusters.
- Helm: helps you manage k8s applications.
- k9s: a terminal-based UI to interact with your Kubernetes clusters.
- Apache Kafka: a distributed event store and streaming platform.
- RisingWave: a distributed SQL database for stream processing. It is designed to reduce the complexity and cost of building real-time applications. RisingWave consumes streaming data, performs incremental computations when new data comes in, and updates results dynamically. As a database system, RisingWave maintains results in its stores so that users can access data efficiently.
- Apache Pinot: a column-oriented, open-source, distributed data store written in Java. Pinot is designed to execute OLAP queries with low latency. It is suited in contexts where fast analytics, such as aggregations, are needed on immutable data, possibly, with real-time data ingestion.
- Apache Superset: an open-source data exploration and data visualization able to handle data at petabytes scale.
Choosing The Technologies
Event data preparation can significantly impact the performance of analytical queries. By optimizing the data layout, indexing, and partitioning, the efficiency of data retrieval and processing can be improved. This includes techniques such as data de-normalization, columnar storage, and indexing strategies tailored for the analytical workload. Well-prepared data can reduce the processing time and enable faster insights. Transformation tasks tend to be resource-consuming and process intensive. It’s best to complete transformation as part of a pre-processing step in a data pipeline before writing to a data store that serves it to consumers.
RisingWave has all the capabilities to preprocess the streaming data to optimize it for analytical workloads in an OLAP data store.
Apache Pinot provides columnar storage and indexing that makes analytical queries extremely fast atop petabytes of data. It has the ability to source from real-time streaming platforms like Kafka as well as ingest data from an object store for historical context.
If you are familiar with the Lambda Architecture, you’ll know it employs batch and streaming pipelines and merges them together to combine real-time with historical data. Merging historical and real-time data has always been a difficult task. Apache Pinot automatically does this for you. It’s the easiest way to enable a Lambda Architecture.
With RisingWave and Pinot, users can harness the power of both stream processing and OLAP technologies, enabling them to achieve a comprehensive solution. RisingWave excels in efficiently processing pre-computation logic in real-time. Whenever a new tuple is received, RisingWave triggers incremental computation, ensuring that computation results are instantly updated. On the other hand, Pinot excels at efficiently serving analytical workloads. By ingesting the results from RisingWave into Pinot, users can seamlessly issue ad-hoc analytical queries, empowering them to perform interactive analytics with ease.
Getting Started
I’ll be using the macOS-based brew package manager. For Windows package installer, you can use Chocolatey. We will be building the solution diagram below.
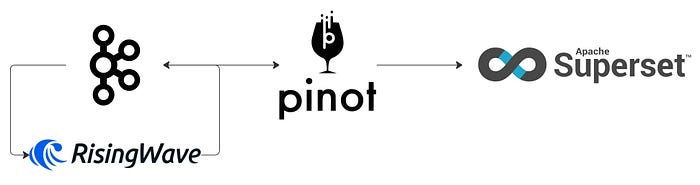
- Apache Kafka is the streaming platform that will capture and publish events to any subscribing consumer.
- RisingWave is an open-source streaming database. RisingWave consumes streaming data, performs incremental computations when new data comes in, and updates results dynamically.
- Apache Pinot is a real-time distributed online analytical processing (OLAP) datastore. Use Pinot to ingest and immediately query data from streaming or batch data sources (including, Apache Kafka, Amazon Kinesis, Hadoop HDFS, Amazon S3, Azure ADLS, and Google Cloud Storage).
Install the Kubernetes tools
These are the tools you’ll need to begin using k8s locally. We will be using these tools often throughout the post.
brew install kubectl
brew install kind
brew install helm
brew install derailed/k9s/k9s
Before starting, you may need to free up some space in docker by removing unused local volumes. You can do so by running the command below.
docker volume pruneAdd charts to your local Helm repository
A Helm local repository is a directory on your local machine that stores Helm charts. In k8s, a Helm chart is a package that contains all the necessary resources to deploy an application to a k8s cluster, including YAML configuration files for deployments, services, secrets, and config maps that define the desired state of your application.
We will be sourcing helm charts for most of the services we’ll deploy into k8s. Below we are adding repositories for Apache Kafka, Apache Pinot, and Apache SuperSet.
helm repo add kafka https://charts.bitnami.com/bitnami
helm repo add pinot https://raw.githubusercontent.com/apache/pinot/master/kubernetes/helm
helm repo add superset https://apache.github.io/superset
Starting a Local k8s Cluster
We will first need to start a k8s cluster using Kind. Run the commands below.
kind create cluster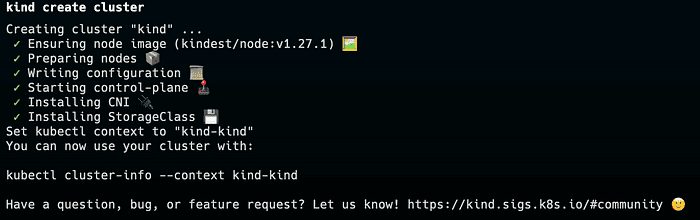
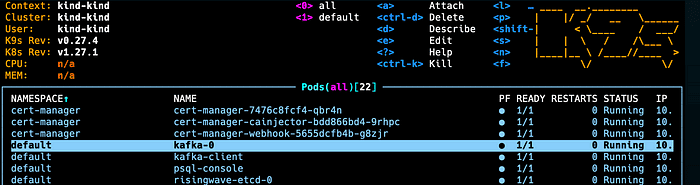
Use k9s to check the status of the k8s cluster to ensure the kind cluster is running.
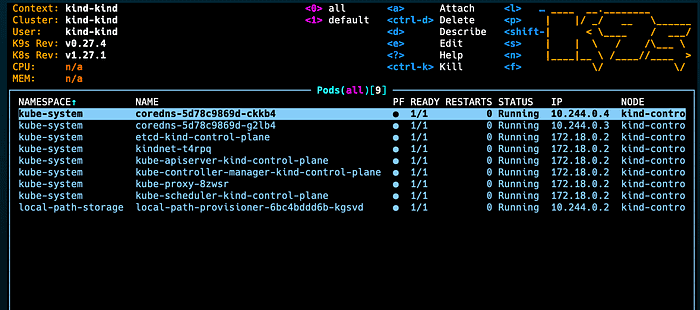
On the top right of the k9s UI, you’ll see a reference to some commands. We’ll use these commands to gain access to pods and view logs throughout this post.
Installing RisingWave
We will be installing RisingWave using a Kubernetes operator instead of Helm. A Kubernetes operator is a software component that automates the management of Kubernetes resources. It is a custom controller that extends the Kubernetes API to create, configure, and manage instances of complex applications on behalf of a Kubernetes user.
Helm and operators are both tools that can be used to manage Kubernetes applications. However, they have different strengths and weaknesses.
Helm is a package manager for Kubernetes. It allows you to package, deploy, and manage applications using a simple, declarative YAML file called a Helm chart. Helm charts can be used to deploy a wide variety of applications, including databases, stateful applications, and microservices.
Operators are custom controllers that extend the Kubernetes API to create, configure, and manage instances of complex applications on behalf of a Kubernetes user. Operators can also be used to manage a wide variety of applications, including databases, stateful applications, and microservices. They can also be used to manage complex applications requiring a lot of manual intervention, such as Kubernetes itself.
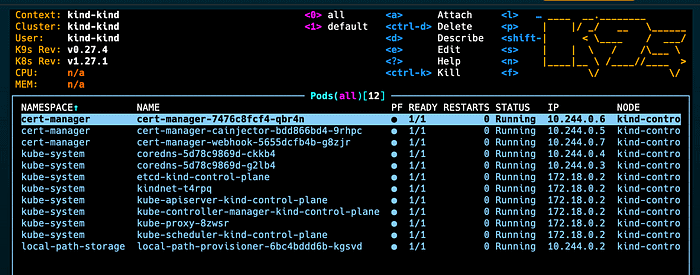
First, open another terminal to invoke Kubernetes commands then install the cert-manager using the command below. cert-manager adds certificates and certificate issuers as resource types in Kubernetes clusters, and simplifies the process of obtaining, renewing, and using those certificates.
kubectl apply -f https://github.com/cert-manager/cert-manager/releases/download/v1.12.0/cert-manager.yaml
Check k9s for the cert-manager to ensure that it’s running.
Next, install the RisingWave operator using the command below.
kubectl apply --server-side -f https://github.com/risingwavelabs/risingwave-operator/releases/latest/download/risingwave-operator.yamlCheck k9s for the RisingWave operator.
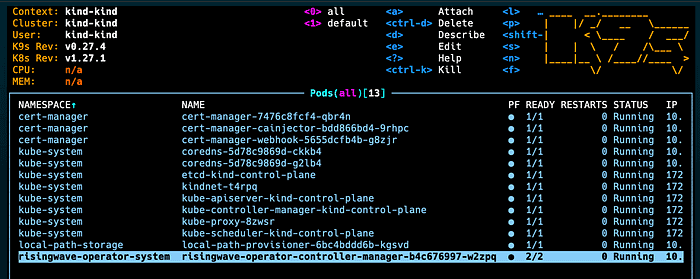
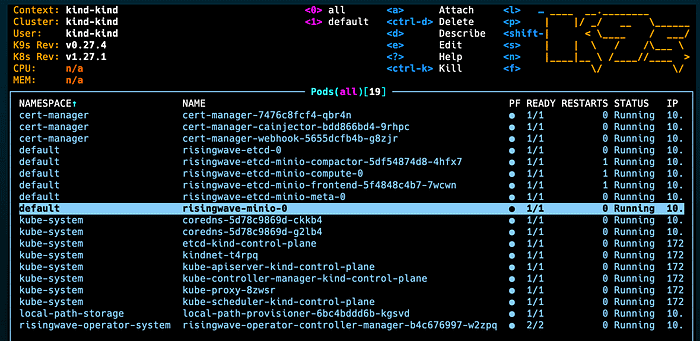
Next, run the following command to deploy a RisingWave instance with MinIO as the object storage. MinIO is an open-source object storage server. It is a distributed object storage system that is compatible with Amazon S3.
kubectl apply -f https://raw.githubusercontent.com/risingwavelabs/risingwave-operator/main/docs/manifests/risingwave/risingwave-etcd-minio.yamlYou should see a set of pods related to RisingWave deployed in the k9s.
Connecting To RisingWave
RisingWave makes it easy to manage streams and data. All you need to interact with RisingWave is Postgres-compatible SQL. No Java or Scala codes are needed. Therefore, you’ll need to have a Postgres client to interface with RisingWave. Run the command below to create a psql client.
kubectl apply -f https://raw.githubusercontent.com/risingwavelabs/risingwave-operator/main/docs/manifests/psql/psql-console.yaml
You should see the psql-console available pod in k9s.
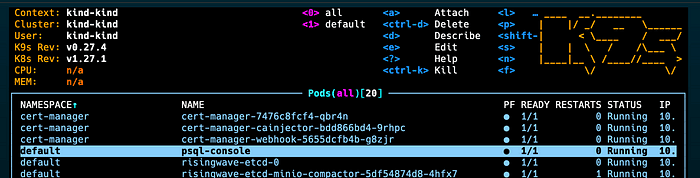
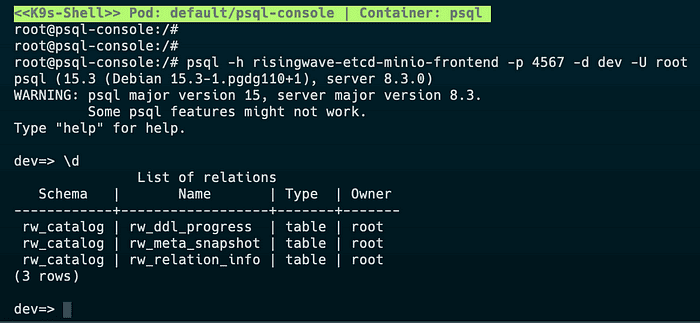
Use the arrows to highlight the psql-console then hit s to log into the psql container in the pod. This will get you access to the command line from which you can run the psql client. Run the command below to get access to RisingWave.
psql -h risingwave-etcd-minio-frontend -p 4567 -d dev -U rootYou can now use Postgres commands to interact with RisingWave.
Installing and Publishing Data To Kafka
Open another terminal and run k9s in that instance so that you can make the RisingWave console available in its current terminal. Since RisingWave is a streaming database, we can source data from streaming platforms like Kafka. Install Kafka using the command below.
helm install kafka bitnami/kafkaNow install a Kafka client to interface with Kafka.
kubectl run kafka-client --restart='Never' --image docker.io/bitnami/kafka:3.4.0-debian-11-r33 --namespace default --command -- sleep infinityGoing back to k9s, you should see two pods related to Kafka.
Just like the psql pod, you can log into the kafka-client pod to run Kafka commands. Let’s create a topic called http then produce some JSON data from httpbin.org.
kafka-topics.sh --bootstrap-server kafka:9092 --create --topic http
curl http://httpbin.org/stream/10 | kafka-console-producer.sh --bootstrap-server kafka:9092 --topic http
Querying From Kafka Using RisingWave
Now that we have a topic in Kafka filled with data, we can now create a table in RisingWave that consumes from that topic. Copy the SQL below to create a SOURCE object in RisingWave.
CREATE SOURCE http_events (
  id integer,
  url varchar,
  origin varchar,
  headers JSONB
)
WITH (
   connector='kafka',
   topic='http',
   properties.bootstrap.server='kafka:9092',
   scan.startup.mode='earliest'
)
ROW FORMAT JSON;
Notice the connection information to Kafka and the row format. Run the select statement below. You should get a similar output. Notice also the header JSON column (you may need to pan right).
select * from http_events limit 5;

 id |             url              |    origin     |                                                               headers

----+------------------------------+---------------+----------------------------------------------------------------------------------------------------------------
----------------------
  0 | http://httpbin.org/stream/10 | 69.206.123.45 | {"Accept": "*/*", "Host": "httpbin.org", "User-Agent": "curl/7.74.0", "X-Amzn-Trace-Id": "Root=1-64838cc4-69ffd
00912b674f3360e6b05"}
  1 | http://httpbin.org/stream/10 | 69.206.123.45 | {"Accept": "*/*", "Host": "httpbin.org", "User-Agent": "curl/7.74.0", "X-Amzn-Trace-Id": "Root=1-64838cc4-69ffd
00912b674f3360e6b05"}
  2 | http://httpbin.org/stream/10 | 69.206.123.45 | {"Accept": "*/*", "Host": "httpbin.org", "User-Agent": "curl/7.74.0", "X-Amzn-Trace-Id": "Root=1-64838cc4-69ffd
00912b674f3360e6b05"}
  3 | http://httpbin.org/stream/10 | 69.206.123.45 | {"Accept": "*/*", "Host": "httpbin.org", "User-Agent": "curl/7.74.0", "X-Amzn-Trace-Id": "Root=1-64838cc4-69ffd
00912b674f3360e6b05"}
  4 | http://httpbin.org/stream/10 | 69.206.123.45 | {"Accept": "*/*", "Host": "httpbin.org", "User-Agent": "curl/7.74.0", "X-Amzn-Trace-Id": "Root=1-64838cc4-69ffd
00912b674f3360e6b05"}
(5 rows)
Create a Join
Let’s now create a table that has user information. We will join this information with http_event data to enrich it.
CREATE TABLE USERS (
  id integer primary key,
  name varchar,
  ip varchar
);

INSERT INTO USERS values (1, 'foo', '69.206.123.45');

--select * from http_events a join USERS b on a.origin=b.ip;
If you execute the select statement that is commented out, you’ll notice that the console prints out records until the topic is exhausted. This is what is unique about streaming databases; if data doesn’t stop, is unbounded and never stops.
Write Enriched Data Back to Kafka
First, let’s create another Kafka topic for the output of the enrichment we just performed in RisingWave.
kafka-topics.sh --bootstrap-server kafka:9092 --create --topic http_enrichNow we can perform a CSAS (create sink as select …) which will perform the write back to Kafka.
CREATE SINK http_enrich AS
SELECT
  b.id as id,
  name,
  ip,
  url,
  headers
FROM http_events a JOIN USERS b ON a.origin=b.ip
WITH (
   connector='kafka',
   topic='http_enrich',
   properties.bootstrap.server='kafka:9092',
   type='upsert',
   primary_key='id'
);
You can test the output by consuming from the http_enrich topic you created. Run the command below in the Kafka client pod.
kafka-console-consumer.sh \
  --bootstrap-server kafka:9092 \
  --topic http_enrich \
  --from-beginning
Installing Apache Pinot to Serve Real-Time Data
Run the commands below in your macOS terminal to add the Apache Pinot charts and deploy them into k8s.
helm repo add pinot https://raw.githubusercontent.com/apache/pinot/master/kubernetes/helm
helm install pinot pinot/pinot
Next, highlight the pinot-controller-0 pod and type shift-f. This will allow you to port forward the Pinot controller externally so that you can open the Pinot console from your browser.
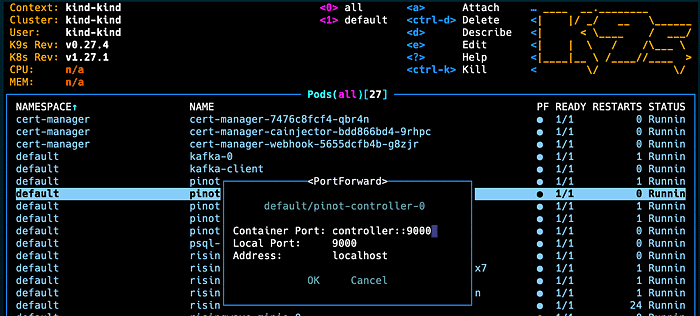
Arrow down to select OK then open the browser to localhost:9000. You should get the same view below.
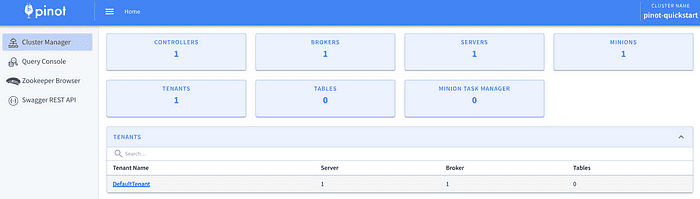
Before we create a table, we’ll need to adjust the DefaultTenant. A tenant is a logical component defined as a group of server/broker nodes with the same Helix tag. Out-of-the-box, the broker in Pinot needs to be associated with a tenant or else you will get errors when creating a real-time table.
Creating a Table in Pinot with JSON Index
First, we need to create a schema. In the Pinot console, click on “Tables” then “Add Schema.” Then copy and paste the JSON schema below.
Remember the “headers” field contains JSON data. In this schema, we’ve defined its data type as STRING. We also set the max length to 10,000 characters. When we define the table, we will apply a JSON index to this field. Pinot will parse this JSON at ingestion and place its values in an index. At query time, Pinot will not parse the JSON string to search for values. Instead, it will search the JSON index.
The JSON index is a powerful feature that allows you to balance strict and loose enforcement of your data structure. Having a JSON field provides a way to freely evolve your schema without breaking changes.
Next, we specify a timestamp field “__ts.” This field was not part of the original in RisingWave. We will automatically add a value to this field by applying an ingestion transform when we define the table.
{
    "schemaName": "http_enrich",
    "dimensionFieldSpecs": [
      {
        "name": "headers",
        "dataType": "STRING",
        "maxLength": 10000
      },
      {
        "name": "id",
        "dataType": "INT"
      },
      {
        "name": "ip",
        "dataType": "STRING"
      },
      {
        "name": "url",
        "dataType": "STRING"
      },
      {
        "name": "name",
        "dataType": "STRING"
      }
    ],
    "dateTimeFieldSpecs": [
        {
          "name": "__ts",
          "dataType": "LONG",
          "format": "EPOCH",
          "granularity": "5:MINUTES"
        }
    ]
  }
Next, we need to create a real-time table in Pinot. Pinot has the ability to source real-time events from Kafka as well as from object stores like S3. Streaming table types are called “REALTIME” and batch table types are called “OFFLINE” tables.
Click on “Add Realtime Table”. Scroll to the bottom of the form and copy and paste the JSON below. The console will automatically update the values in the form.
{
    "tableName": "http_enrich",
    "tableType": "REALTIME",
    "tenants": {
        "broker": "DefaultTenant",
        "server": "DefaultTenant",
        "tagOverrideConfig": {}
    },
    "segmentsConfig": {
        "schemaName": "http_enrich",
        "timeColumnName": "__ts",
        "replication": "1",
        "replicasPerPartition": "1",
        "retentionTimeUnit": null,
        "retentionTimeValue": null,
        "completionConfig": null,
        "crypterClassName": null,
        "peerSegmentDownloadScheme": null
    },
    "tableIndexConfig": {
        "loadMode": "MMAP",
        "invertedIndexColumns": [],
        "createInvertedIndexDuringSegmentGeneration": false,
        "rangeIndexColumns": [],
        "sortedColumn": [],
        "bloomFilterColumns": [],
        "bloomFilterConfigs": null,
        "noDictionaryColumns": [],
        "onHeapDictionaryColumns": [],
        "varLengthDictionaryColumns": [],
        "enableDefaultStarTree": false,
        "starTreeIndexConfigs": null,
        "enableDynamicStarTreeCreation": false,
        "segmentPartitionConfig": null,
        "columnMinMaxValueGeneratorMode": null,
        "aggregateMetrics": false,
        "nullHandlingEnabled": false,
        "jsonIndexConfigs": {
            "headers": {
                "maxLevels": 2,
                "excludeArray": false,
                "disableCrossArrayUnnest": true,
                "includePaths": null,
                "excludePaths": null,
                "excludeFields": null
            }
        },
        "streamConfigs": {
            "streamType": "kafka",
            "stream.kafka.topic.name": "http_enrich",
            "stream.kafka.broker.list": "kafka:9092",
            "stream.kafka.consumer.type": "lowlevel",
            "stream.kafka.consumer.prop.auto.offset.reset": "smallest",
            "stream.kafka.consumer.factory.class.name": "org.apache.pinot.plugin.stream.kafka20.KafkaConsumerFactory",
            "stream.kafka.decoder.class.name": "org.apache.pinot.plugin.stream.kafka.KafkaJSONMessageDecoder",
            "realtime.segment.flush.threshold.rows": "0",
            "realtime.segment.flush.threshold.time": "24h",
            "realtime.segment.flush.threshold.segment.size": "100M"
        }
    },
    "metadata": {},
    "ingestionConfig": {
        "filterConfig": null,
        "transformConfigs": [{
            "columnName": "__ts",
            "transformFunction": "now()"
          }]
    },
    "quota": {
        "storage": null,
        "maxQueriesPerSecond": null
    },
    "task": null,
    "routing": {
        "segmentPrunerTypes": null,
        "instanceSelectorType": null
    },
    "query": {
        "timeoutMs": null
    },
    "fieldConfigList": null,
    "upsertConfig": null,
    "tierConfigs": null
}
Let’s go over some important sections in the table configuration. First, the JSON index. Below is the JSON snippet. It shows that the column to index is the “headers” column. It also indicates not to index below 2 levels deep.
"jsonIndexConfigs": {
            "headers": {
                "maxLevels": 2,
                "excludeArray": false,
                "disableCrossArrayUnnest": true,
                "includePaths": null,
                "excludePaths": null,
                "excludeFields": null
            }
        },
The snippet below shows the Kafka connection information.
"streamConfigs": {
            "streamType": "kafka",
            "stream.kafka.topic.name": "http_enrich",
            "stream.kafka.broker.list": "kafka:9092",
            "stream.kafka.consumer.type": "lowlevel",
            "stream.kafka.consumer.prop.auto.offset.reset": "smallest",
            "stream.kafka.consumer.factory.class.name": "org.apache.pinot.plugin.stream.kafka20.KafkaConsumerFactory",
            "stream.kafka.decoder.class.name": "org.apache.pinot.plugin.stream.kafka.KafkaJSONMessageDecoder",
            "realtime.segment.flush.threshold.rows": "0",
            "realtime.segment.flush.threshold.time": "24h",
            "realtime.segment.flush.threshold.segment.size": "100M"
        }
And last, the snippet below shows how we transform the “__ts” timestamp column with the current time.
Kafka is a publish and subscribe streaming platform. This means data could be in a state where multiple consumers can derive from it to get it to a preferred format. RisingWave preprocessed and placed the data into Kafka. This means we often will need some additional transformations before it is pushed to Pinot.
You can define transformations in the ingestion phase like extracting records from nested objects, applying simple transform functions on certain columns, filtering out unwanted columns, as well as more advanced operations like joining between datasets.
In Pinot, we need to provide a dateTime field so that it can perform temporal analytical operations. We can add this field automatically using the table configuration snippet below. This ingestion transformation sets the __ts field to the current time in milliseconds from epoch.
"ingestionConfig": {
        "filterConfig": null,
        "transformConfigs": [{
            "columnName": "__ts",
            "transformFunction": "now()"
          }]
    },
Querying JSON data in Pinot
Next, click on the “Query Console” and click on “http_encrich” from the table list. This will automatically select from the table.
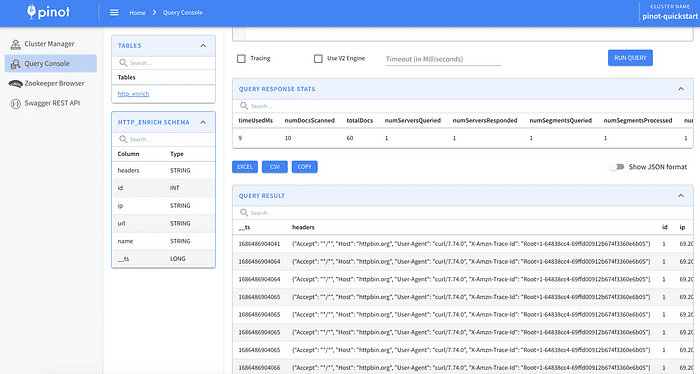
Since we used the JSON index, we can now do things like selecting records that match values in the headers JSON field. Copy and paste the SQL below to test.
select * from http_enrich
where JSON_MATCH(headers, '"$.Host"=''httpbin.org''')
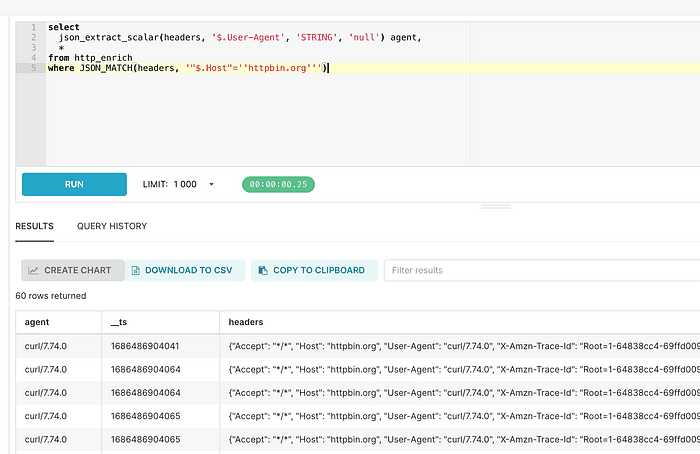
limit 10We can also extract values.
select
  json_extract_scalar(headers, '$.User-Agent', 'STRING', 'null') agent,
  name
from http_enrich
where JSON_MATCH(headers, '"$.Host"=''httpbin.org''')
Installing SuperSet and Connecting to Pinot
We’ve already added the helm superset chart to our helm repo. Although we need to modify the chart to force it to add the Pinot driver so that Superset has the libraries to connect to Pinot. Create a file called supserset-values.yaml. Notice it installed the pinotdb module using pip.
bootstrapScript:
  #!/bin/bash
  pip install pinotdb
Next, run the helm install command below.
helm install superset superset/superset -f superset-values.yamlOnce complete, go back to k9s and port forward the superset-abcdef1234 pod. Your pod name may be different.
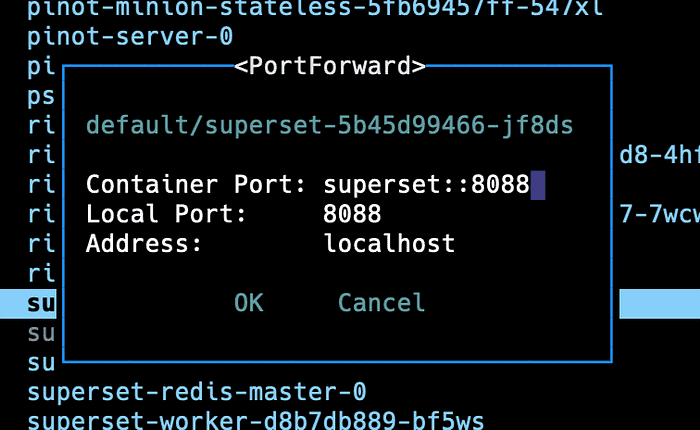
Open your browser to localhost:8088 which will take you to the Superset console. Use admin/admin as the username and password.
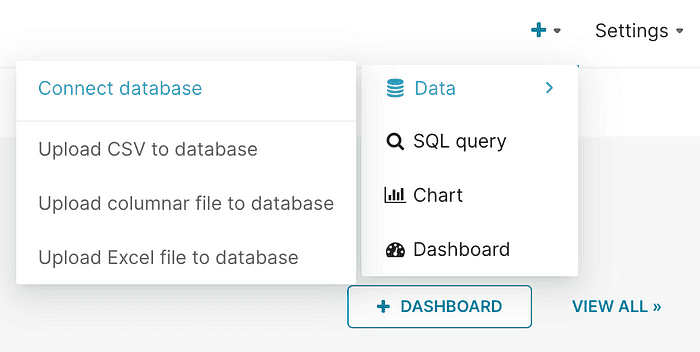
Go to the top right and create a connection to a database.
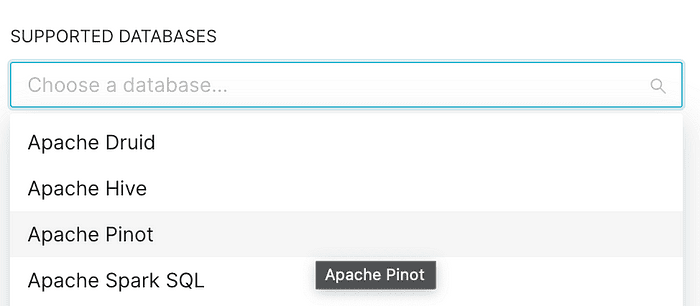
Choose Apache Pinot from the dropdown.
Use the Pinot URL below and test the connection. You should get a good connection.
pinot://pinot-broker:8099/query/sql?controller=pinot-controller:9000Instead of going through all the steps to build a dashboard in SuperSet, we’ll test using its built-in SQL feature. Start by clicking on the SQL editor at the menu bar at the top of the console. Paste any of the previous SQL statements in this post and click “Run.”
That’s it! You can continue to build datasets, charts, and dashboards for a real-time view of your data.