


Member post originally published on ByteDance’s blog by Jonathan Chan
Kelemetry is a tracing system for the Kubernetes control plane developed in ByteDance. It connects the behavior of various Kubernetes components and traces the entire lifecycle of a single Kubernetes object and the interaction between different objects and clusters to make the Kubernetes system more observable, more understandable and more debuggable.
Background
In traditional distributed tracing, a “trace” typically corresponds to the internal calls during a user request. In particular, a trace starts its root span when the user request arrives, then each internal RPC call starts a new nested span. Since the duration of the parent span is typically a superset of its child spans, the trace can be intuitively observed in the form of a tree or a flame graph where the hierarchy indicates the dependency relation between components.
Contrary to traditional RPC systems, the Kubernetes API is asynchronous and declarative. To perform an action, a component updates the spec (desired state) of an object on the apiserver, then other components keep trying to correct themselves to attain the desired state. For example, when we scale up a ReplicaSet from 3 replicas to 5 replicas, we update the spec.replicas field to 5. The native replica set controller observes this change and keeps creating new pod objects until the total number of pods is 5. When a kubelet observes a pod is created for the node they manage, they spawn containers in their node to match the spec in the pod.
In this process, we never invoked the replica set controller directly, and the replica set controller never invoked the kubelet directly. This means that we cannot observe the direct causal relationship between components. If we delete one of the original 3 pods in the process, the replica set controller would create a different pod together with the two new pods, and we cannot associate this creation as a consequence of ReplicaSet scaling or with the pod deletion. Thus, the traditional span-based distributed tracing model is barely applicable to Kubernetes due to the ambiguous definition of a “trace” or “span”.
In the past, individual components have implemented their own internal tracing, typically one trace for each “reconcile loop” (e.g. kubelet tracing only traces the synchronous operations of handling a single pod creation/update). Nevertheless, a lot of user-facing behavior can only be understood by observing multiple reconcile loops; for example, the process of scaling up a ReplicaSet can only be reasoned from multiple reconcile loops of the replica set controller handling ReplicaSet updates or pod readiness updates.
Kelemetry aims to solve the issue of observability data islands by providing a mostly-component-agnostic, non-intrusive service that collects and connects signals from different components and display relevant data in the form of trace.
Design
Objects as spans
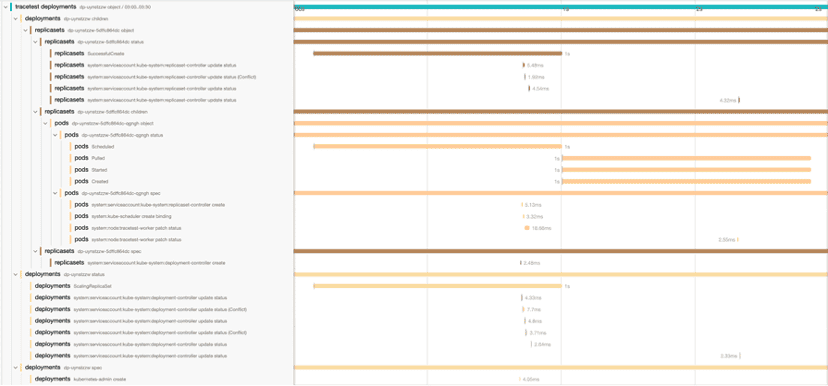
Kelemetry adopts a different approach inspired from previous projects like kspan — instead of trying to assign a single operation as the root span, a span is created for the object itself, and each event that happens on the object is a child span. Furthermore, various objects are connected together using their ownership relation such that the span of a child object is a child span of its parent object. So we end up with two dimensions: the tree hierarchy implies the object hierarchy and event scope, while the timeline implies the event order, which is often consistent with the causal relationship.
For example, when we create a single-pod deployment, the interaction between the deployment controller, replica set controller and the kubelet can be displayed in a single trace using data from audit logs and events:
As tracing is typically used to track short-lived requests that last for a few seconds, trace storage implementations may not support traces with a long lifetime or with too many spans; a trace with too many spans may cause performance issues on some storage backends as well. Hence, we restrict the duration of each trace to 30 minutes by grouping each event to the half-hour it belongs to. For example, an event that happened at 12:56 is grouped into the object span of 12:30-13:00.
We use a distributed KV store to store a mapping of (cluster, group, resource, namespace, name, field, half-hour timestamp) to the respective trace/span ID created for that object to ensure that only one trace is created for each object.
Audit log collection
One of the main data sources for Kelemetry is apiserver audit logs. The audit logs provide rich information about each controller operation, including the initiator client, the object involved, the exact duration from request receive to completion, etc. In the Kubernetes architecture, each object change triggers its watching controllers to reconcile and lead to subsequent object changes, so observation of relevant audit logs for object changes helps understand the interaction between controllers in a series of events.
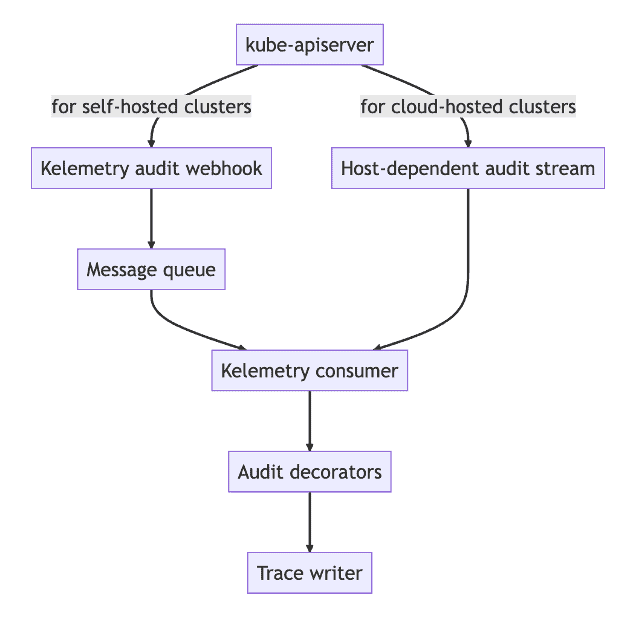
Kubernetes apiserver audit logs are exposed in two different ways: log file and webhook. Some cloud providers implement their own ways to collect audit logs (e.g. Amazon EKS, GKE), and vendor-agnostic approaches to configure audit log collection have little progress in the community. To simplify the deployment process for self-provisioned cluster, Kelemetry provides an audit webhook server to accept native audit webhook requests, but a plugin API is also exposed to implement consumption of audit logs from vendor-specific message queues.
Event collection
Kubernetes controllers emit “events” associated with objects as they process them. Events are displayed when the user runs kubectl describe; they generally provide a more user-friendly description of the controller processing. For instance, when the scheduler is unable to schedule a pod, it emits a FailToSchedulePod event with the detailed message:
0/4022 nodes are available to run pod xxxxx: 1072 Insufficient memory, 1819 Insufficient cpu, 1930 node(s) didn’t match node selector, 71 node(s) had taint {xxxxx}, that the pod didn’t tolerate.
Since events were optimized for the kubectl describe command, they do not preserve every original event. Instead, they store the last timestamp and number of times the event was recorded. On the other hand, Kelemetry retrieves events using the object list-watch API in Kubernetes, which only exposes the latest version of the event object. In order to avoid duplicating events, Kelemetry uses several heuristics to “guess” whether an event should be reported as a span:
- Persist the timestamp of the last event handled, and ignore events before this timestamp after restart. While events are not necessarily guaranteed to be received in order (due to client-side clock skew, inconsistent latency in the controller-apiserver-etcd roundtrips, etc), this latency is relatively small and eliminates most events duplicated due to controller restart.
- Validate that the resource version of events have changed, avoiding duplicates caused by relists.
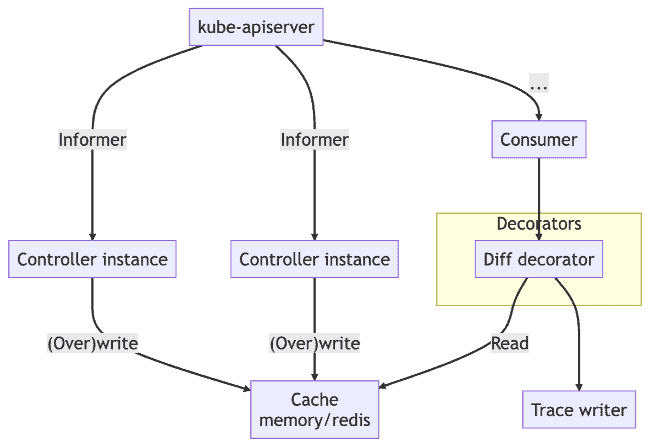
Linking object state to audit logs
When studying the audit logs for troubleshooting, what we want to know the most is “what did this request change” instead of “who made this request”, especially when the semantics of each component is not clear. Kelemetry runs a controller to watch object creation, update and deletion events and associates them with the audit span when the audit event is received. When a Kubernetes object is updated, its resourceVersion field is updated to a new unique value. This value can be used to associate which audit log the update corresponds to. Object diffs and snapshots are cached in a distributed KV store, so that they are later linked from the audit consumer so that each audit log span contains the fields changed by the controller.
Tracking resource versions also helps identify 409 conflicts between controllers. A conflicting request happens when the resource version passed by the client is too old, and the other request that it conflicts with is the request that changed the resource version from this old version to another version. Kelemetry is able to group multiple audit logs with the same old resource version together to display audit requests with their subsequent conflicts as related child spans.
To ensure seamless availability, the controller uses a multi-leader election mechanism, allowing multiple replicas of the controller to watch the same cluster concurrently so that no events are lost when the controller restarts.
Frontend trace transformation
In traditional tracing, a span always starts and ends in the same process (often the same function). Therefore, tracing protocols such as OTLP do not support modifying a span after its completion. This is unfortunately not the case for Kelemetry, because an object is not a running function and there is no process dedicated for starting or stopping its span. Instead, Kelemetry finalizes an object span immediately after creation, and writes additional data as child spans instead. This is why each audit log and event is a child span instead of a log on the object span.
Nevertheless, since the end time/duration of audit logs is usually of little value, the trace view is very ugly and space-inefficient:
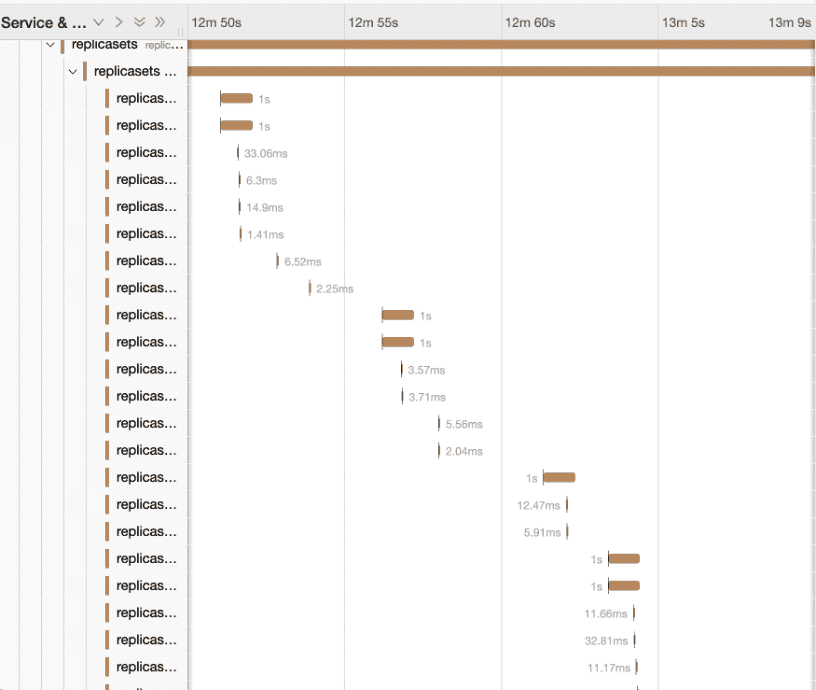
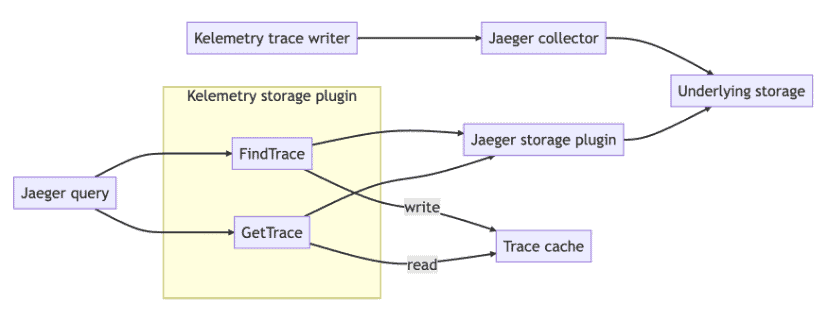
To improve the user experience, Kelemetry intercepts the layer between the Jaeger query frontend and the storage backend to execute a custom transformation pipeline on the storage backend result before returning it to the query frontend.
- Kelemetry currently supports 4 transformation pipelines:
- Tree: The original trace tree after simplifying field names like service name/operation name
- Timeline: Prune all nested pseudo spans, placing all event spans under the root span, effectively providing an audit log
- Tracing: Non-object spans are flattened into span logs of the relevant object
- Grouped: On top of the Tracing pipeline output, a new pseudo-span is created for each data source (
audit/event). When multiple components send their spans to Kelemetry, a component owner can focus on the logs of their own component and cross-check other components logs with ease.
Users can select a transformation pipeline by setting the “Service name” during trace search. The intermediate storage plugin generates a new “cache ID” for each trace search result and stores it with the actual trace ID and the transformation pipeline into a cache KV store. When the user views a trace, they pass the cache ID, which is transformed by the intermediate storage plugin into the actual trace ID and execute the transformation pipeline associated with the cache ID.
Breaking through the duration limit
As mentioned above, traces cannot grow indefinitely because it might cause problems with some storage backends. Instead, we start a new trace every 30 minutes. This leads to confusing user experience, because the trace for a deployment that started rolling at 12:28 would suddenly terminate at 12:30, and the user has to manually jump to the next trace at 12:30 in order to continue viewing the trace. To avoid this cognitive overhead, the Kelemetry storage plugin identifies spans with identical object tags when searching the trace and stores them together with the same cache ID, along with the search time range specified by the user. When rendering the spans, all related traces are merged together, object spans with identical object tags are deduplicated and their children are merged. The trace search time range becomes the clipping range of the traces, displaying the full story of the group of objects as a single trace.
Multi-cluster support
Kelemetry can be deployed to monitor events from multiple clusters. In ByteDance, Kelemetry creates 8 billion spans (excluding object spans) each day (using a multi-raft cache backend instead of etcd). Objects can link to a parent object from a different cluster to enable tracing for cross-cluster components such as federation.
Future enhancements
Adopting custom trace sources
To truly connect observability between all the islands of the K8S ecosystem, audits and events are not comprehensive enough. Kelemetry will collect traces from existing components and integrate them into the Kelemetry trace system to provide a unified and specialized view of the entire system.
Batch analytics
With the aggregated trace from Kelemetry, it is much easier to answer questions such as “how long did this deployment take to progress from deployment upgrade to the first image pull?”, but we still lack the ability to aggregate these metrics at a large scale to provide insights on the overall performance. By analyzing the trace output from Kelemetry every half-hour, we can identify patterns in a series of spans and associate them as different scenarios.
Use cases
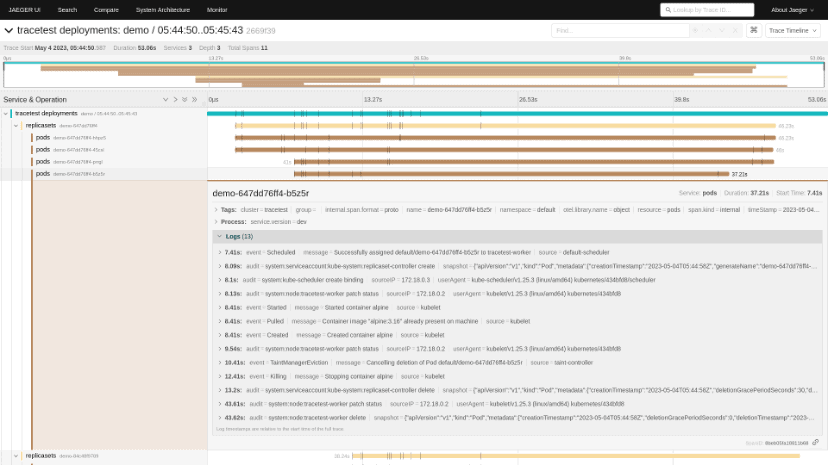
- Discover bnormal replicaset controller
A user reported that a single-replica deployment keeps creating new pods. We can quickly look up the Kelemetry trace by the deployment name to analyze the relation between the replicaset and the pods it creates:
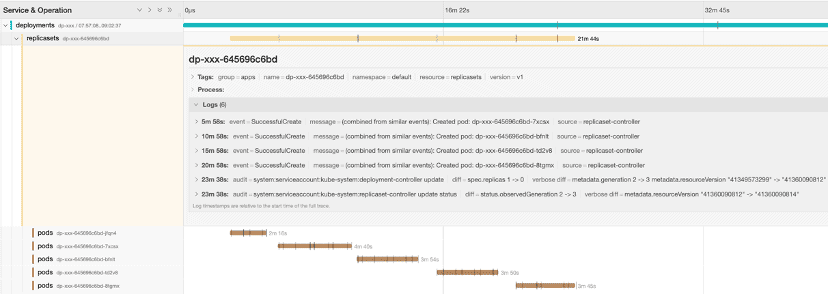
Using the trace, we can observe several key points:
- The replicaset controller emits
SuccessfulCreateevent, implying that the pod creation request returns successfully and is ACK’ed by replicaset-controller in its replicaset reconcile loop. - There are no replicaset status update events, implying that the pod reconcile loop in replicaset-controller failed to update the replicaset status or did not observe the pods.
Furthermore, looking at the trace of one of the pods:
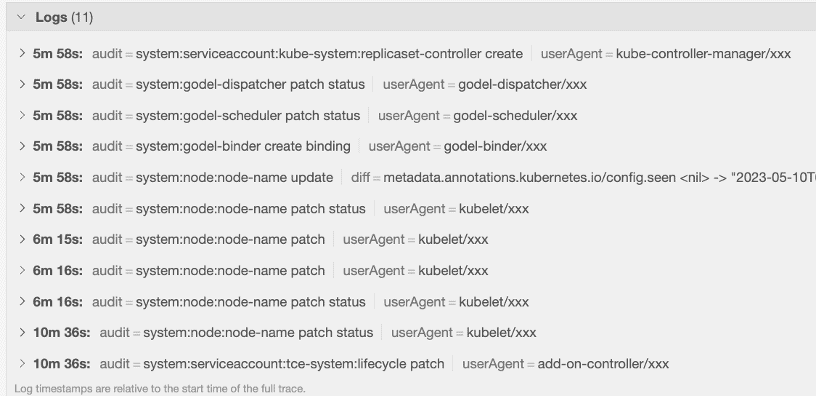
- The replicaset-controller never interacts with the pod again after its creation, not even failed update requests.
Therefore, we can conclude that the pod cache in replicaset-controller is very likely inconsistent with the actual pod store on the apiserver, and we should look into possible performance or consistency issues with informers. Without Kelemetry, debugging this issue would involve viewing the audit logs of various pods from multiple apiserver instances.
- Debugging inconsistent minReadySeconds
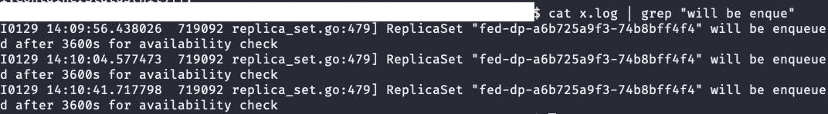
A user complains that rolling a deployment is very slow, taking several hours from 14:00 to 18:00. Without using Kelemetry, we can look up the object from kubectl, the minReadySeconds field is 10, so the long rolling time is unexpected. The kube-controller-manager logs show that the pod only becomes ready after one hour:
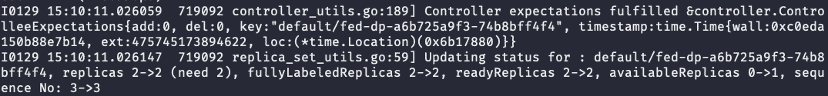
Further looking up kube-controller-manager logs show that the minReadySeconds is 3600 at some point.
Using Kelemetry for debugging instead, we could directly look up the trace by the deployment name and discover that the federation component increased the minReadySeconds.
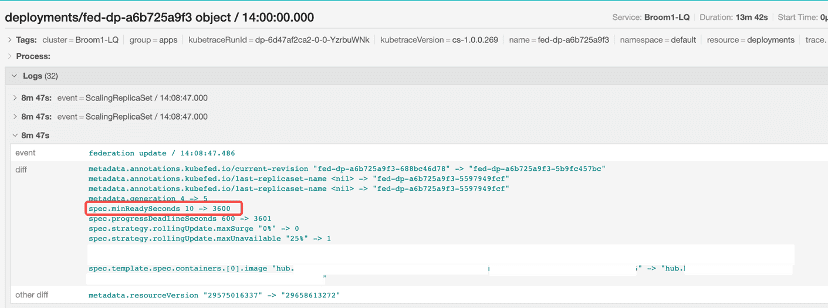
The value got restored to 10 by the deployment controller later on:
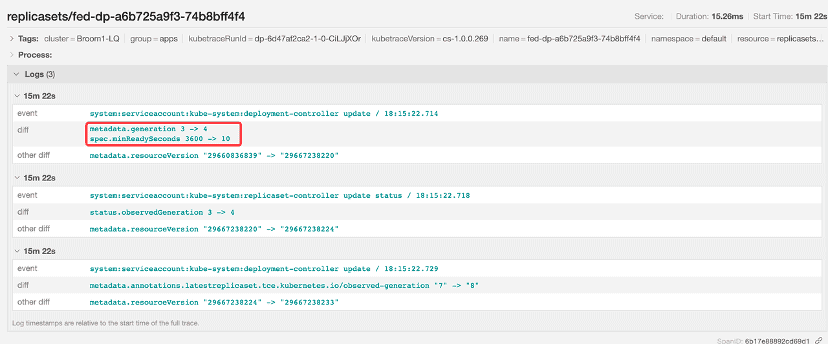
So we can conclude that the issue was caused by a large minReadySeconds temporarily injected by the user during the rollout. The object diff helps easily identify issues caused by unexpected intermediate states.
Try Kelemetry
Kelemetry is open source on GitHub. Follow the quick start guide to see how Kelemetry interacts with your components, or if you don’t want to setup a cluster, check out the online preview rendered from a GitHub CI pipeline.
Github: github.com/kubewharf/kelemetry
Quick start: https://github.com/kubewharf/kelemetry/blob/main/docs/QUICK_START.md