

Member post originally published on the Helios blog by Ran Nozik
Leveraging open source projects and creative thinking helped us deliver trace-based alerts to our customers swiftly and efficiently.
One of the qualities of engineering team excellence is thinking outside the box to find creative solutions to hard problems. It’s our responsibility, as dev leaders, to pass on to the next generations of developers tips and tricks to help them look beyond the surface to solve complex business problems and leverage the power of the open-source community, when possible.
At Helios, this DNA recently led to us delegating complex logic to a proven open-source project (Prometheus). We worked on incorporating an alerting mechanism into our product. Now, alerting is nothing new – many software products offer it to notify users of events in their system/products; but the fact that it’s not new doesn’t mean it’s not challenging. We solved this challenge by leveraging Prometheus (more specifically, an AWS Managed Prometheus, that we chose to use to reduce the maintenance overhead of managing it internally), already in-use by our OpenTelemetry collector metrics pipeline, to build an alerting mechanism in a way that both answered a product need for our users and also saved us a ton of time and effort in developing and maintaining it.
In this blog post, I walk through this solution and hope it inspires devs to think creatively about every-day challenges they may encounter. I hope our experience shows how we built a solution, using open source projects, that greatly improves efficiency so that engineering teams can spend precious time solving more business challenges.
In the below sections I cover:
- Why we turned to an open source project to set up our alerting mechanism
- A technical deep dive into how we built the alerts
- Pros and cons of using Prometheus in our approach; and
- Some concluding words
Setting up an alerting mechanism: No need to reinvent the wheel
OpenTelemetry (OTel) is an open-source observability framework that helps developers generate, collect, and export telemetry data from distributed applications. The data that we collect with OTel includes a few different signals: distributed tracing data such as HTTP requests, DB calls, messages sent to all sorts of communications infrastructures, and metrics such as CPU usage, memory consumption, OOM events, etc.
We set out to build an alerting mechanism based on this data, as well as data from other sources, to enable our users to configure conditions according to which they would be alerted to events in their system. For example, users could receive alerts over an API that’s failing, a DB query that’s taking longer than expected, or a Lambda that OOMed. They could essentially set alerts based on the granularity they want and with the desired notification frequency.
As I mentioned before, many software products are expected to offer an alerting mechanism so that users can get updates on events happening in their app or other important business KPIs. This is a common feature, but it’s still complex to build.
In our solution, we wanted to achieve three things:
- Implement alerts based on distributed tracing data seamlessly (without having to work too hard!)
- Make everything native to OTel data models; and
- A fast time-to-market
In order to do this, we turned to open source: we leveraged the Alerts Manager module from Prometheus. Prometheus is an open-source, industry standard for monitoring and alerting designed for tracking the performance and health of applications and infrastructure. Prometheus collects metrics from various sources and offers a flexible query language for analyzing and visualizing the data. It’s one of the most common backends for collecting OTel metrics, and we already had Prometheus in our backend to support the metrics collection.
We relied on an open source tool like Prometheus to do the legwork for us because such solutions were built by dozens of smart and experienced developers who worked on them for years, adapted them to support many use cases, and have already gone through all (or at least most) of the pitfalls in that domain. We had an internal discussion about the alerts mechanism design, and the idea to leverage Prometheus was brought by some members of the team based on their previous experience with it.
Deep dive: How we built the alerting mechanism
With Prometheus in hand, we started to work on adding the alerting mechanism. We wanted to start by alerting on traces, or more accurately on spans (e.g., the result of an HTTP request or a DB query). Prometheus offers alerts on metrics, but we needed alerts on traces. The data from the traces doesn’t get to Prometheus as-is – it needs to be converted into its data model. So in order to have Prometheus actually alert over spans, we needed to take a span, convert it to a metric, and configure an alert that is triggered by it. When a trace (span) matched an alert condition – for example a DB query taking longer than 5 seconds – we converted the span into a Prometheus metric.
The Prometheus model fit what we were aiming to achieve. For every event, we get the raw data from OTel and we feed it through Prometheus as a metric. We can then say, for example, that if a specific operation error occurs more than three times in five minutes, an alert should be activated.
We did not stop there. In Helios, a major benefit for our users is that we can go from distributed tracing data to a metric – but also back from a metric to the specific trace, because we maintain the context of the metric. Users can set trace-based alerts, and then go back from the alert to the E2E flow for fast root cause analysis. This gives users the ultimate visibility into the performance and health of their applications. The available context (based on the instrumented data) helps users easily pinpoint issues and bottlenecks in their app flows for quick troubleshooting and accelerated mean-time-to-resolution (MTTR).
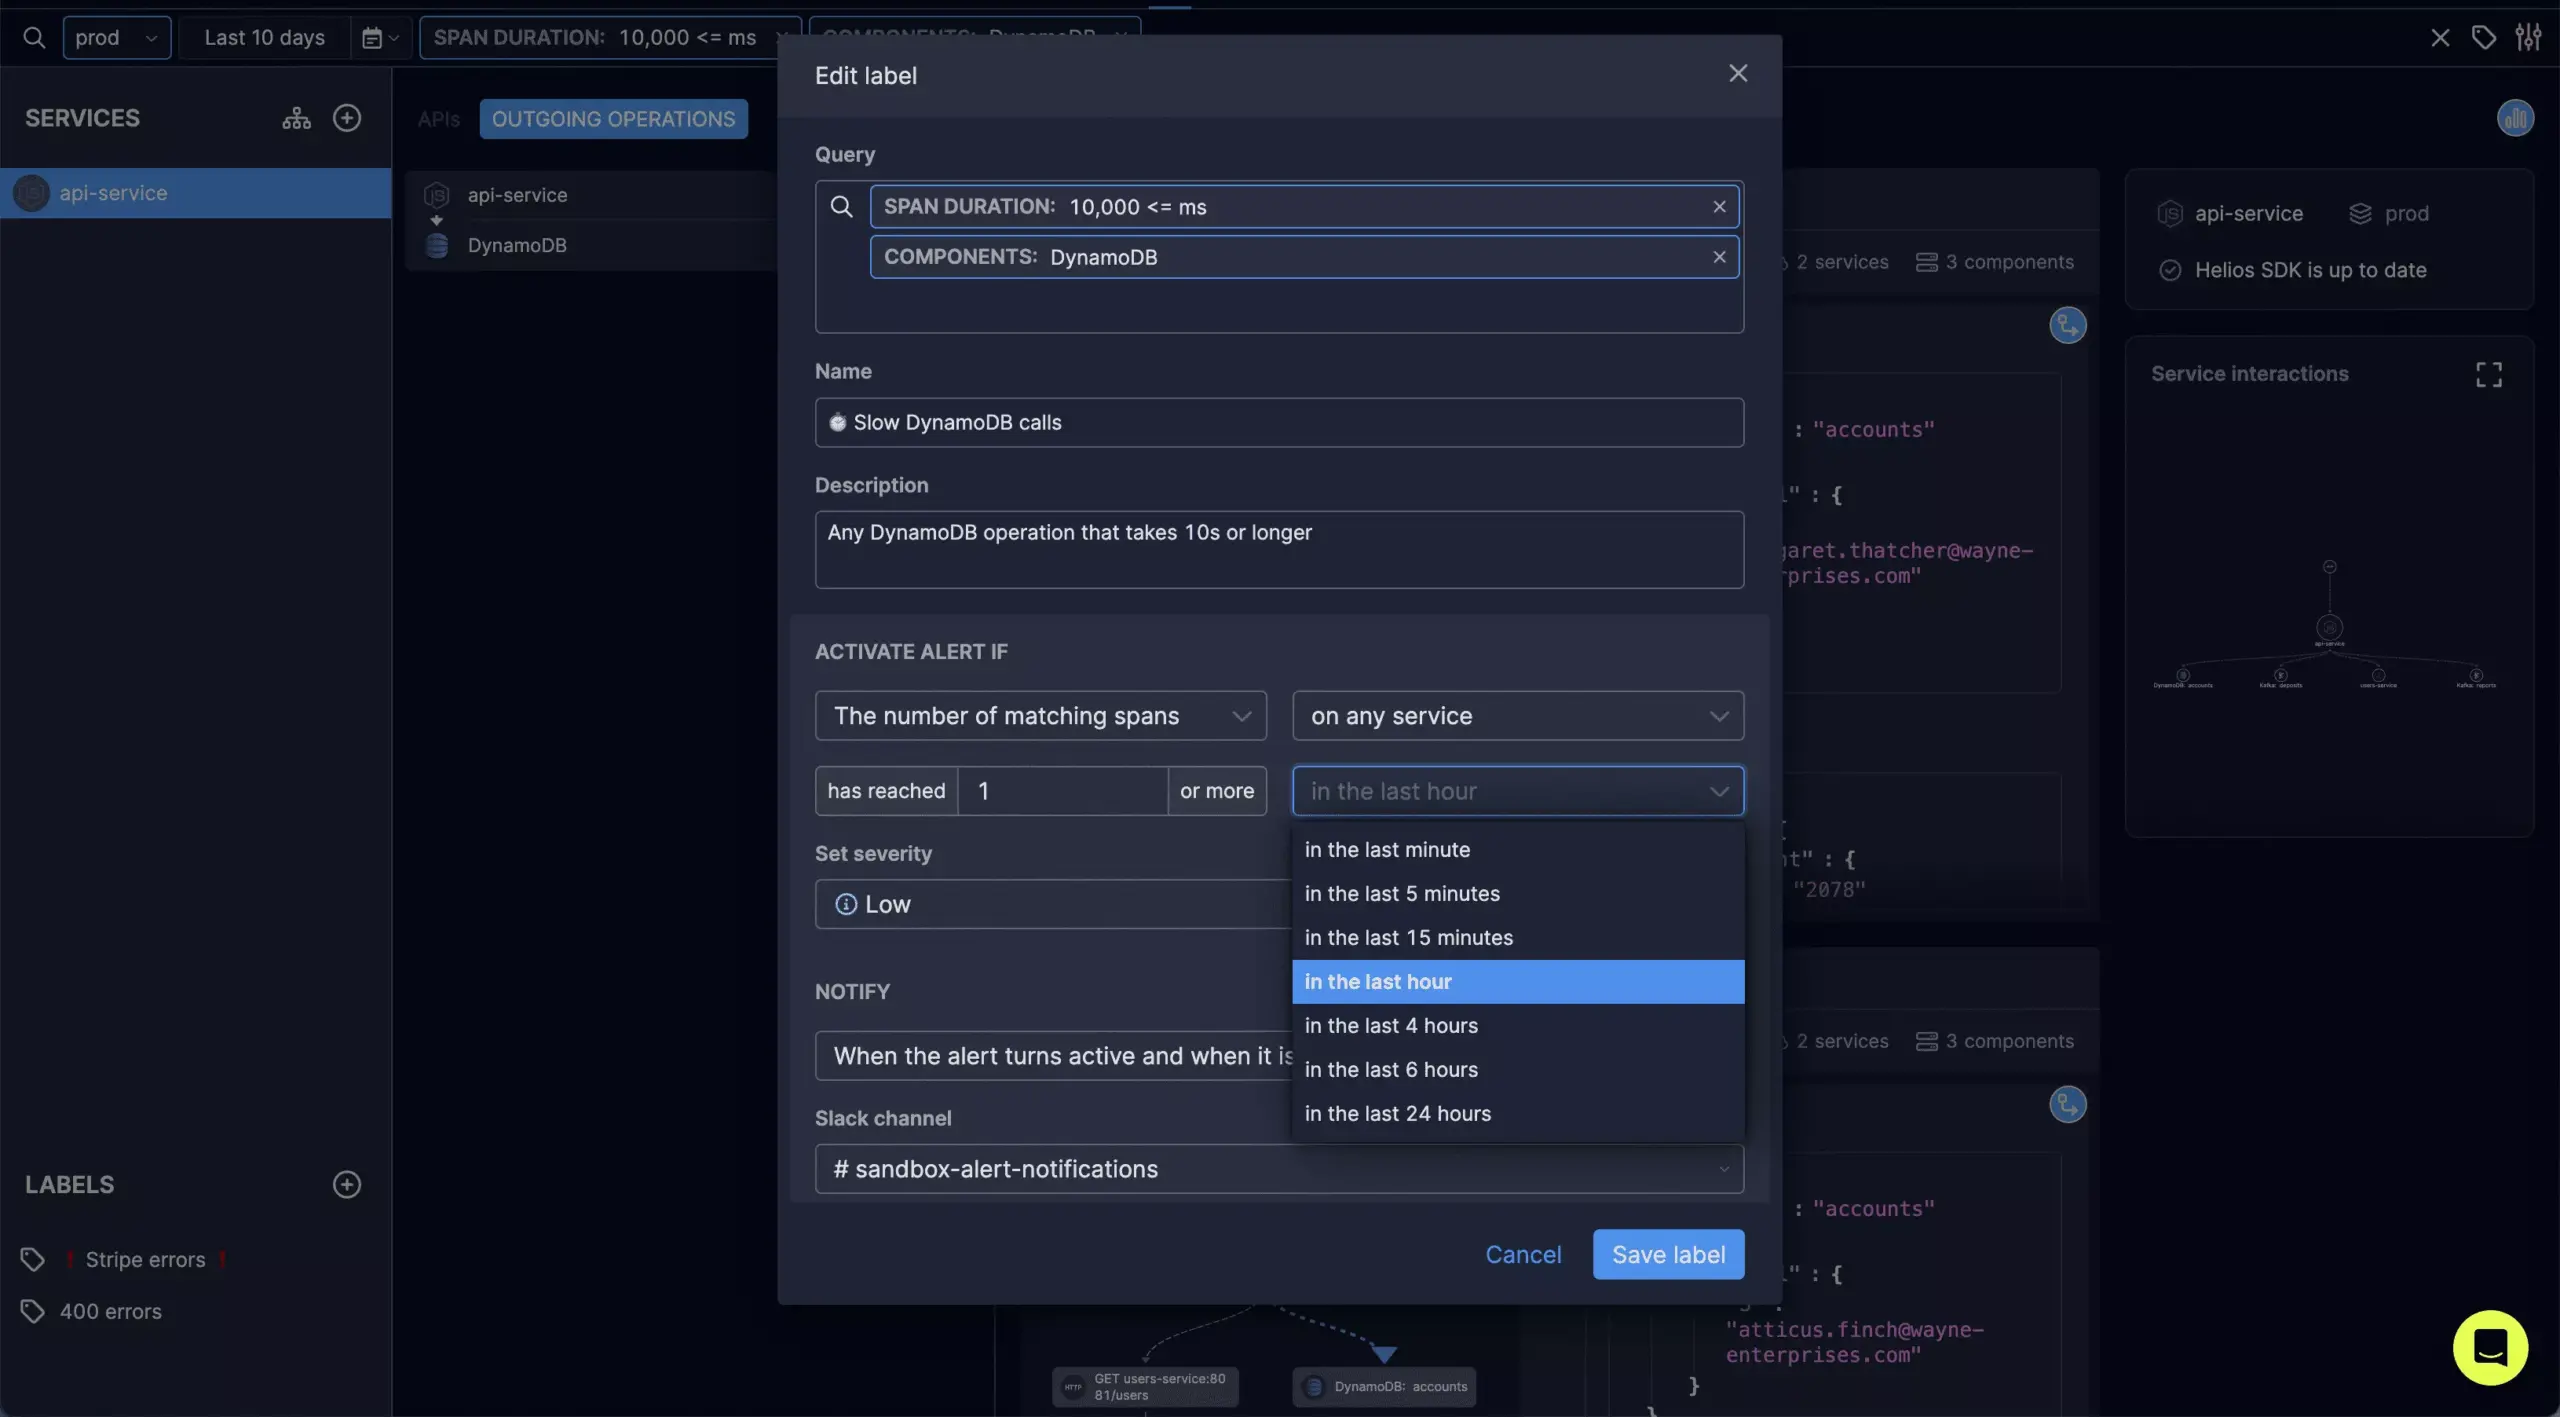
Trace-based alerts
In our alerting mechanism, what we built was designed to alert on behaviors that can be defined on tracing data, such as a failed HTTP request made by service A to service B, a MongoDB query to a specific collection that took more than 500 ms, or a Lambda function invocation failure.
Each of the above can be described as a filter on spans, based on standard OTel attributes (like HTTP status code, span duration, etc.). On top of these filters, we support various aggregation logics (e.g., if the number of matching spans reached X in a period of Y). An alert definition is therefore essentially a filter and an aggregation logic.
The implementation consists of three parts:
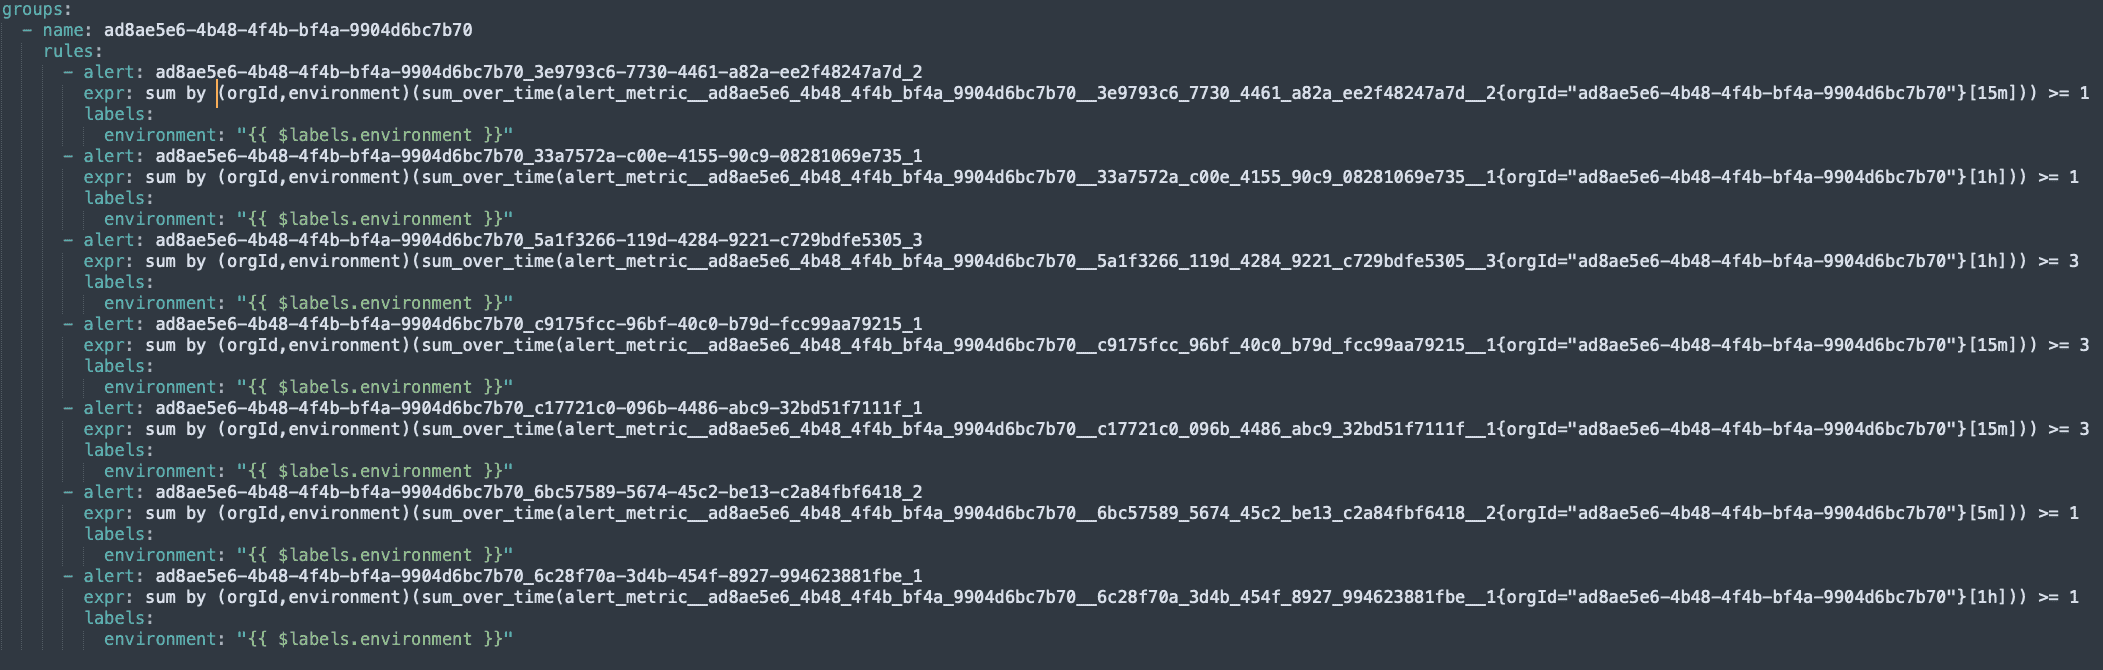
- Creating a unique metric per alert definition
- Converting its aggregation logic into a PromQL query and updating the Prometheus Alert Manager with the alert definition
- Continuously converting spans that match the alert filter into Prometheus time series, that will (when relevant) meet the alert aggregation definition and trigger an alert
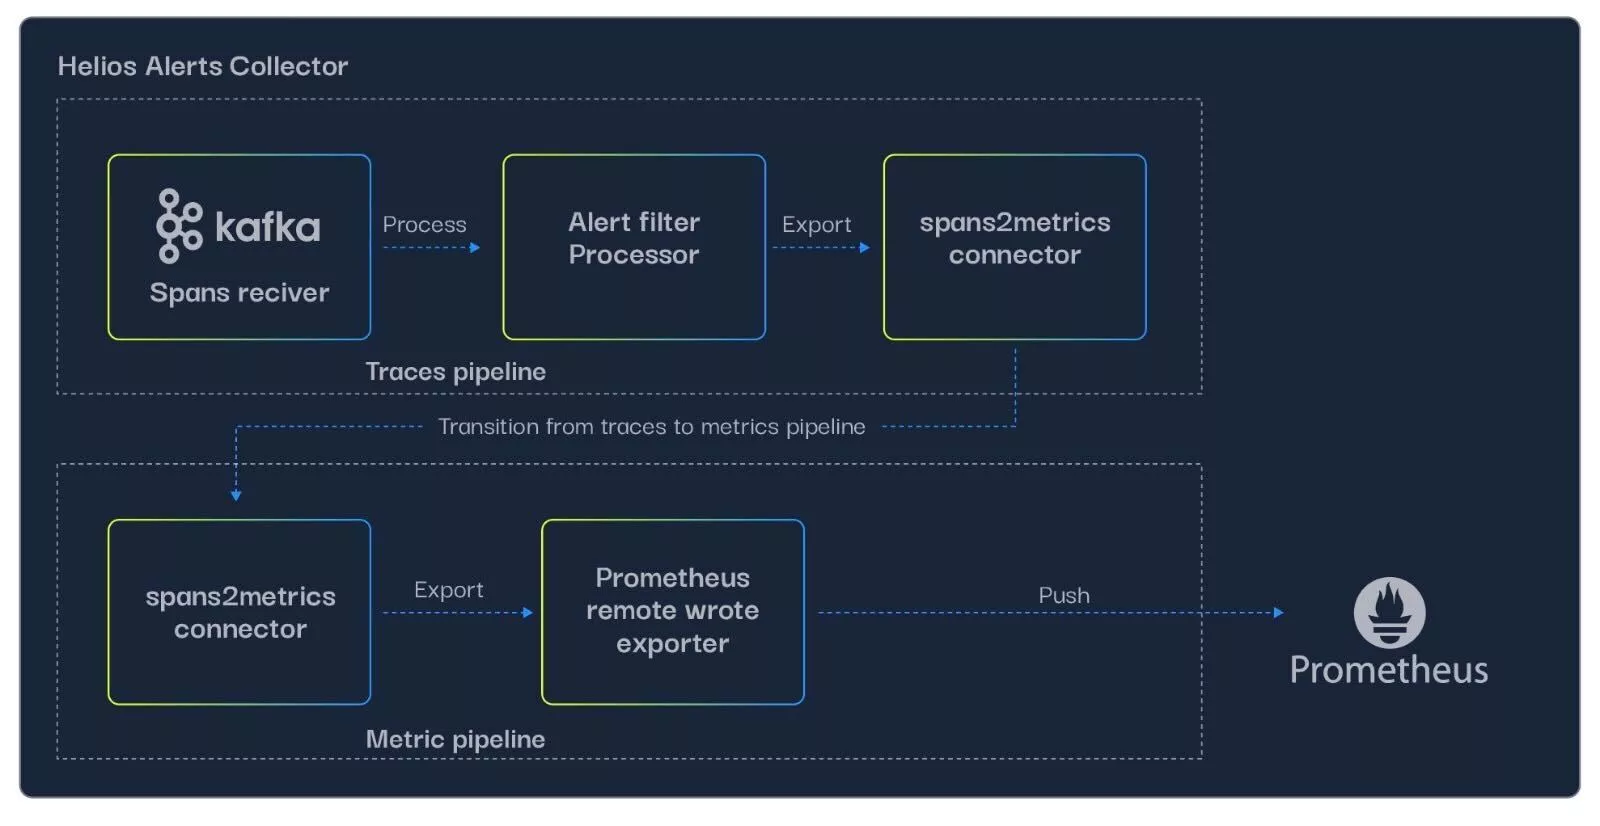
We wanted to keep things as OTel-native as possible, and therefore built the alerting pipeline based on the OTel Collector, by doing the following:
- Created the alert matcher collector, which uses a kafka receiver to handle spans in the OTLP format that were sent from our “frontline” collector (the one that receives data from our customers’ OTel SDKs).
- The kafka receiver is connected (as part of a traces pipeline) to the alert matcher processor, a custom processor we built that loads the filters configured by our customers in the Helios UI, and filters the spans accordingly.
- After filtering the relevant spans, we needed them to be exported as metrics to Prometheus. We did that by implementing a connector, a relatively new OTel collector feature that allows connecting pipelines of different types (in this case, trace and metrics). The spans-to-metrics connector converts each matching span to a metric, with the following properties:
- Its name is built from the customer ID and alert definition ID from our DB.
- Its labels are trace ID, span ID, timestamp, service name, etc.
- The metrics are exported to a managed AWS Prometheus using prometheus remote write exporter.
Prometheus did its magic pretty much out of the box, with a few minor details we had to pay attention to, due to it being AWS-managed (e.g., alerts can only be reported using SNS-SQS).
From alert to root cause
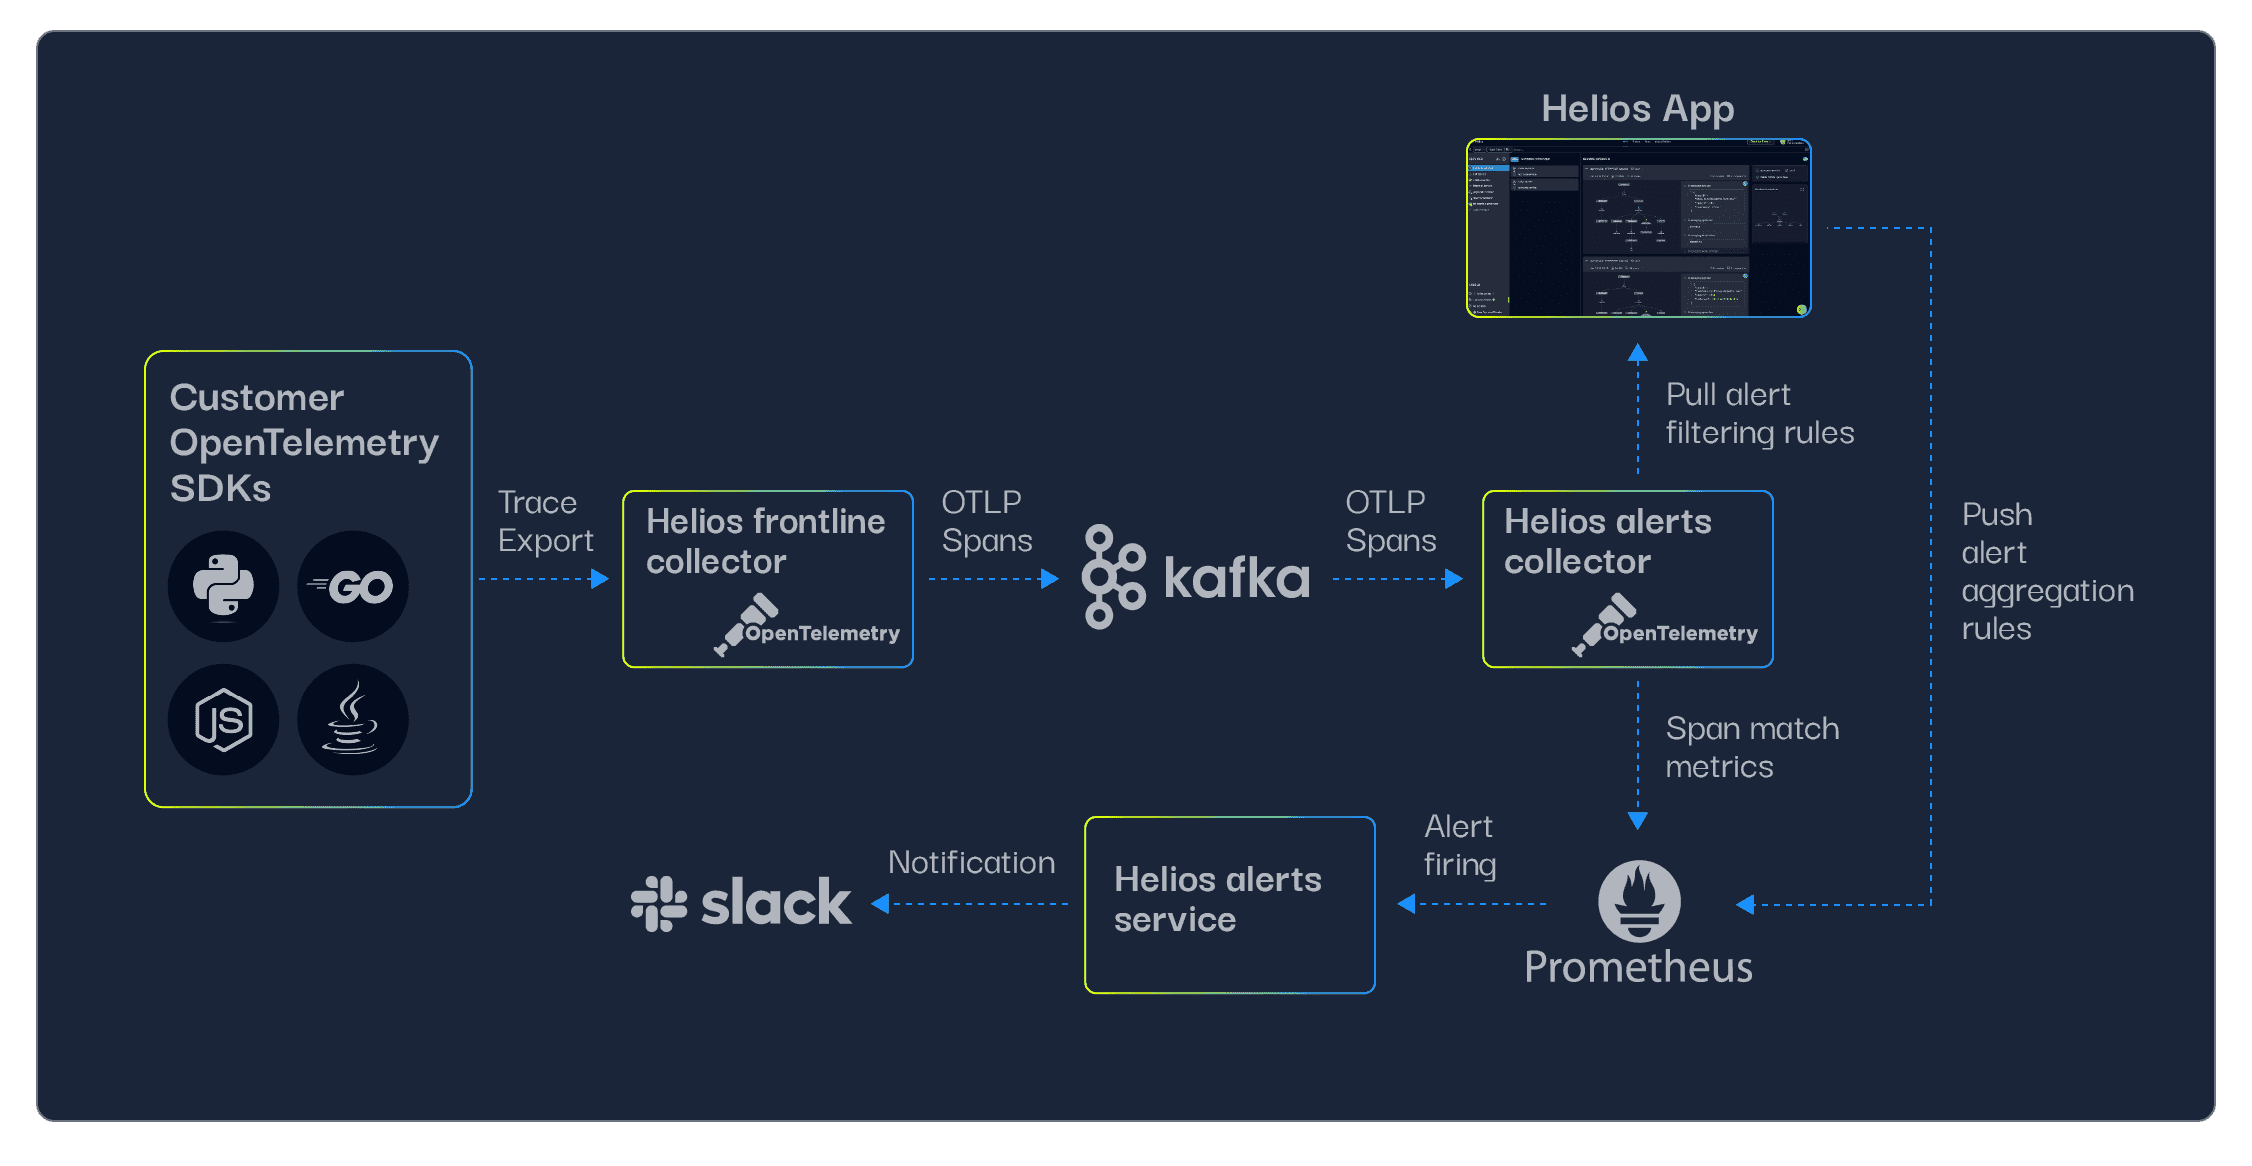
So we have trace-based alerts, but to ensure fast root cause analysis we also wanted to provide the full applicative context when an alert is fired. Once an alert is triggered, we query Prometheus for the alert definition’s time series (as mentioned earlier, a combination of customer and alert definitions IDs), and get a list of metrics as instances of the alert query – each one with its matched span and trace IDs. For example, if the alert is configured on a long-running DB query, the example trace will contain the query itself and its entire trace.
The entire mechanism looks something like this:
Pros and cons to using Prometheus alerts as our approach
The approach that we used for our alerting mechanism is converting OTel tracing data into Prometheus metrics in order to leverage Prometheus’s Alert Manager, saving the need to implement our own alerts backend. Let’s look at some of the disadvantages and advantages of this approach.
For all its benefits, sometimes using an open source tool (or any external component that your team has no control over) can be tricky because you’re essentially getting a “black box” – if its APIs and integration mechanisms don’t fit your architecture, you might have more work cut out for you, or even get blocked entirely.
Let’s look at an example. In Prometheus, configuring an alert is done by updating their YAML definition using an API call. The AWS-managed Prometheus we’re using, however, supports updating these definitions with an AWS API call, which doesn’t update Prometheus directly but rather makes the actual updates in a periodic sync. To prevent issues with this behavior (e.g., consecutive updates to an alert definition that fails since the first update hasn’t synced yet), we had to implement a periodic sync mechanism of our own, that encapsulates the updates. If we were building this solution from scratch, we’d have full control over this mechanism and could make updates whenever we’d want. Here, with AWS Managed Prometheus, we don’t have this control and this forced us to build an additional sync mechanism.
Also, you may want to tweak some of the features of the solution – i.e. in our case we wanted to provide more granular data when an alert is sent – and that may be a cumbersome process. For example, getting the matched span IDs for an alert that was triggered by them directly upon receiving the alert (i.e., as part of the payload of the alert reported by Prometheus) did not work for us out of the box, so we had to send another API call to Prometheus and query for them, adding some small overhead.
Despite these challenges, we knew that implementing this functionality ourselves without relying on Prometheus would have been much harder. Instead of developing an alerting logic from scratch, which would involve design (different components, storage, etc.), implementation, and probably several iterations of bug fixes and feedback, we had a solution out of the box, saving us a ton of development time.
With Prometheus, a proven open source tool with rich capabilities, we knew we were getting peace of mind. We knew that future use cases would be covered by the tool, and that it would be production ready and would pass through numerous users that shaped it and finetuned it, and this gave us a lot of confidence while saving us time. We knew that any alerting logic we may think of in the future is likely already implemented in Prometheus. If we had built it ourselves, a wrong design choice may have meant that we would have to break our design or write bad code to support new use cases.
Additionally, one of the benefits to our approach was making everything native to OTel data models. This means everything is filtered, processed, exported, and received by the OTel collector, and it doesn’t matter if it’s a span (like a failed HTTP request) or a metric (like a high CPU rate).
Conclusion
Developing an alerting mechanism in Helios could have been hard, but with some creative thinking and open source collaboration, we made it happen efficiently and confidently. We leveraged OTel and Prometheus and delivered a complex alerting mechanism in a solid turnaround time. We found a way to correlate spans and metrics so that when we take spans and convert them to metrics, we know how to connect the alert back to the business logic.
We hope this experience inspires developers not only to solve complex problems using open source, but also to become good partners to our users. Innovation is key, but beyond innovation for innovation’s sake, we want to make an impact on users and improve the experience for them – and we hope you will too.