


Community post by Selvam R, DevOps Engineer, Chennai (Winner of the KCD Chennai Blogathon)
Kubernetes is a popular open-source platform for container orchestration that is widely used by developers and DevOps teams for deploying and managing containerized applications. One critical aspect of running any application on Kubernetes is logging, which helps to monitor the health and performance of the application and troubleshoot issues quickly.
In this blog, we will discuss Kubernetes logging and the best practices for logging in a Kubernetes environment.
What is Kubernetes Logging?
Kubernetes logging refers to the process of capturing and storing log data generated by the Kubernetes cluster and the applications running on it. This data includes information about application performance, errors, warnings, and other events. Kubernetes logs are critical for debugging and troubleshooting issues in a distributed system and are used by developers, operators, and security teams to monitor and maintain application health.
How does Kubernetes Logging work?
Kubernetes logs are generated by various components of the Kubernetes cluster, including the Kubernetes API server, kubelet, container runtime, and the applications running on the cluster. These logs are collected and aggregated by a logging agent that runs as a Kubernetes pod and sends them to a central location for storage and analysis.
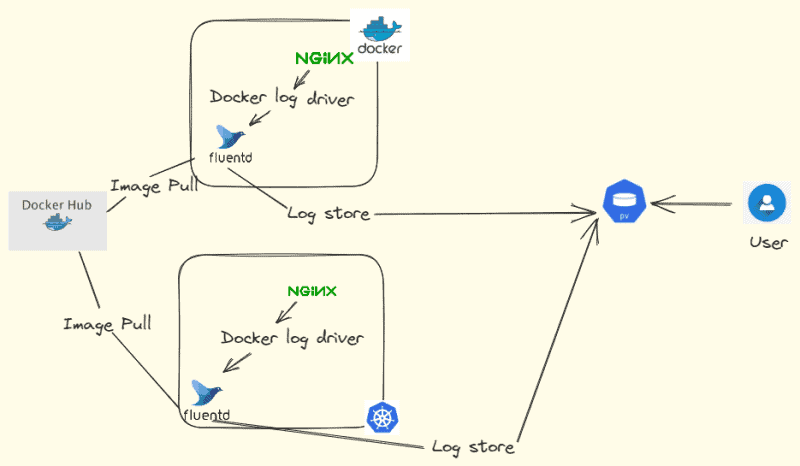
The most common logging agent used in Kubernetes is Fluentd, which is an open-source data collector that can collect, transform, and forward log data to various destinations, including Elasticsearch, Splunk, and Kafka. Other popular logging agents include Logstash and Fluent Bit.
Here is the diagram for how logging using Fluentd works.
Best Practices for Kubernetes Logging:
Here are some best practices for logging in a Kubernetes environment:
- Use a centralized logging solution — A centralized logging solution allows you to store and analyze logs in a central location, making it easier to troubleshoot issues and monitor application performance. Elasticsearch, Splunk, and Loggly are some popular centralized logging solutions used with Kubernetes.
- Implement log rotation — Log rotation is the process of deleting or archiving old logs to prevent disk space from filling up. It is essential to configure log rotation for your Kubernetes logs to avoid running out of disk space.
- Use structured logging — Structured logging formats log messages in a structured way, making it easier to search, filter, and analyze log data. Use JSON or other structured logging formats instead of plain text to make it easier to extract information from logs.
- Avoid logging sensitive information — Avoid logging sensitive information such as passwords, API keys, and other credentials in your Kubernetes logs. Instead, use environment variables or secrets to store this information securely.
- Include contextual information — Including contextual information such as timestamps, hostnames, and request IDs in your logs makes it easier to correlate log events and troubleshoot issues.
- Tagging privacy information:
To ensure the security and privacy of sensitive data, it is advisable to tag or mask any sensitive information present in your logs. You can use a standardized format like “priv” or “****” to identify and mask sensitive data such as passwords, credit card numbers, or personally identifiable information (PII).
- Using different log levels:
Utilizing different log levels allows you to categorize log messages based on their severity or importance. Common log levels include DEBUG, INFO, WARNING, ERROR, and CRITICAL. By using appropriate log levels, you can filter and prioritize log messages based on their significance during troubleshooting and debugging.
- Streaming logs to a log server:
Rather than relying solely on local log files, it is recommended to stream logs to a centralized log server or a log management system. This ensures that logs are collected and stored centrally, making it easier to search, analyze, and retain logs for longer periods. Popular log servers and management systems include Elasticsearch, Splunk, and Graylog.
- Enabling log rotation:
Configure log rotation to prevent log files from growing indefinitely and consuming excessive disk space. By setting log rotation parameters, you can control log file size, number of log files to retain, and frequency of rotation. This practice ensures that logs are managed efficiently and prevents disk space issues.
While kubectl logs is the standard command for retrieving logs in Kubernetes, there are also several open-source CLI tools available that provide additional features and enhanced log collection capabilities. One such tool is kubetail, which allows you to tail logs from multiple pods simultaneously. Here are a few open-source CLI tools that you can use for log collection in Kubernetes:
- Kubetail:
Kubetail is a simple utility that enables you to tail logs from multiple pods within a Kubernetes cluster. It aggregates logs from multiple pods and streams them to your terminal, allowing you to view real-time logs from various sources at once. Kubetail is particularly useful when troubleshooting distributed systems or monitoring application behavior across multiple pods.
- Stern:
Stern is another powerful log tailing tool specifically designed for Kubernetes. It allows you to tail logs from multiple pods and containers within a Kubernetes cluster, providing color-coded output for easy identification. Stern also supports regex-based filtering, making it convenient to focus on specific log messages or patterns.
- Kail:
Kail is a CLI tool that enables log streaming and tailing from multiple pods in a Kubernetes cluster. It supports log output in both raw and JSON formats, making it flexible for different use cases. Kail also provides options for filtering logs based on labels or namespaces, allowing you to narrow down log output as needed.
- Logcli:
Logcli is part of the Loki ecosystem and provides a command-line interface to query logs stored in Loki, a horizontally scalable log aggregation system. It allows you to search and retrieve logs based on various parameters, including labels, time ranges, and log levels. Logcli is useful when you have a centralized logging solution based on Loki and want to query and analyze logs efficiently.
These open-source CLI tools provide additional functionality and flexibility for log collection and analysis in Kubernetes. Depending on your specific requirements, you can choose the tool that best fits your needs and integrates well with your existing logging infrastructure.
Please note that when using any third-party tools, ensure that they are from trusted sources and review their documentation for installation and usage instructions.
There are various commands that you can use to check logs in a Kubernetes environment. Here is a list of commands that you can use with kubetail to check Kubernetes logs:
- To tail logs from a specific pod:

This command will stream and display logs from the specified pod. You can include multiple pod names to tail logs from multiple pods simultaneously.
2. To tail logs from pods matching a label selector:
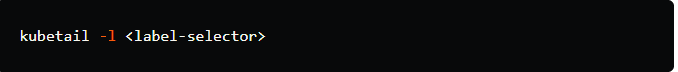
This command will stream and display logs from all the pods that match the specified label selector.
3.To tail logs from pods in a specific namespace:

This command will stream and display logs from all the pods in the specified namespace.
4.To tail logs from multiple pods using wildcard expressions:

This command allows you to specify multiple pod names or use wildcard expressions to tail logs from multiple pods. For example:
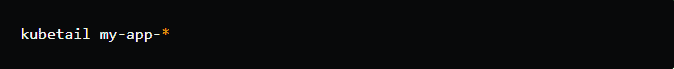
This will tail logs from all pods that start with “my-app-“.
5. To include timestamps in log output:
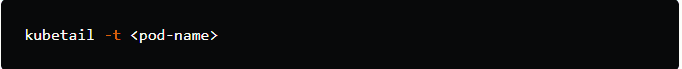
This command will display logs with timestamps, allowing you to see when log messages were generated.
6.To stop tailing logs from a specific pod:
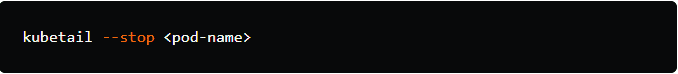
This command will stop streaming and displaying logs from the specified pod.
These are some of the common commands you can use with kubetail to efficiently tail logs from multiple pods in a Kubernetes cluster. Make sure to install and set up kubetail before using these commands. Refer to the kubetail documentation for installation instructions and additional features.
When using kubetail, you can also view the logs of Kubernetes control plane components by specifying their pod names. Here’s how you can view the logs of some commonly used control plane components:
1.To view the logs of the Kubernetes API server:
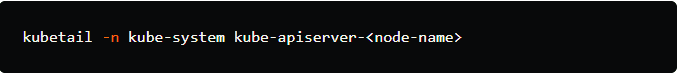
Replace <node-name> with the actual name of the node where the API server pod is running. This command will tail the logs of the API server.
2. To view the logs of the Kubernetes controller manager:
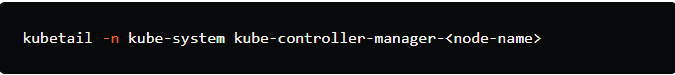
Replace <node-name> with the name of the node where the controller manager pod is running. This command will tail the logs of the controller manager.
3. To view the logs of the Kubernetes scheduler:
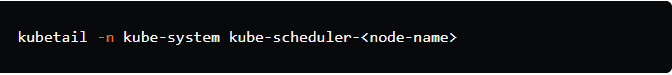
Replace <node-name> with the name of the node where the scheduler pod is running. This command will tail the logs of the scheduler.
4. To view the logs of the etcd cluster:
Replace <node-name> with the name of the node where the etcd pod is running. This command will tail the logs of the etcd cluster.
Remember to replace <node-name> with the actual node name where the respective control plane component pod is running. The -n kube-system flag is used to specify the namespace where the control plane components are typically deployed.
By tailing the logs of these control plane components, you can monitor their activity, detect any issues or errors, and gain insights into the behavior of your Kubernetes cluster.
Conclusion
Kubernetes logging is a critical aspect of running applications on Kubernetes. A centralized logging solution, log rotation, structured logging, avoiding sensitive information, and including contextual information are some best practices for logging in a Kubernetes environment. By following these best practices, you can ensure that your Kubernetes logs are stored securely, easy to search and analyze, and help you troubleshoot issues quickly.