


Guest post by Da Yin, infra engineer at Alibaba Cloud and KubeVela maintainer
Background
With the release of v1.8, KubeVela, the OAM-based application delivery project, has been continuously evolving for over 3 years. It is now being adopted in various organizations and deployed in production environments by multiple fields including banks, manufacturing, e-commerce, and gaming. It is not rare to see thousands of applications running on a single KubeVela control plane, no matter being used with customized definitions or managed upon multi-clusters.
One of the key questions that production users frequently ask is whether KubeVela is able to hold a certain amount of applications. To answer this question, KubeVela conducted load testing experiments, made performance tuning strategies and summarized this guide for those who care about stability and scalability of KubeVela.
TL’DR
For ones who seek for a benchmark, there is a brief table that could be referenced as below.
| #Apps | CPU/Memory |
| 3,000 | 0.5 core / 1 g |
| 6,000 | 1 core / 2 g |
| 12,000 | 2 core / 4 g |
| 400,000 | (8 core / 32 g) * 5 |
Although the above data could differ due to various factors such as the size of the application, the types of components, and the deployment of the cluster, this benchmark is suitable for most of the common scenarios.
If you are interested in how KubeVela achieves this, and how we tested it for large-scale application delivery and management, please continue reading.
History of KubeVela Benchmark
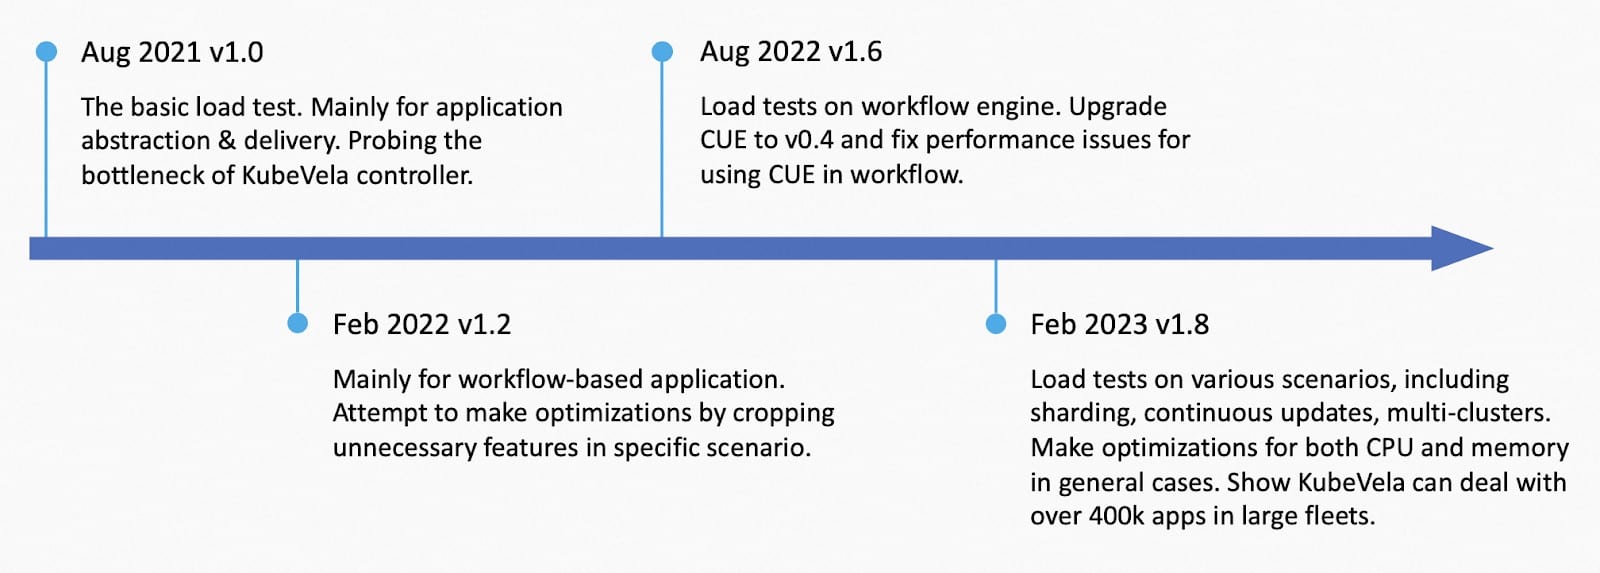
KubeVela has done multiple load tests along its history like the picture above:
- Load test on simple applications on Aug 2021 for v1.0. This load test verified the number of nodes does not affect the performance of KubeVela. It was tested on a single cluster with a thousand hollow nodes and 12k applications. It shows that the Kubernetes apiserver’s rate limitation is one of the bottlenecks for the KubeVela core controller. The load test data is treated as the standard benchmark till now. It didn’t include multi-cluster & workflow scenarios which were released in v1.1.
- Load test on workflow-based application on Feb 2022 for v1.2. This load test mainly focused on how to fine tune application controller’s performance in specific scenarios, like cases that ApplicationRevision is not needed. Several optional optimization flags were developed and it is demonstrated that cropping some features could boost the performance by over 250%.
- Load test on workflow engine on Aug 2022 for v1.6. This load test was done when KubeVela upgraded the cue engine from v0.2 to v0.4. It mainly found out that some unnecessary initialization for cue values would cause extra costs for CPU usage. Fixes were made with a reduction of 75% CPU usage.
- Load test on Feb 2023 for KubeVela v1.8 which will be introduced in detail below. This load test was conducted in various scenarios, including simple application, large application, multiple shards, multi-clusters, continuous updates, etc. Several optimization methods were applied to deal with general cases.
Preliminary Work
Basic Flow of KubeVela Application
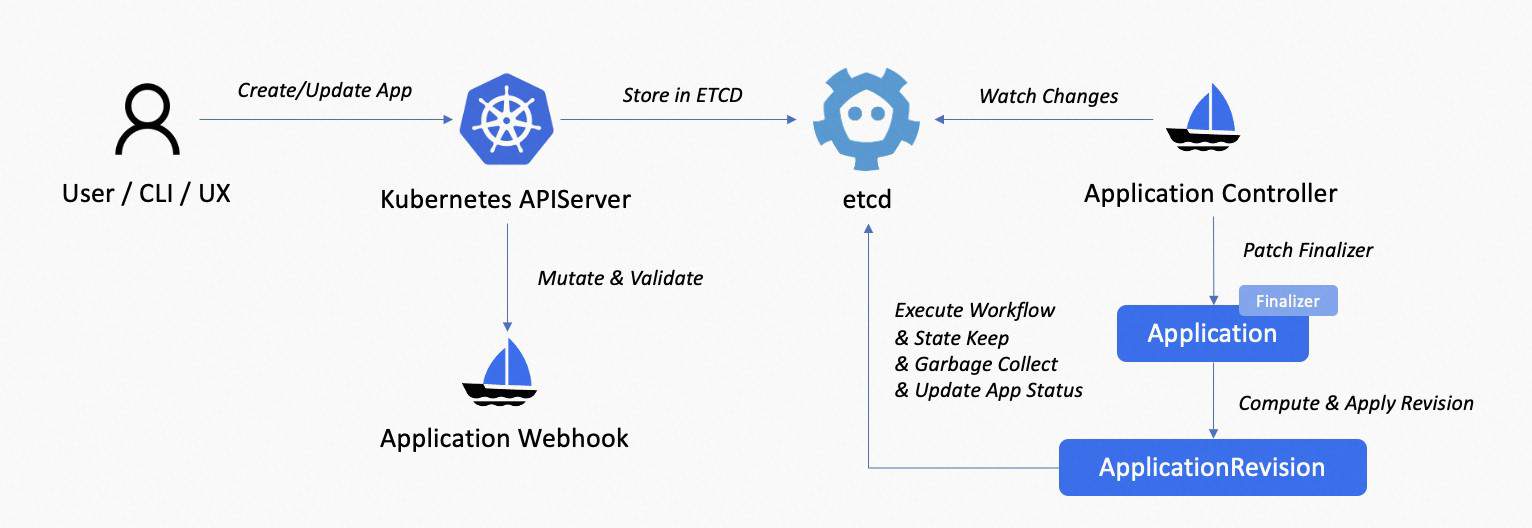
KubeVela application is usually the most frequently used object in the KubeVela ecosystem. It is handled by the application controller inside vela-core and will use cluster-gateway in terms of multi-cluster delivery.
The above picture shows the main procedure of KubeVela application, the normal processing is:
- User sends create/update/deletion application request to the Kubernetes apiserver on the control plane, via VelaCLI, kubectl, REST API, VelaUX, etc.
- Request sent to mutating webhook and validating webhook for verification and field autofill.
- Application object stored in etcd. vela-core‘s informer receives the create/update/delete events of the application, pushing it to the queue.
- vela-core‘s application controller observes the event and starts reconciliation.
- For a new application, the application controller patches finalizers to it.
- Controller computes the application’s current revision and creates/updates it in the cluster.
- Controller executes workflow, runs state-keep and garbage collection, conditioned on the workflow state. Finally, update the application status.
The main part of an application’s workflow execution is dispatching resources, usually. To analyze the performance bottleneck and find out how to respond to that, it is necessary to have an overview for the whole processing flow.
Setup High Performance and Robust KubeVela with Observability
Apart from installing KubeVela, there are some steps that are recommended for setting up high performance and robust KubeVela control plane. Notice that these steps are not mandatory for using KubeVela normally. They are mainly designed for large scale scenarios, like holding 2k+ applications.
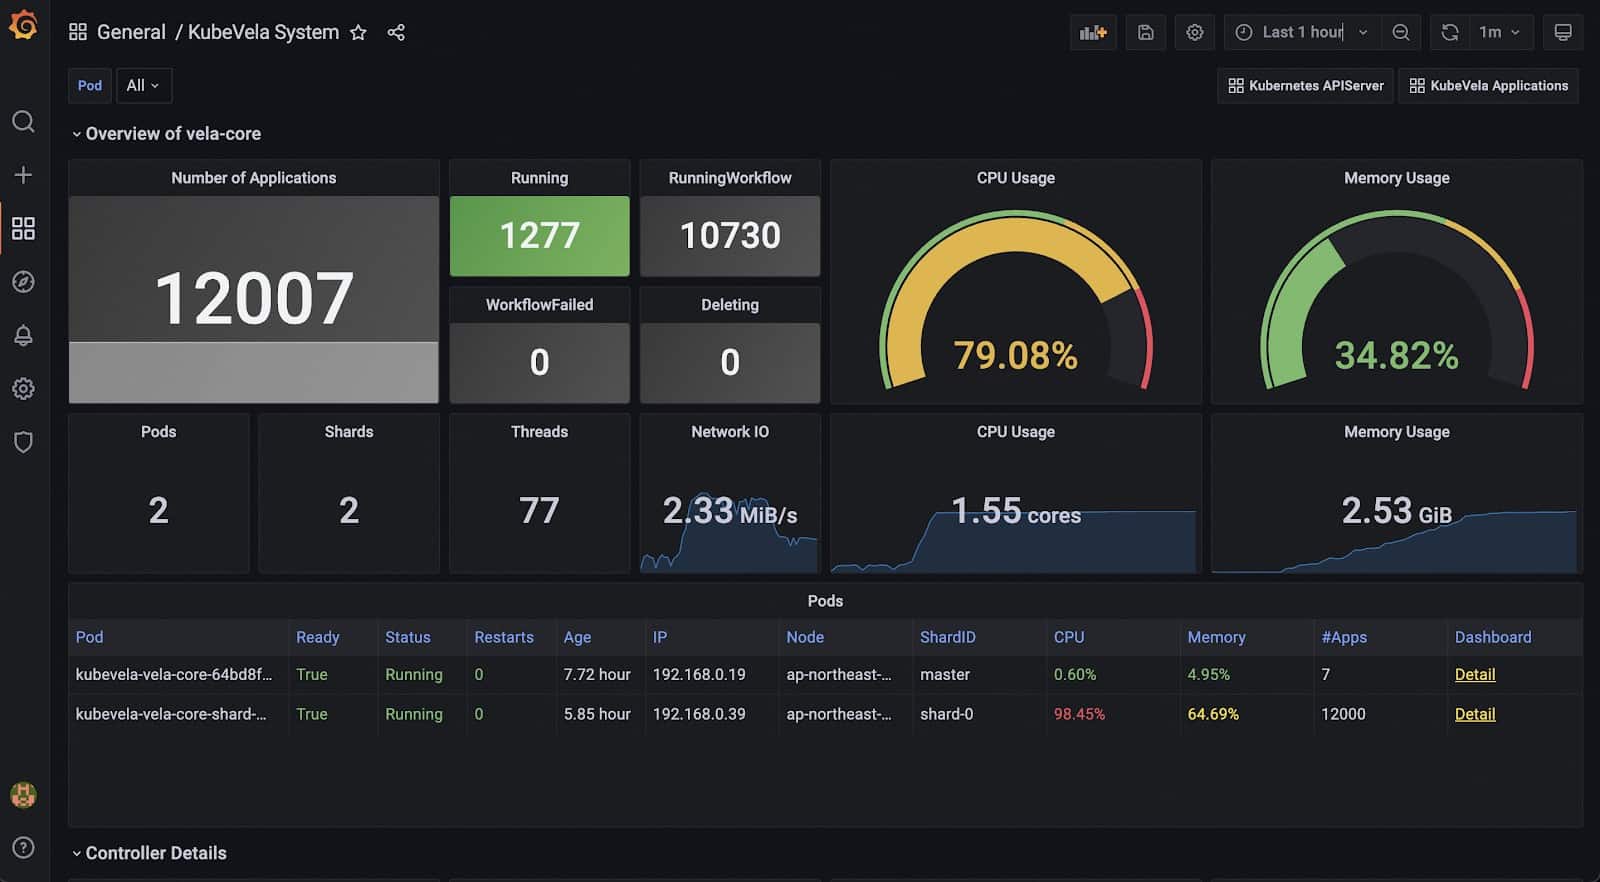
- Enable observability addons. To get a comprehensive overview for your KubeVela control plane, it is highly recommended to install observability addons, including kube-state-metrics, prometheus-server, and grafana.
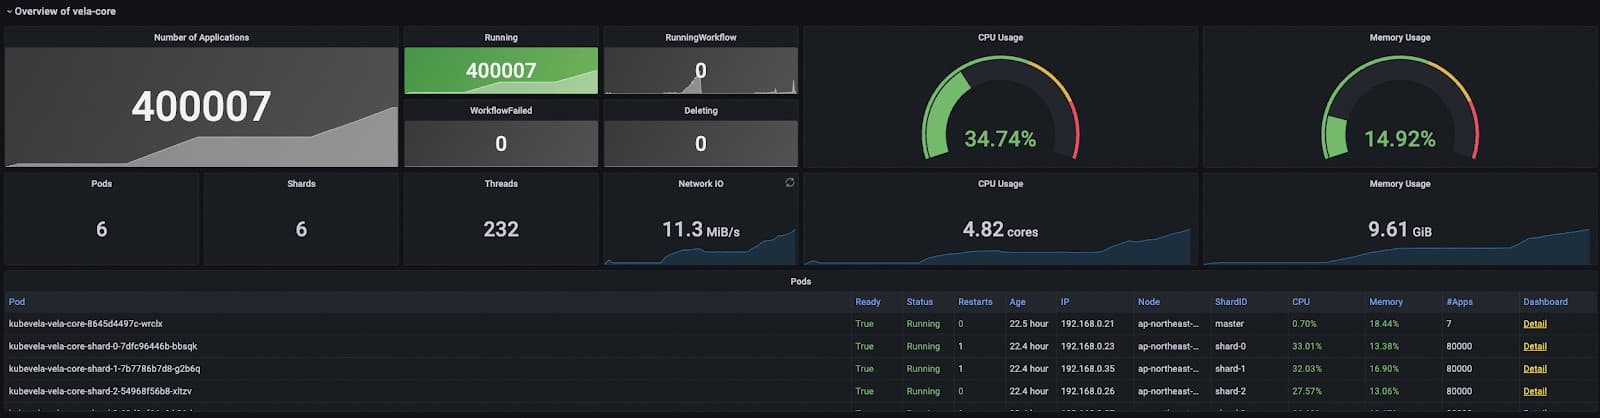
- If you already have these infrastructures, not built by KubeVela addons, you can install the Grafana Dashboard to your Grafana and get the KubeVela system dashboard like
- Enabling these addons requires some amount of extra computation resources, like CPU and memory.
- Remove the webhook. KubeVela’s webhook currently greatly adds latency to the application mutation requests. Run kubectl delete mutatingwebhookconfiguration kubevela-vela-core-admission and kubectl delete validatingwebhookconfiguration kubevela-vela-core-admission if you already installed KubeVela. Otherwise, add –set admissionWebhooks.enabled=false to the installation parameter of KubeVela. The side effect of this step includes:
- Invalid application will not be rejected during creation or update. Instead, it will report error in the application’s status.
- Automatic authentication will break. Alternative solution is to assign identity annotations on the application when you apply it.
- Automatic shard scheduling will break. Alternative solution is to assign a scheduled shard ID on the application when you apply it.
- [Optional] Enable multi-shards of KubeVela. Running multiple shards (established in v1.8.0) by installing with –set sharding.enabled=true and enable the vela-core-shard-manager addon. With sharding, you will be able to make horizontal scaling to your control plane, without affecting any existing application.
- If you have removed the webhook in step-2, you need to manually set the label controller.core.oam.dev/shard-id of the application to the shard id (by default you can set it to master or shard-0). If you did not remove the webhook, applications will be scheduled evenly.
- The vela-core-shard-manager will copy the configuration from the master shard, using the same image, args, etc. If you want to use different ones, you can change the args manually.
- If you do not have a huge number of applications (10k+), and if you do not need to make isolations to different applications (like grouping them by tenants), you do not necessarily need this step to achieve high performance.
- [Recommended] Use intranet connection between the control plane and managed clusters if possible. This tip is recommended but may not always be feasible. If your managed clusters live in a different network area (like different regions or different cloud providers) to your KubeVela control plane, you will not be able to do that. Intranet bandwidth is usually much higher than the internet bandwidth and the latency is much lower. So using intranet connection can help you to gain higher throughput and faster response for requests across clusters.
How to do a Load Test
After you have set up the KubeVela control plane on your Kubernetes cluster, you can try out the load test to see if your KubeVela control plane’s configuration can satisfy your business needs. You can start with the following steps, depending on your use scenario.
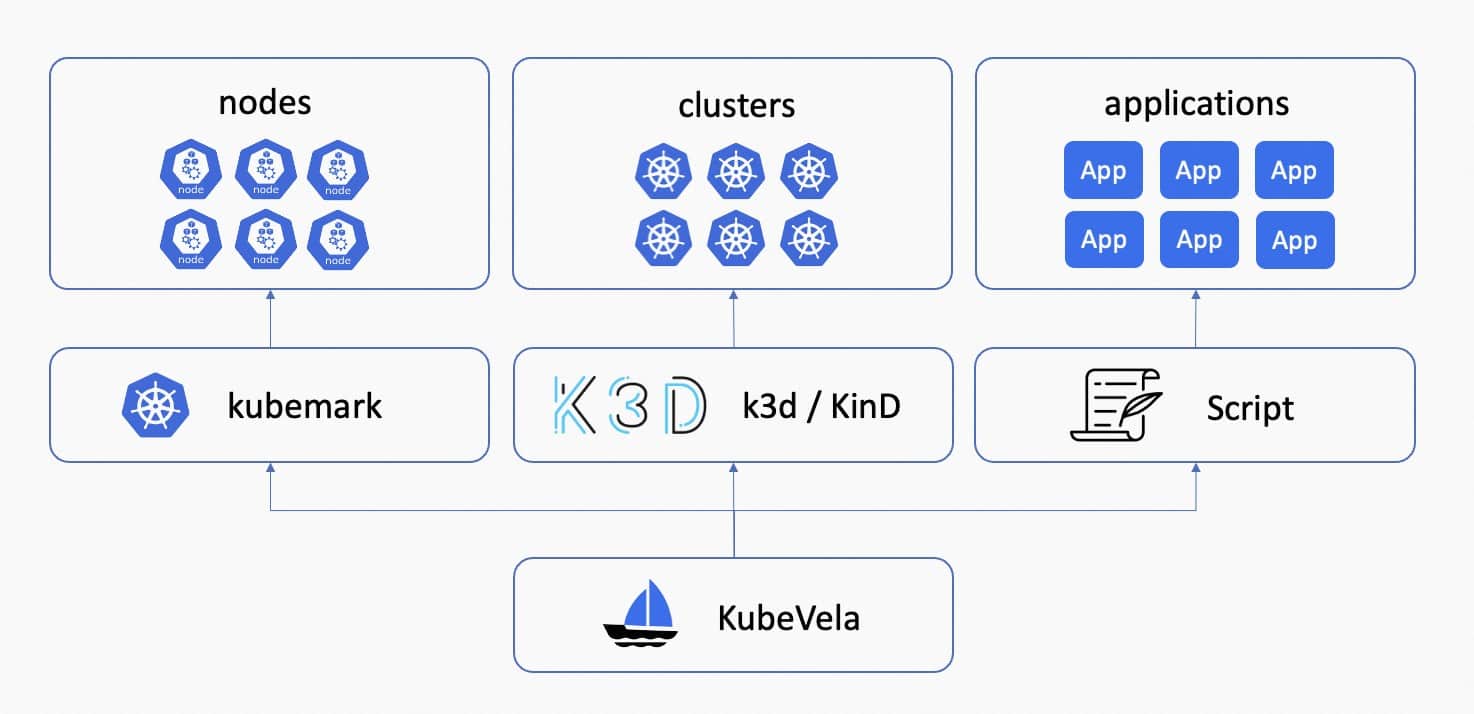
- [Optional] Setup kubemark to mock Kubernetes nodes. KubeVela is agnostic to the node number of the Kubernetes cluster but if you want to try out and verify this truth, you can use kubemark to mock Kubernetes nodes which allows you to hold a large number of Pods without actually running it. KubeVela has done load tests on clusters with 1k hollow-nodes within one cluster and verified that this number does not affect the running of KubeVela. See reports for more experiment details.
- [Optional] Setup k3d/KinD to mock managed clusters. KubeVela is also agnostic to the number of clusters that are joined to the control plane, unless you have over thousands of Kubernetes clusters to use. By setting up mocked managed clusters using k3d or KinD, and joining them to the KubeVela control plane, you can test cluster selection performance. However, network bandwidth and latency must be adequate to avoid rate limiting. KubeVela has conducted successful load tests on 200 clusters, divided into 40 regions, with proper configuration.
- Use scripts to deliver a large number of applications. There is a simple guide of using official scripts to deploy load-test applications. These scripts automatically deploy a number of applications in multiple parallel threads. It contains several environment variables to set, including the application template to read, the version of the application, the shard id and cluster id of the application, etc. You can create your own application templates for the load test, and use the script to conduct experiments. KubeVela uses the script to test various sample applications and gets the load test statistics.
Performance Optimization in v1.8
In KubeVela v1.8, we add several optimization methods to boost the performance of the application controller. These are done along with the assessment.
State Keep Parallelization
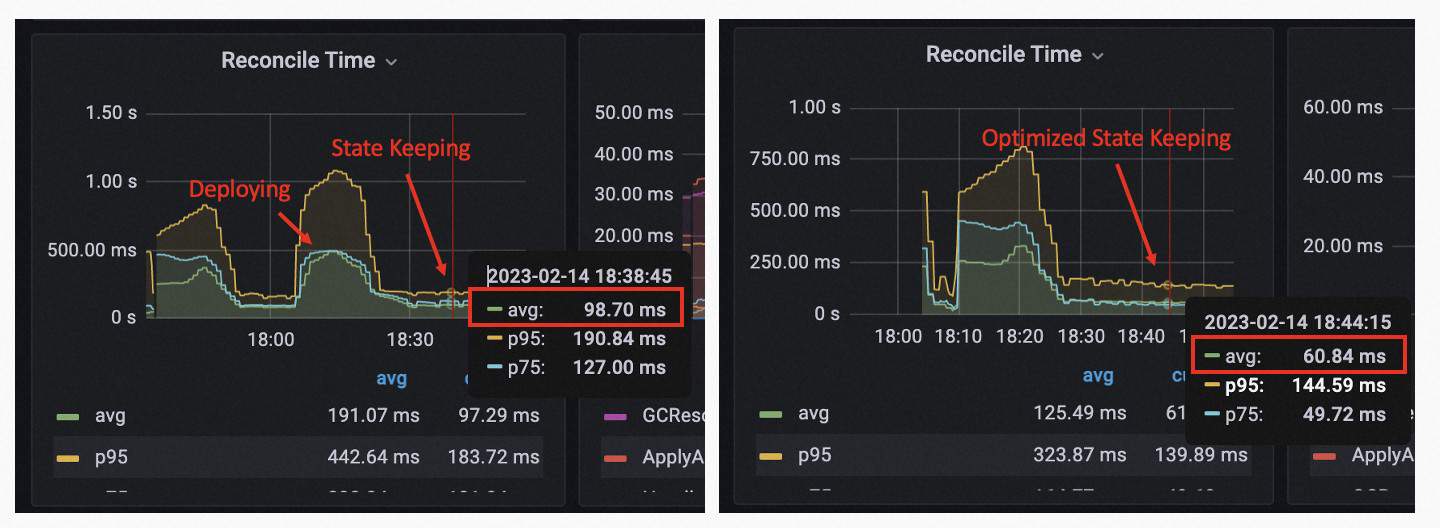
Before KubeVela v1.8, in the state-keep stage of the application reconciliation, resources behind the application were being state kept one by one. We add parallelization to this process with a maximum concurrency of 5. This boosts the performance of state-keep by about 30%+, depending on the number of resources that need to be kept for each application.
Reference: https://github.com/kubevela/kubevela/pull/5504
Index AppKey for List Operation
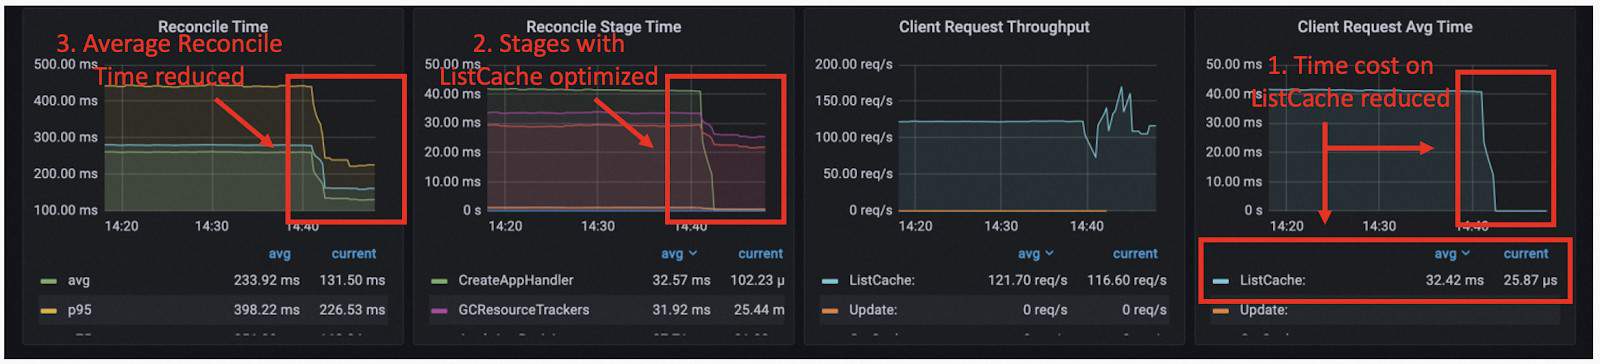
With the pprof monitoring for the application controller under 50k+ applications, we found that a large portion of CPU time is spent on listing ApplicationRevisions and ResourceTrackers.
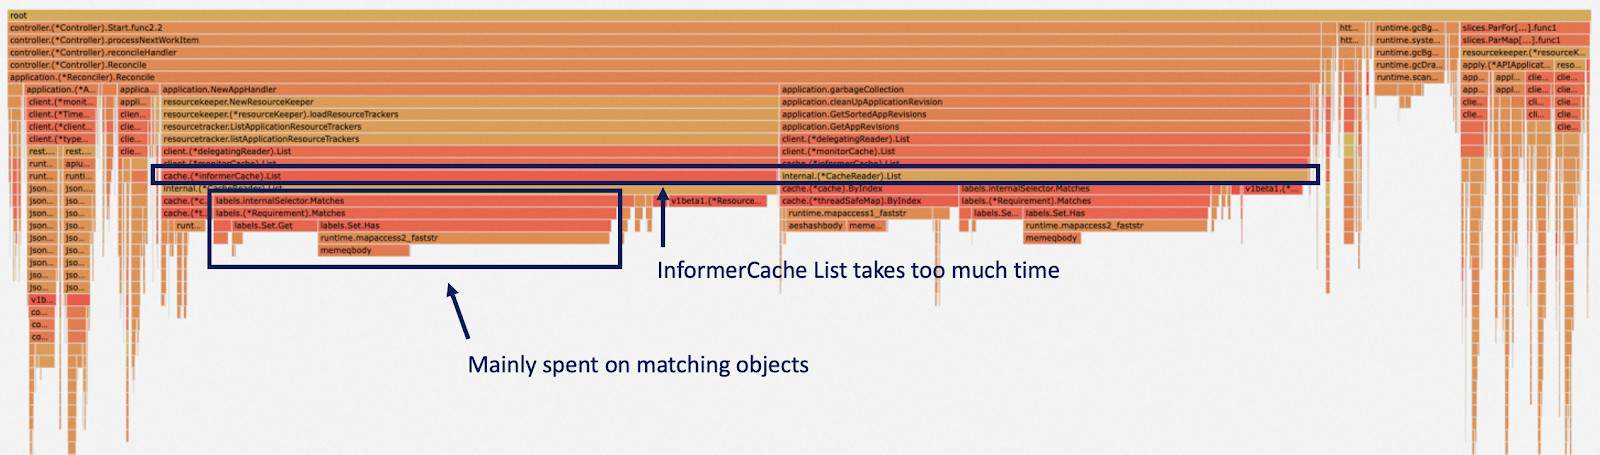
This is because when we need to find these resources for one application, we use a label selector to pick out the matching ones. But under the informer of the controller-runtime, this is done by matching labels of each object. We optimized it by adding an additional index for the cache and it greatly reduced the time cost of listing ApplicationRevisions and ResourceTrackers. For a single list operation, the time cost is reduced from 40 ms to 25 us, and it is one of the bottlenecks for the state-keep before optimization.
Reference: https://github.com/kubevela/kubevela/pull/5572
Filter unnecessary updates
When one application reaches a stable state (publish finished with no ongoing updates or deletion), the main job each reconciliation does is to probe underlying resources and detect unintended drifts. Usually, the configuration drift will not always take place, so we do not need to make empty patch requests to the underlying resources. We observe that this could reduce the reconciliation time by 20%.
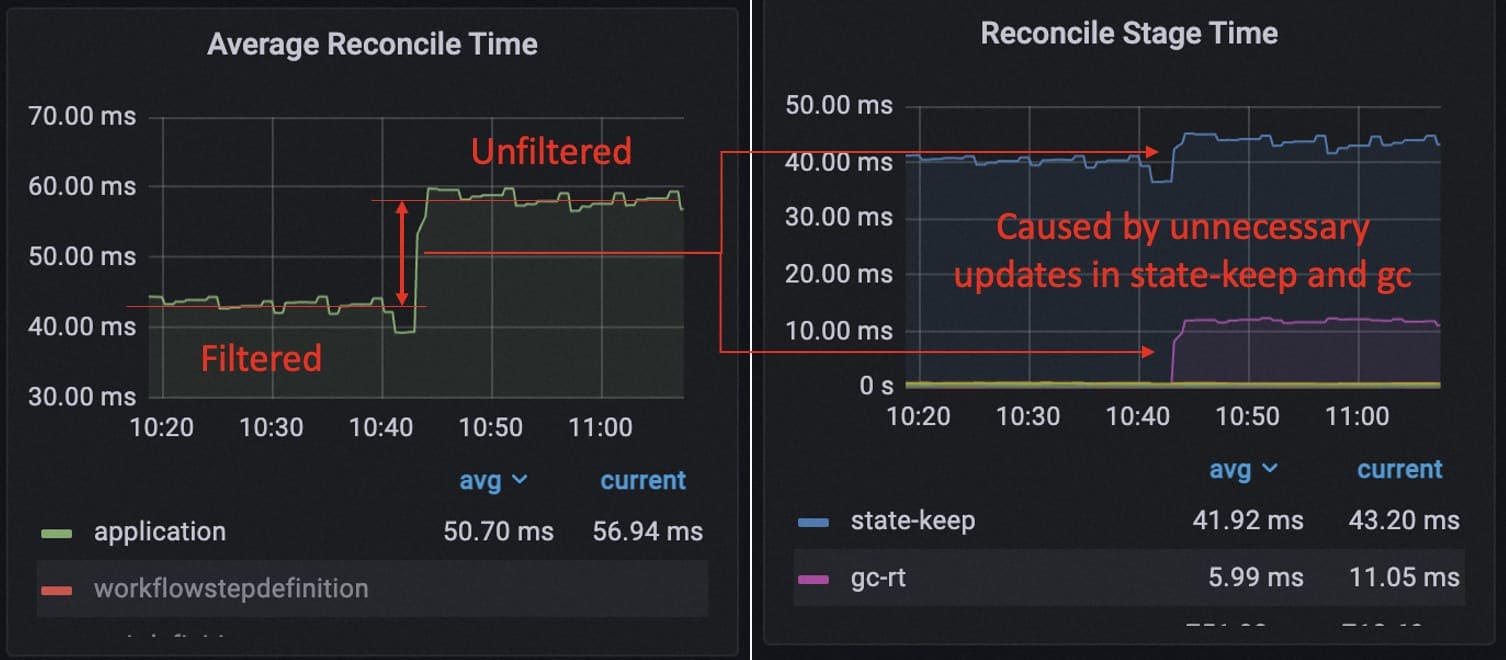
In addition to that, we found that every reconciliation the application controller is always making ApplicationRevision update requests. However, the ApplicationRevision does not update once the workflow has been successfully executed. So these update requests are unnecessary and the removal of it yields a 27% performance boost during the load test.
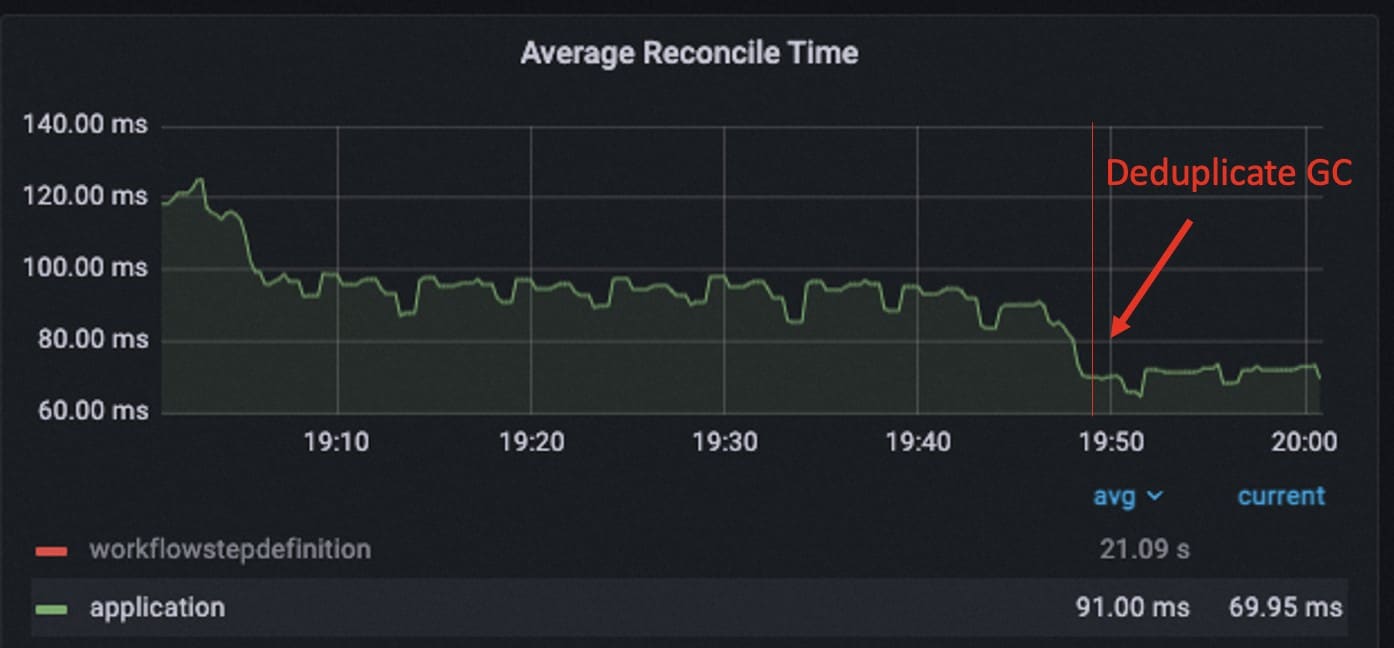
A similar problem is after workflow is upgraded since v1.6, the state is compressed but the execution of garbage collection is not deduplicated. So by removing the duplicated gc process, we further made 23% performance optimization for the running of the application controller when the application enters the stable state.
Reference:
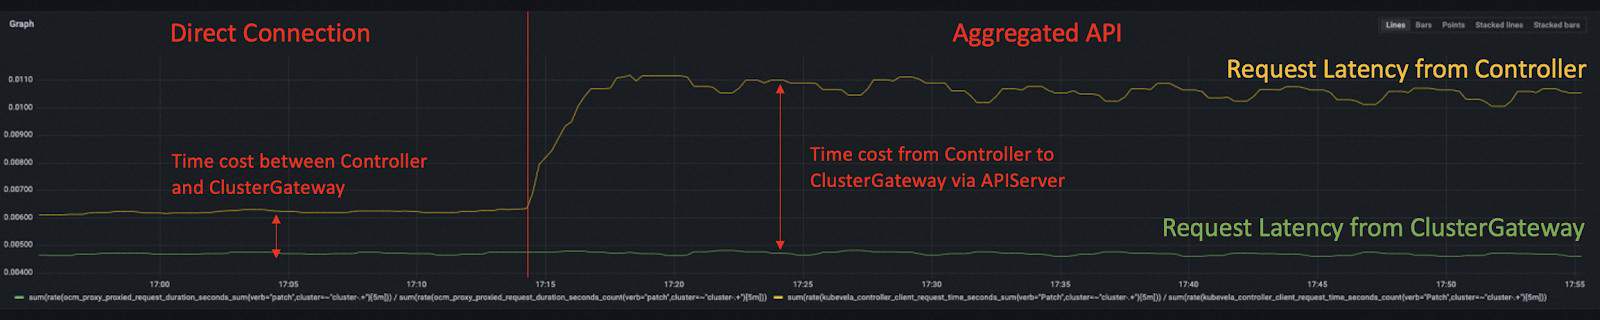
Direct Connection to Cluster Gateway
When looking into applications that deliver resources into managed clusters, we will find that the cluster gateway becomes another potential bottleneck.
By default, the multi-cluster requests are made along the flow of vela-core -> kubernetes apiserver (hub) -> cluster-gateway -> kubernetes apiserver (managed). This is done by leveraging the aggregated API mechanism of Kubernetes and we can make optimizations by allowing the application controller to communicate with cluster-gateway directly.
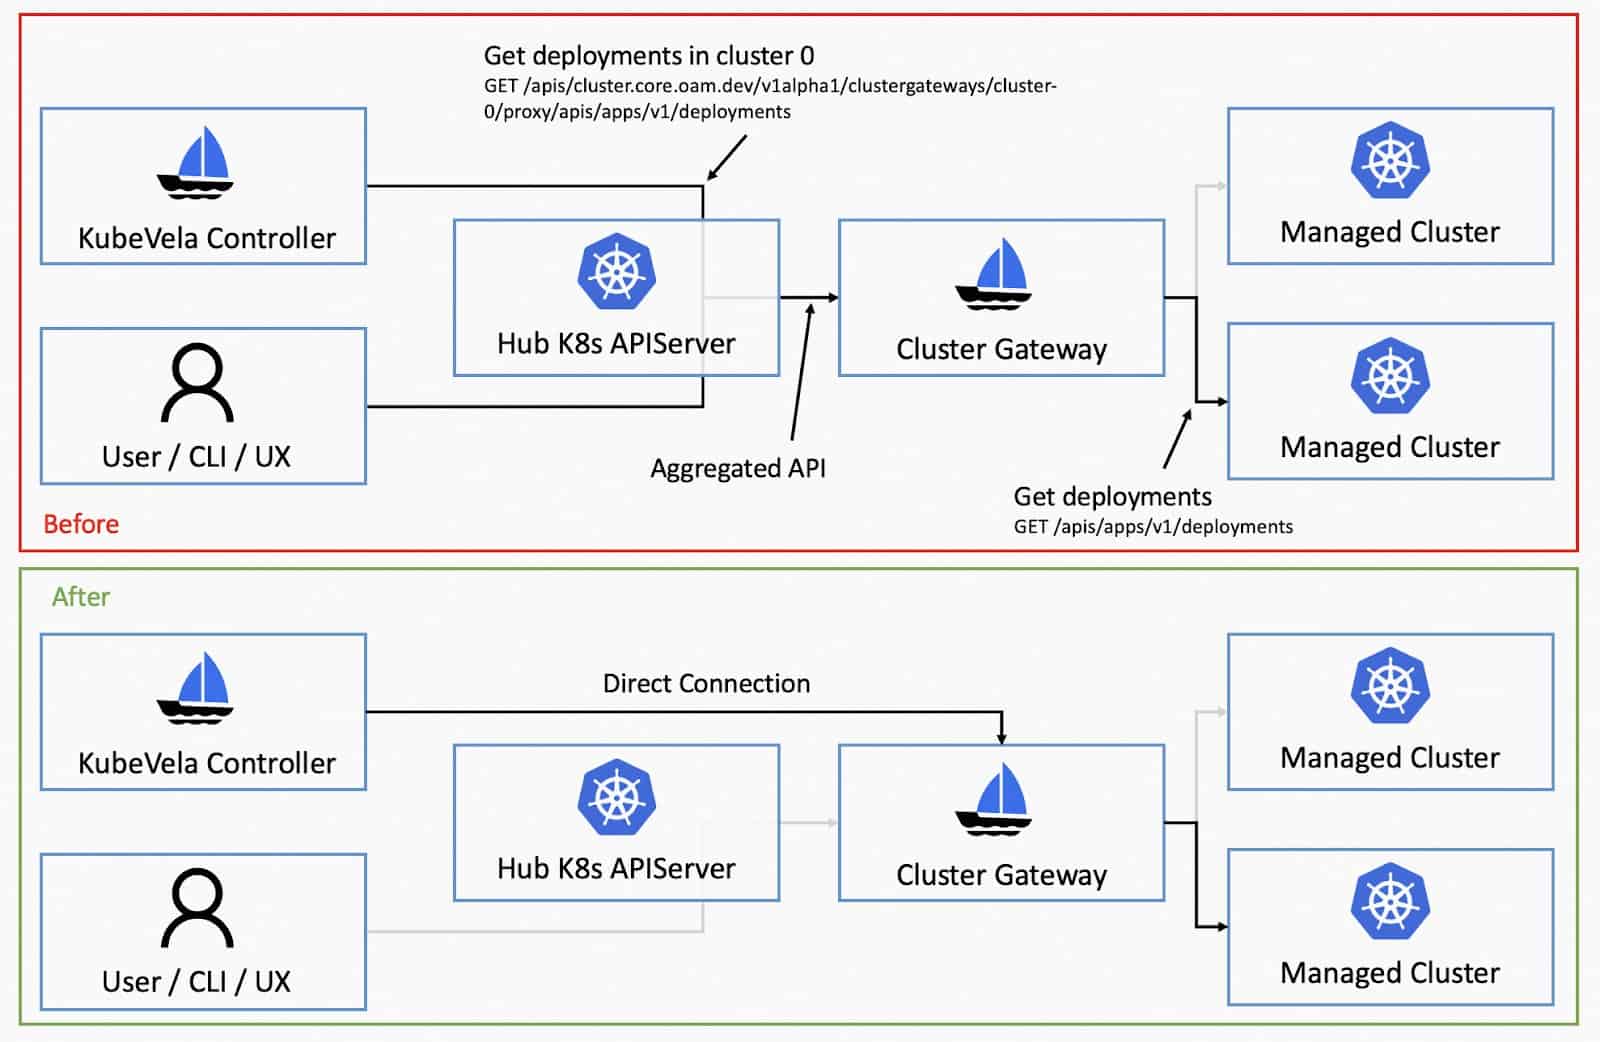
This will not only reduce the burden of Kubernetes apiserver but also decrease the number of network hops for multi-cluster requests. We received 40% latency reduction with this method.
Reference: https://github.com/kubevela/kubevela/pull/5595
Informer Cache Reduction
The default controller-runtime informer will cache all the structured objects we use in the controller. For KubeVela, these will be Application, ApplicationRevision, ResourceTracker and ConfigMap.
With controller sharding, KubeVela is able to divide the cache of Application, ApplicationRevision and ResourceTracker into different shards. But still, as the application continuously updates, the accumulated ApplicationRevision will eat up lots of memory by informer cache, despite that they are not used frequently and have lots of duplicated data inside.
Therefore, to optimize the size of informer cache, we take several approaches.
- Drop managedFields and kubectl.kubernetes.io/last-applied-configuration when storing Application, ApplicationRevision, ResourceTracker in informer. These can be potentially large especially for complex applications. They are useful for Kubernetes apiserver and CLI tools but are not in the controller. So in the controller, we drop them before storing in cache.
- Reduce the memory usage of ApplicationRevision by sharing the storage of ComponentDefinition, TraitDefinition, WorkflowStepDefinition. Most of the applications use only several common definitions in the system, like webservice or scaler. These definitions are stored in lots of ApplicationRevisions separately and take up lots of space. So in the application controller, we set up a sideway common cache and let these ApplicationRevisions point to the definitions stored in the common cache and therefore reduce the memory use.
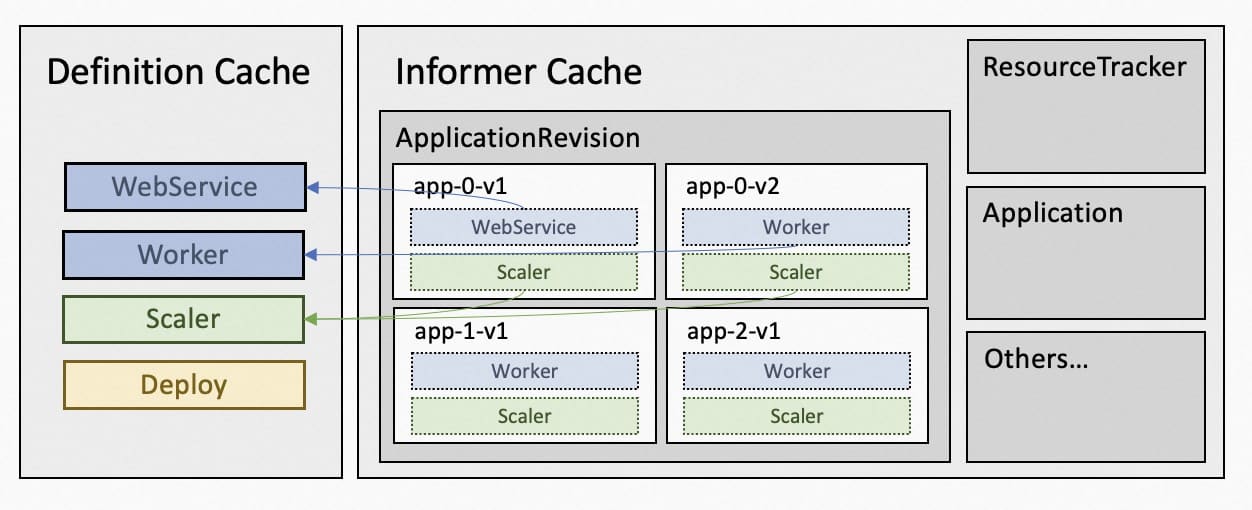
- Disable the informer cache for ConfigMap. The cache of ConfigMap is caused by Workflow Context. Application workflow stores the running context in the ConfigMap but the cache of ConfigMap not only contains the ConfigMap used by workflow but also takes other unused ConfigMap, which could potentially take large spaces.
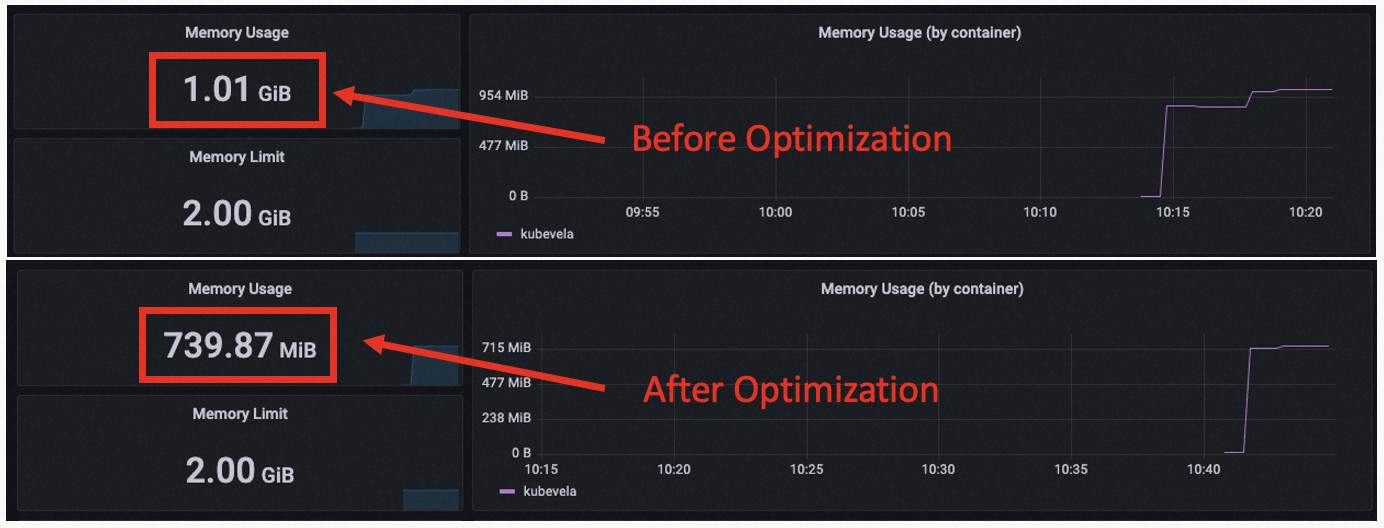
In our load test, we found that these methods together gave critical improvements to the memory usage, especially for continuous updates. Previous load tests did not focus on the continuous updates but that would neglect the increasing of cache memory in the application controller for real use.
The memory usage of the Go program is not simple. The above memory stats are the RSS size reported by the OS. The real memory usage of the Go program is smaller than that. The unused memory by Go is not always returned to the OS instantly and there is memory fragmentation that will prevent it from returning all the unused memory. So here we also compare the ALLOC memory and SYS memory reported by Go. The ALLOC memory could be treated as the size of memory that is in real use. The SYS memory represents how much memory Go has gained from the OS.
With 3k apps, 9k ApplicationRevisions, we got 1.02G RSS, 897M SYS and 401M ALLOC before optimization. After optimization, we got 739M RSS, 707M SYS and 203M ALLOC. We can see that the in use memory is greatly reduced by about 50%. The total memory use also has been reduced by about 25%.
Reference: https://github.com/kubevela/kubevela/pull/5683
Performance Results in Different Scenarios
Multiple Shards
Setup
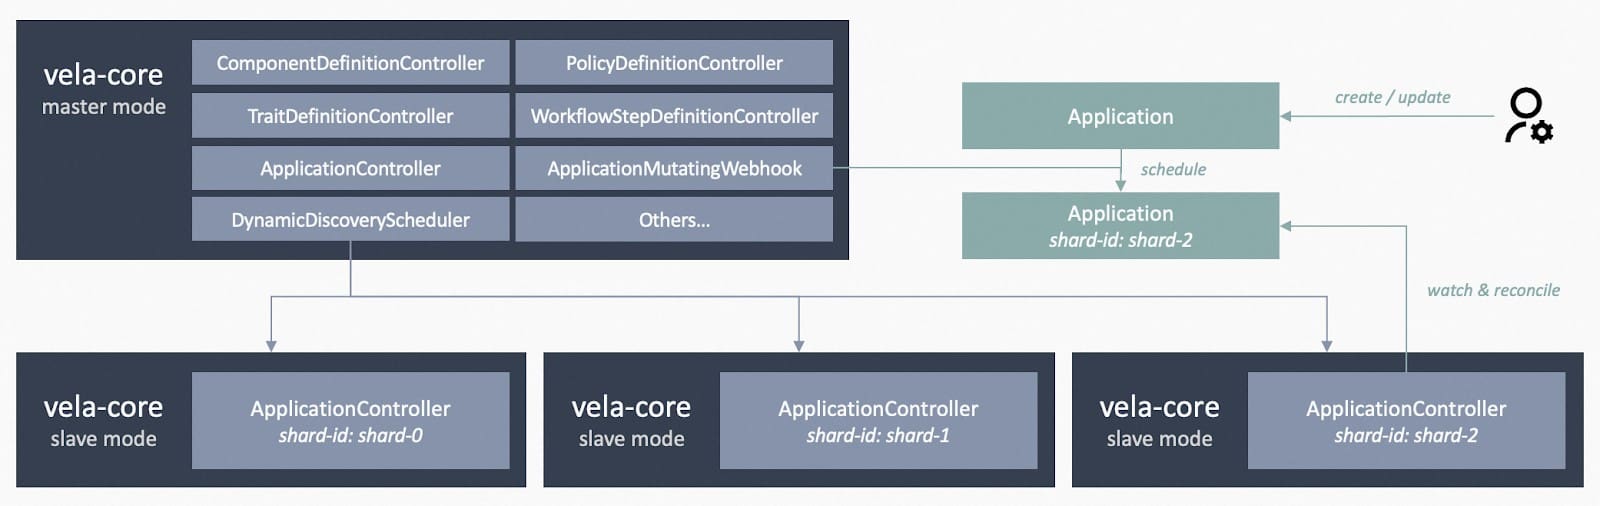
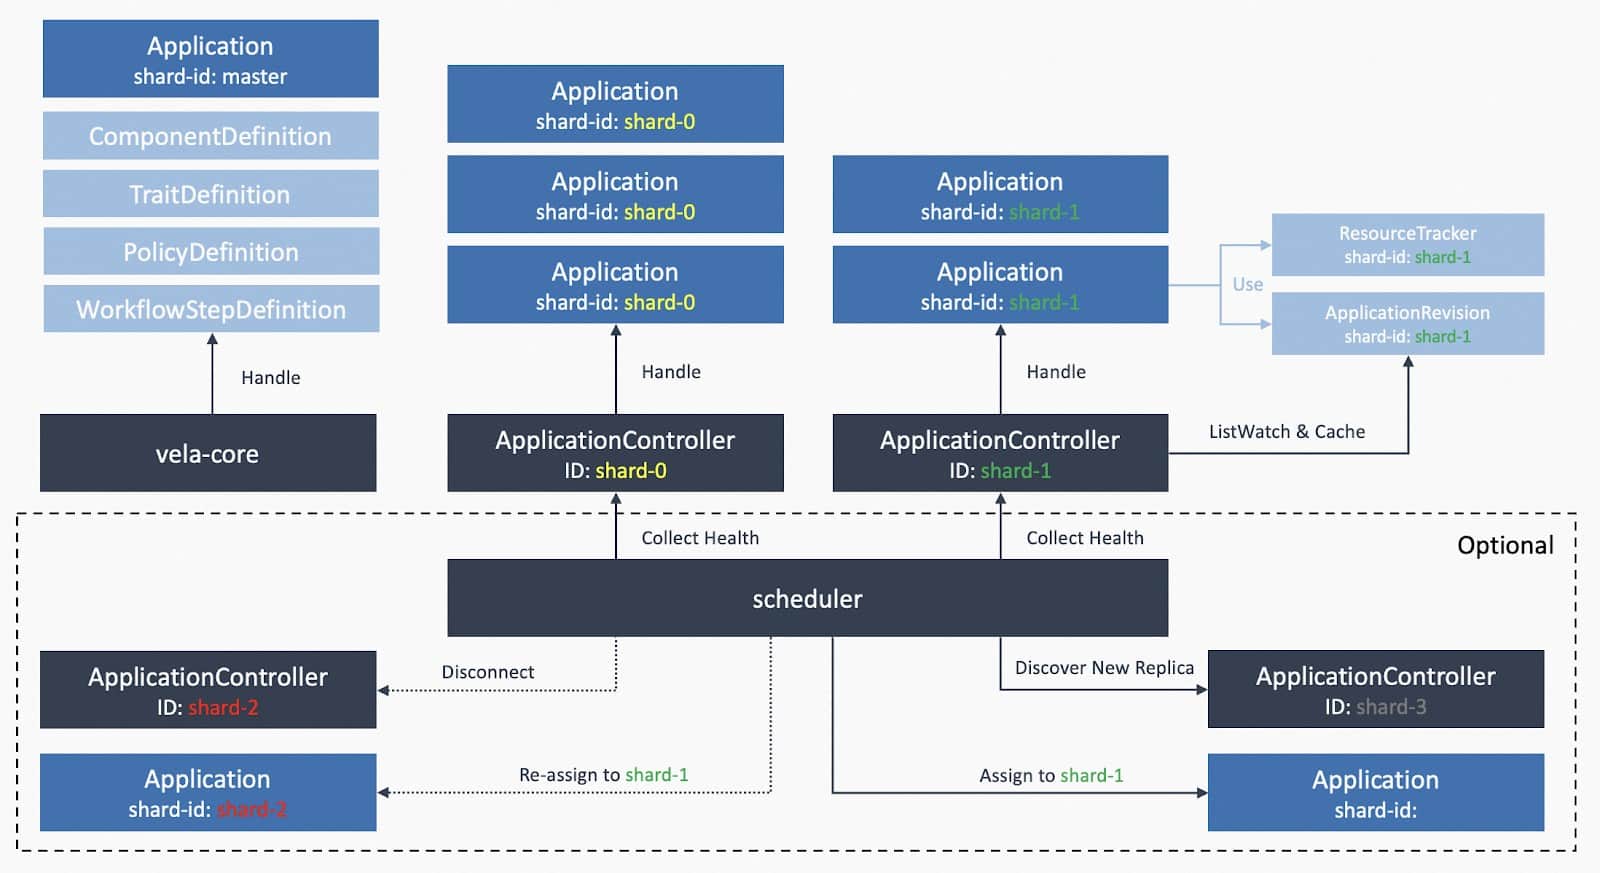
KubeVela v1.8.0 supports controller sharding which allows horizontal scaling for the KubeVela control plane. It is achieved by leveraging the label selector on ListWatch requests, which is used by controller-runtime as the backend of the KubeVela application controller. It not only limits the number of applications to be processed by each shard, but also reduces the size of memory cache through the division.
To verify that multiple shards of KubeVela controller can work as expected, we compared performance under three cases:
- Single shard with 0.5 core 1 Gi memory.
- Three shards, each with 0.5 core 1 Gi memory.
- Single shard with 0.5 core 1 Gi memory using KubeVela v1.7.5.
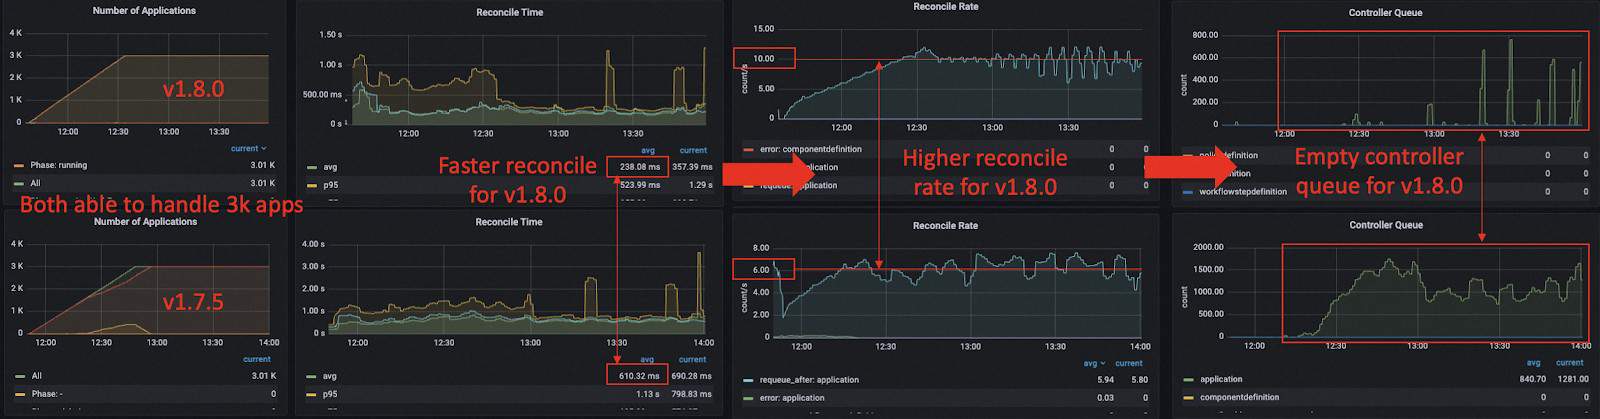
We tested 3,000 small applications for the single shard case (the default configuration for the KubeVela core controller) and 9,000 small applications for the three shards case (each holds 3,000 as same as the single shard case).
Analysis
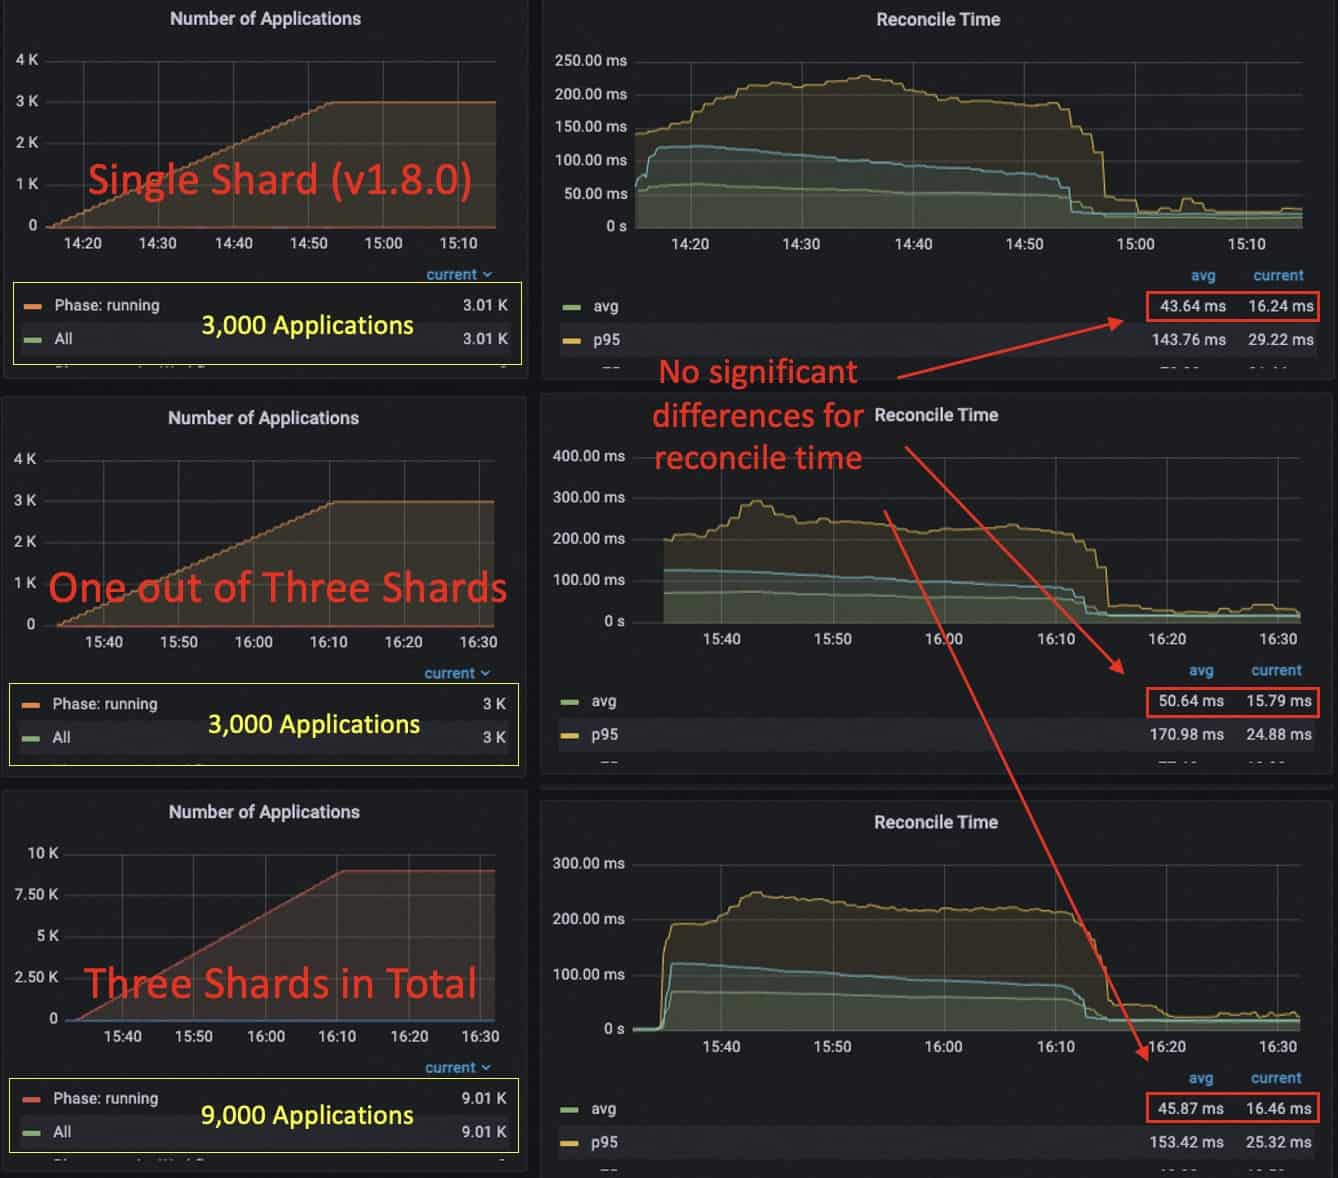
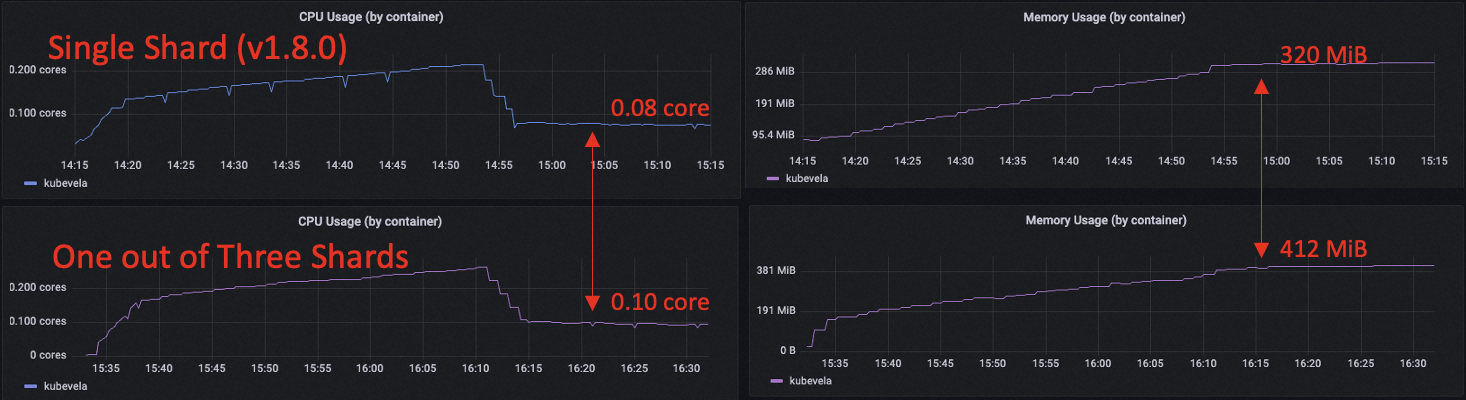
We can see that when using three shards, each shard is able to handle 3k applications without interfering with each other. The RSS memory usage for each shard increases to 412 MiB and the CPU usage is 0.1 core after all applications are published (average reconciliation latency at 15ms). Currently, the system contains 9k applications in total.
Compared to single shard, the memory usage and CPU usage in sharding mode is comparatively at the same level. The single shard running 3k apps uses about 0.08 core after all published and uses a memory of 320 MiB. There is also no obvious reconciliation time difference between sharding and without sharding (about 40~50 ms during publishing and 10~15 ms after publishing).
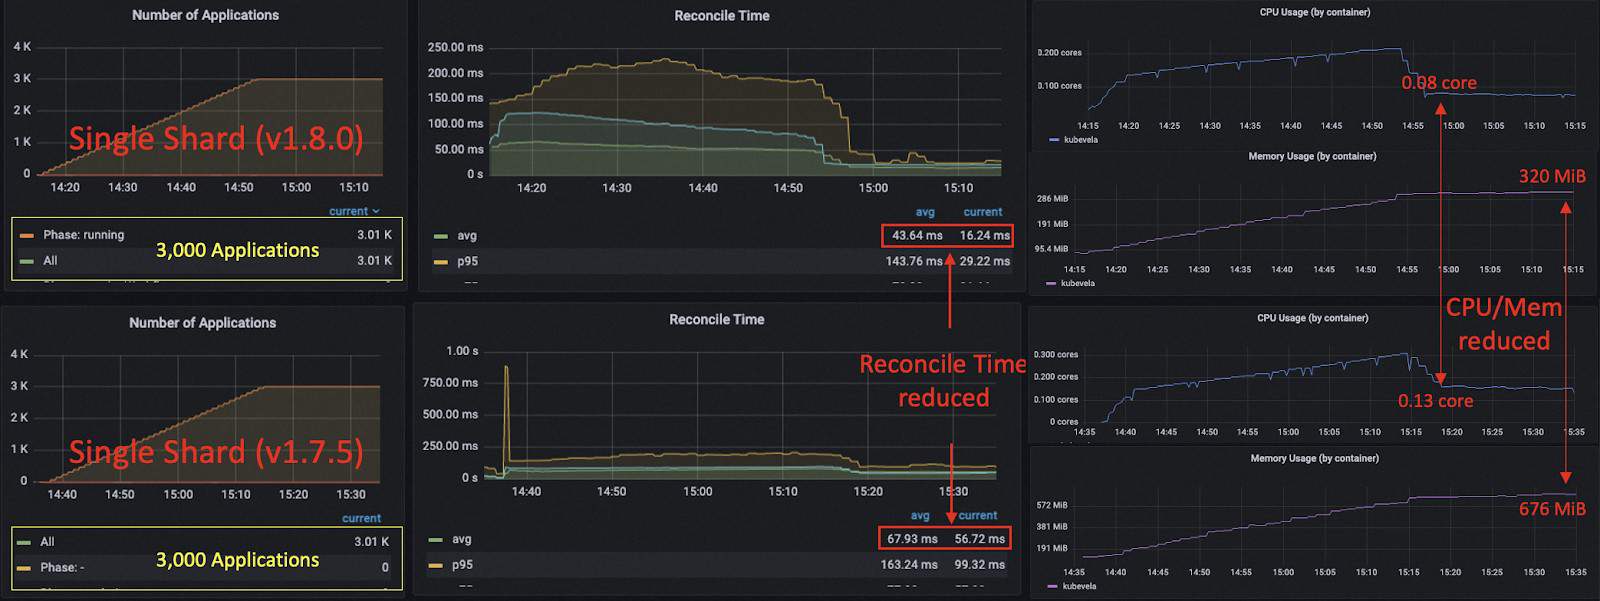
Comparing the optimized single shard case with the unoptimized one (v1.7.5), we can see that there is an obvious drop for average reconciliation time, especially the time cost after publishing (from 55 ms to 16 ms). The CPU usage after publishing is decreased from 0.13 to 0.08 core. The memory usage is reduced from 676 MiB to 320 MiB.
Conclusion
In summary, we got the following conclusions through this experiment:
- The performance of v1.8.0 is optimized a lot compared to v1.7.5.
- Deploying multiple shards increases the application capacity of the system horizontally and does not introduce too much overhead.
Large App with Continuous Updates
Setup
While previous load testing mainly focused on the delivery of applications, in production cases, we have seen users continuously upgrade applications with tens of revisions. It is doubtful that the continuous updates of applications would affect the stability of the control plane. So we conducted this experiment where we deployed applications and made several updates afterwards.
We found that for v1.7.5, before optimization, the continuous updates to applications will cause the increase of memory of the KubeVela controller. This would make the controller reach the maximum memory usage faster. For example, deploying 3k applications only uses about 700 MiB but one update to all applications will make it rise to 900 MiB. The second update to all applications will cause the controller to be out of memory and crash. This is even worse for versions before v1.6, where the default application revision limits were high and a large number of revisions were kept in the system by default.
There are multiple ways to solve that. One way is to set the revision limit to a lower number. Since v1.7.0, this number is set to 2 which means each application can hold at most 2 history revisions. Another way KubeVela has achieved in v1.8.0 is to reduce the memory consumption, especially the increased use of memory during continuous updates. As shown in the above chapters, we can notice that the memory usage for deploying 3k light applications has been greatly reduced.
We tested the performance of the controller after optimization to prove that 0.5 core 1 Gi KubeVela controller could handle 3k large applications (each carries 3 deployments, 3 secrets and 4 configmaps) with continuous updates.
In this experiment, we deployed 3k applications at 17:11 and finished publishing all about one hour later. (It could be faster if we increase the deploy rate of the load testing client.) Then we made updates to all applications at 19:05, 20:05, 20:55, 22:00, 23:27. Notice that the default settings for the number of history revisions for each application is 2. So for the first two updates, new application revisions are generated while for the following three updates, new revisions are created and outdated revisions are recycled.
Analysis
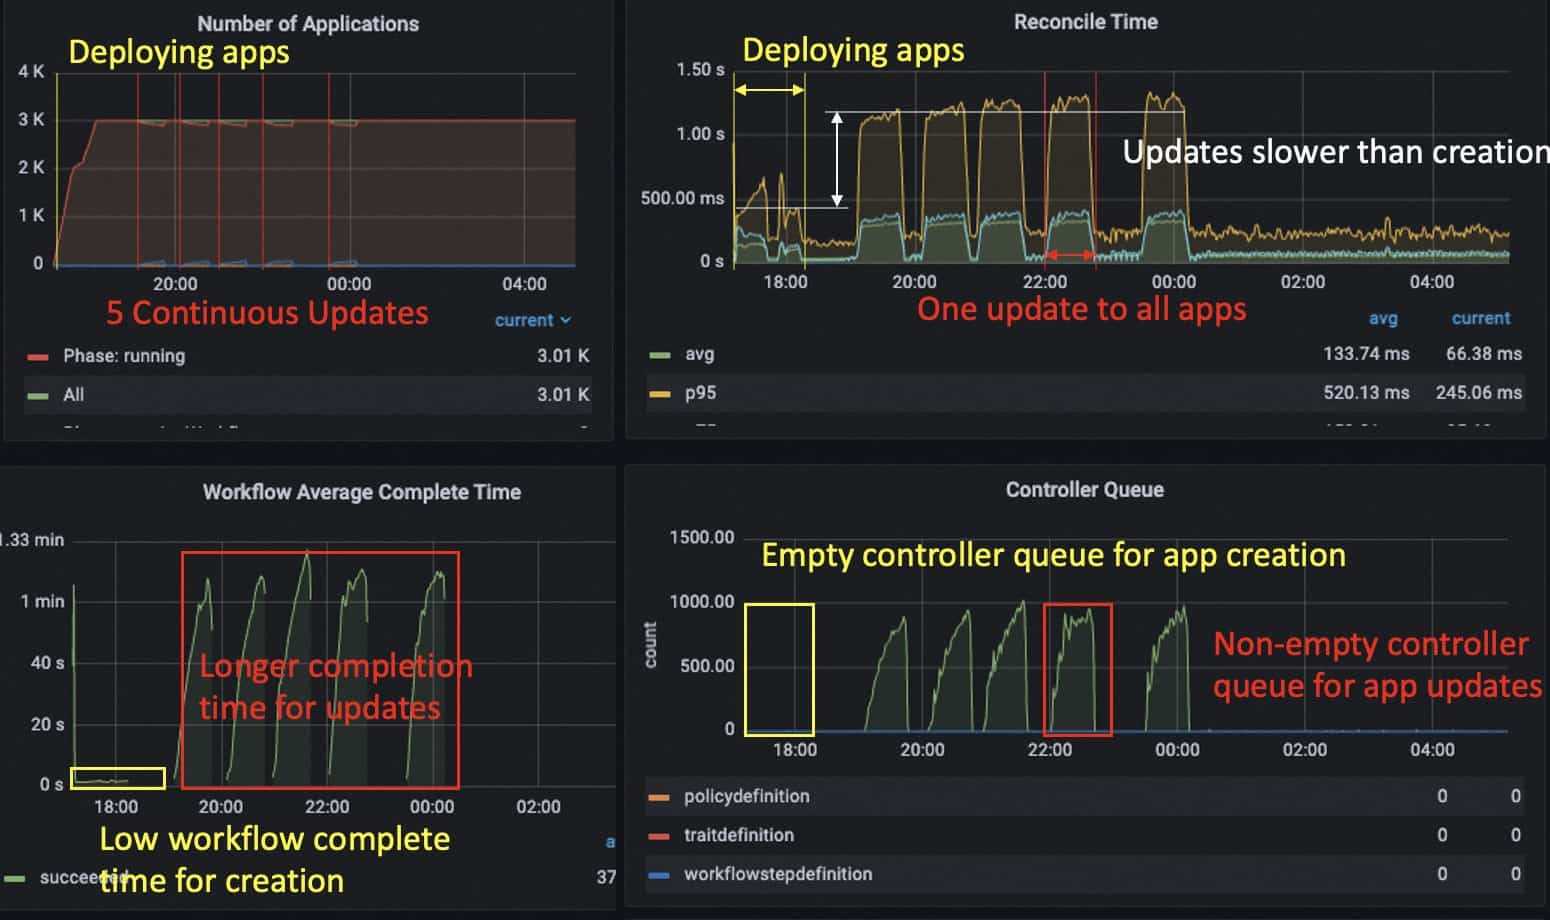
The updates of applications took more time than deploying, since the applications also needed to care for the garbage collection of outdated resources. And therefore we observed increases in the controller queue but that does not last for a long time. The average workflow finish time for applications was still kept under 1 min.
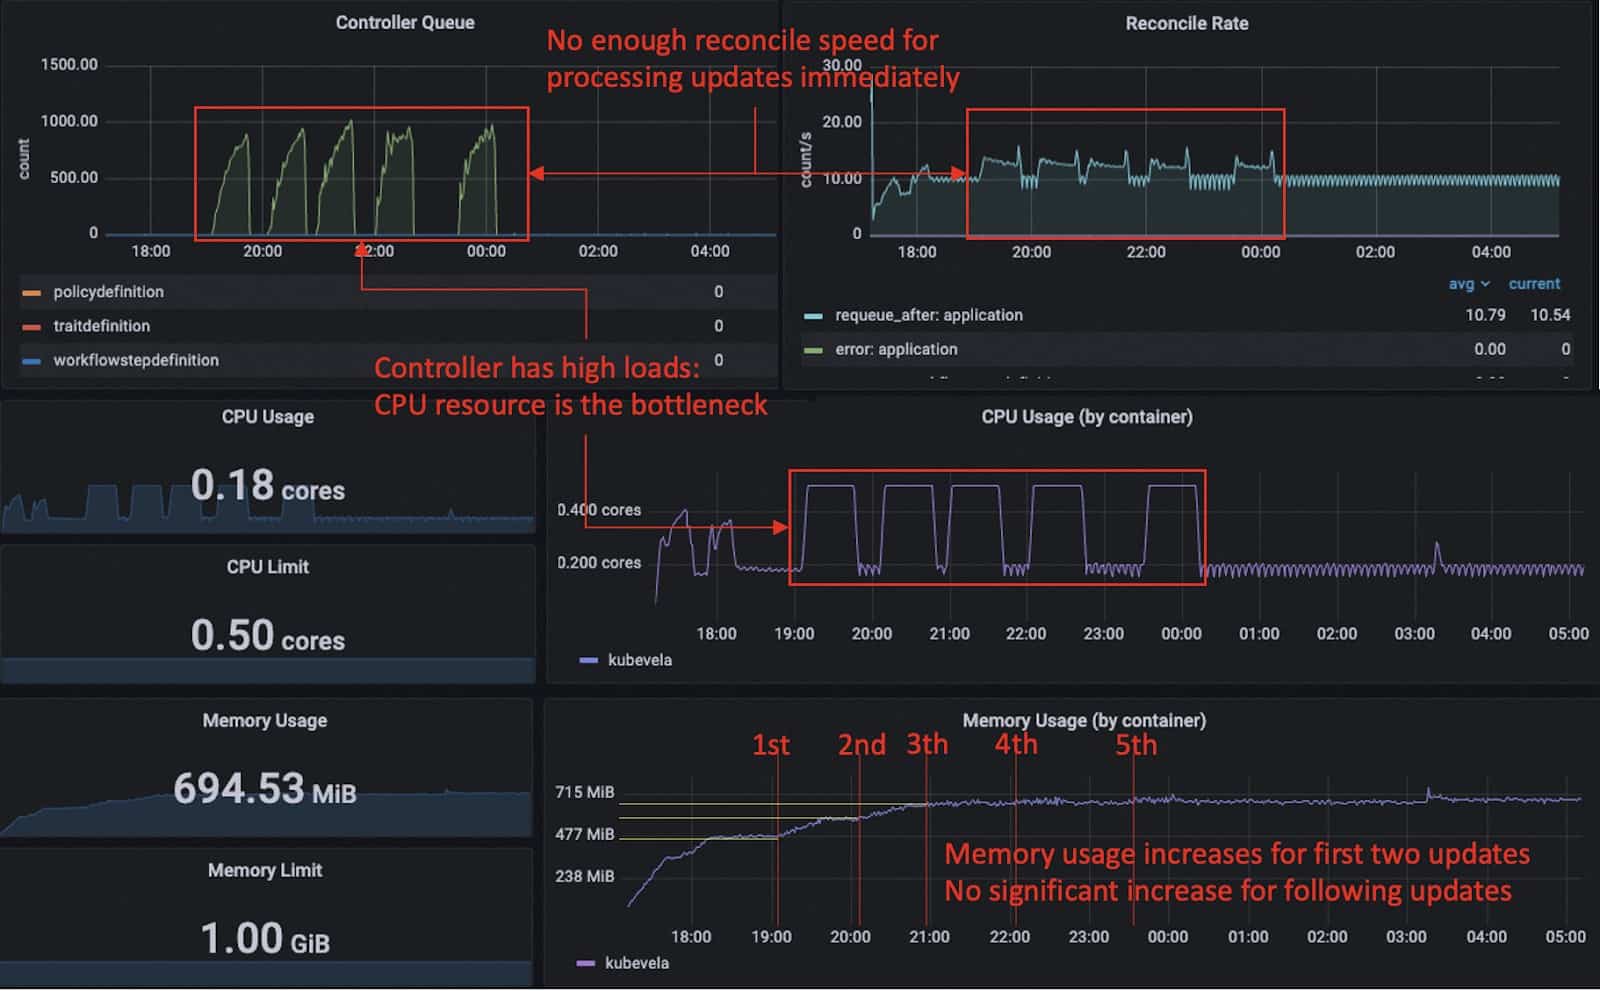
When we looked at the resource usage of the KubeVela controller, we noticed that during the updates, the CPU usage had reached 0.5 core and this became one of the main reasons that made the controller work slower. Remember that we only have parallel execution for deploying and state-keeping resources but do not support parallel garbage collection for now (which we would like to add in the future). The memory usage of the controller goes to 470 MiB after first publishing. It rises to 580 MiB and 654 MiB after the first two updates. Then for the following updates it keeps around 690 MiB (which is under 70% of the memory limit) and does not have further continuous increase.
Go’s memory allocation mechanism does not return unused memory to the OS instantly and also not all unused memory can be always returned. So the real use of memory (allocated memory) is often far below the resident set size. When KubeVela controller has high workload and accumulation in its queue, the memory usage could once go high but would not last persistently.
Some may ask if the template of such an application is really large enough. It is true we have seen users dispatching like 50+ Kubernetes resources in one application and that is at least 5 times larger than the application we tested here. But averagely, giant applications contribute to a small portion of the overall system and the tests here set all applications to the same size. In addition, if we compare this experiment with the test in the above section (the single shard case in multiple shards section), where we used the same controller configuration for 3k small applications (3 resources), we can find that applications used in this experiment are over 3 times larger but the performance of controller is only a bit slower.
Conclusion
In conclusion, we know the following things from the experiment:
- With the standard controller settings, the KubeVela controller is able to hold 3k large applications and make continuous updates to them.
- The update of applications is slower than the creation. It consumes more computation resources.
- Compared to small applications, large applications do not greatly affect the performance of the KubeVela controller.
Multi-cluster
Setup
The above load tests and those KubeVela had done in the history all used single cluster architecture to deploy and manage applications. With more and more users starting managing applications across clusters, we want to know how KubeVela performs under multi-cluster scenarios. So we designed this experiment.
In this experiment, we also used the default configuration of KubeVela controller, 0.5 core 1 Gi and used the default configuration for cluster-gateway in v1.8.0 (0.5 core 200 MiB). We also used the small application template (1 deployment, 1 configmap and 1 secret) except that these resources were deployed to a remote cluster. We made this experiment to test the performance across regions. The control plane of KubeVela was deployed at Tokyo, Japan while the managed cluster was deployed at Hangzhou, China.
We also compared the performance of v1.8.0 to v1.7.5. The default configuration for cluster-gateway in v1.7.5 uses 0.1 core 200 MiB so to make a fair comparison, we improved it to the resource given in v1.8.0.
Analysis
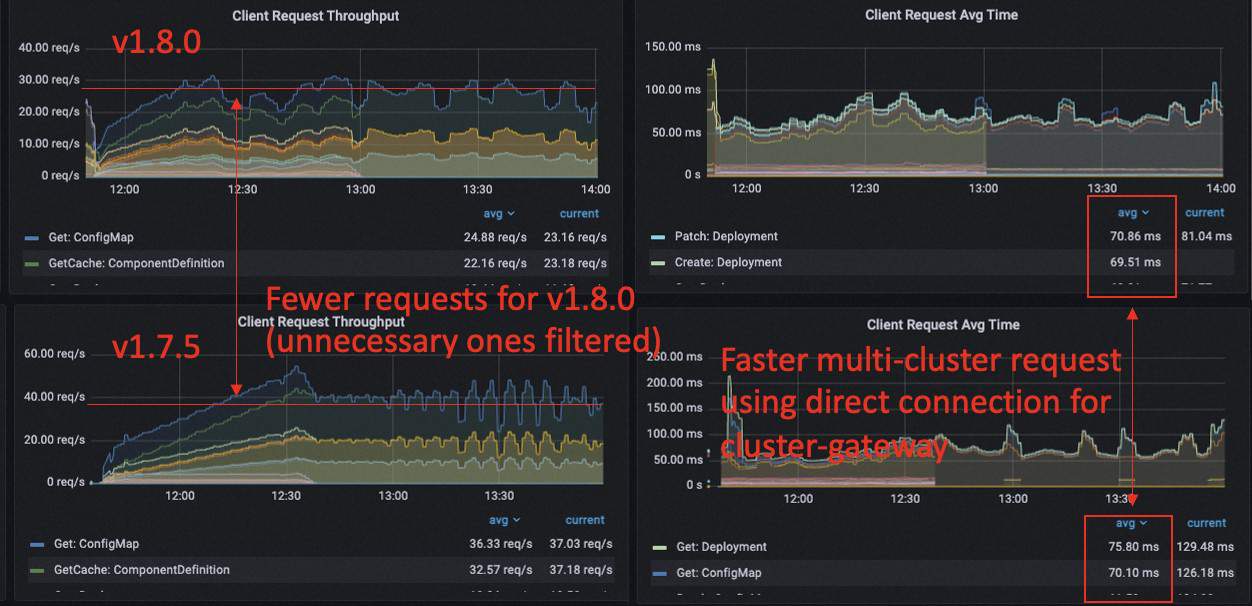
We saw that in both versions KubeVela was able to process 3k applications and manage resources in the remote cluster, but the performance of KubeVela v1.8.0 was better than v1.7.5, thanks to the optimization we mentioned above. We see the controller queue for v1.7.5 keeps at a high state which is caused by the large reconciliation time, it will potentially make the response of the controller to the application mutation slow. Except the optimization for cluster-gateway, all other optimization tricks that work for the single cluster case also work for the multi-cluster case as well.
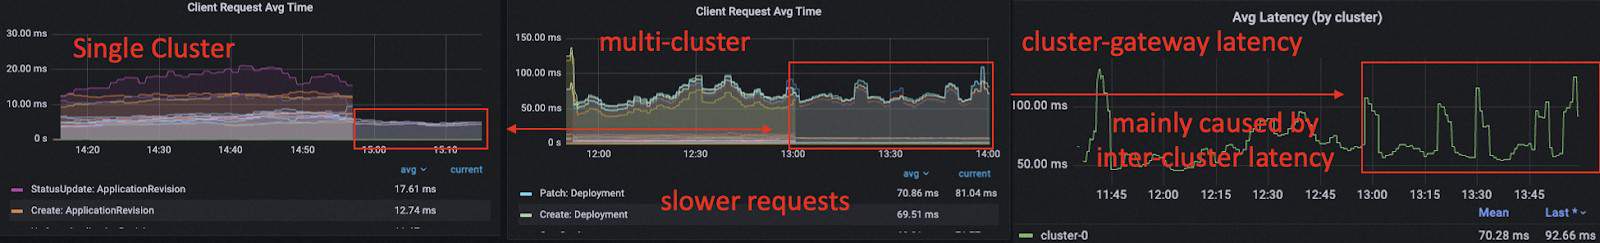
Compared to the 3k small applications in the single cluster case, deploying resources in remote cluster could greatly increase the time cost of the KubeVela controller. We can see from the dashboard that the request latency in the controller on average is about 77ms (20ms for single cluster case), and the latency of cluster-gateway on average is 72ms, only a marginal overhead compared to the inter-cluster latency.
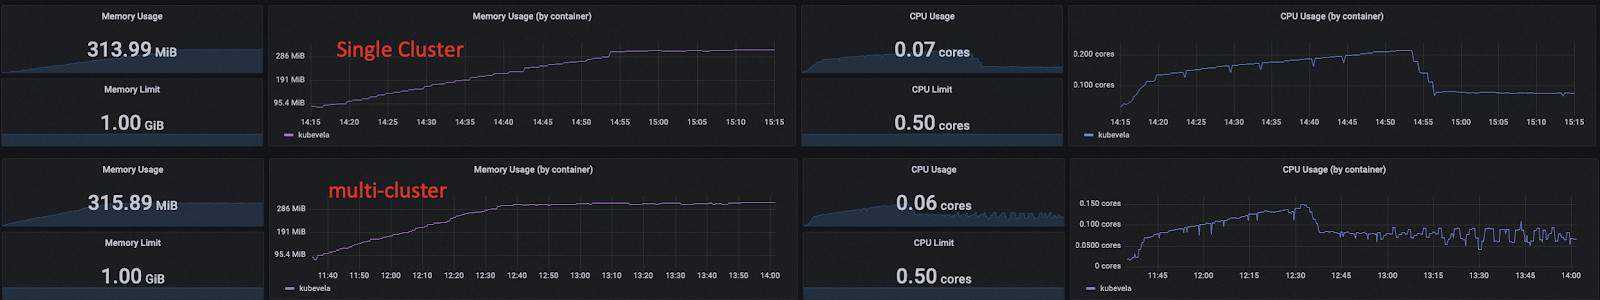
Although the latency is larger than the single cluster case, if we look at the computation resource usage of the KubeVela controller, we can find that there isn’t too much difference between the CPU usage and memory usage.
Conclusion
Generally, we know the following things from this experiment:
- The performance for v1.8.0 KubeVela is similarly better than v1.7.5 in multi-cluster scenarios.
- The memory consumption of the KubeVela controller in a multi-cluster scenario is close to the single cluster case.
- KubeVela v1.8.0 is able to handle 3k applications with default configuration, in various situations, including single cluster, large applications, multi-cluster deploy, continuous updates.
- If the managed cluster has a high latency to the control plane, the performance of the KubeVela controller will be poorer. Ways to optimize:
- Increase parallelism of KubeVela controller by adding CPU, concurrent-reconciles, QPS/Burst.
- Reduce the latency across clusters. (Check network bandwidth and ensure there is no rate limit.)
Large Scale
Setup
After we have tested multi-clusters and multiple shards, we now know that KubeVela is capable of dealing with a large number of applications across clusters. We designed a large scale load test to verify that with proper configuration, a single KubeVela control plane can satisfy the need of managing huge fleets.
We mocked 200 managed clusters through k3d on a 64 core 256 Gi virtual machine (ECS on Alibaba Cloud). For the control plane, we used a large ACK cluster (Kubernetes on Alibaba Cloud) with 8 (3 master and 5 worker) 32 core 128 Gi nodes. We ran 5 shards controllers, each with 8 core 32 Gi, 32 concurrent-reconciles, 4000 QPS 6000 Burst. We ran another 5 cluster gateways, each with 2 core 1 Gi.
Notice that we let the managed clusters to live in the same VPC and use intranet connection. This will reduce the latency between the control plane and managed clusters and increase the maximum of the network throughput.
We deployed 400k small applications to the system. Their resources were evenly distributed to 200 clusters.
Analysis
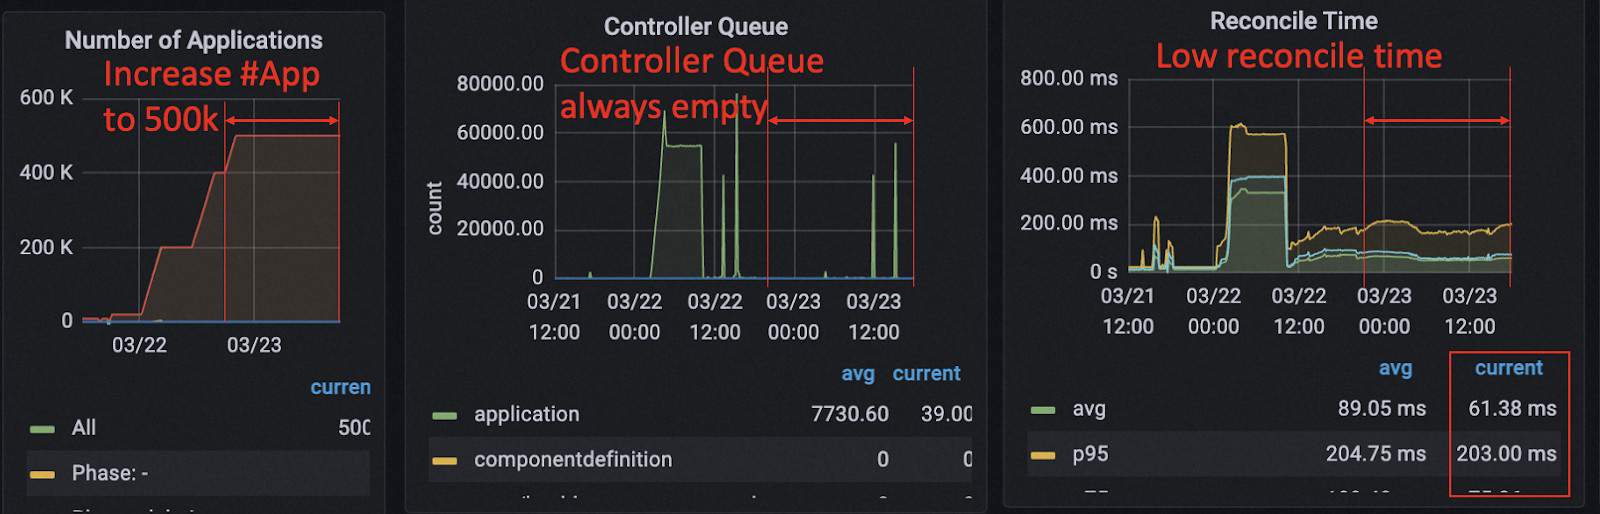
The delivery of 400k applications was divided into several stages. First, we deployed 20k applications to see if everything goes right and if there are any potential bottlenecks. Second, we deployed another 180k applications to see if the system can hold 200k applications. Finally we increased the number to 400k.
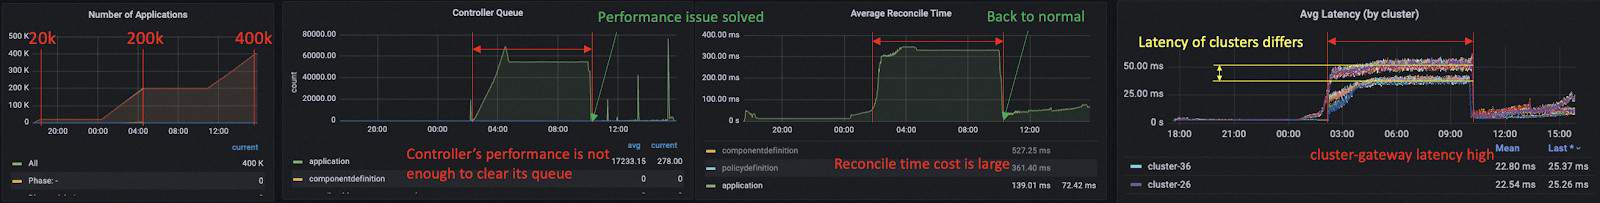
When we deploy 200k applications, the performance of the controller starts to drop and you can find that at about 2:00 the controller queue starts to rise and the average reconcile time goes up greatly. This was caused by a restart of one shard of KubeVela’s controller, which requires further investigation. The restart of the controller itself did not affect the running of applications but later we found the load of cluster-gateway pods were not evenly distributed. Lots of loads were centralized on two cluster-gateway pods and caused their CPU usage to reach 90%+. This then greatly reduced the throughput of multi-cluster requests, leading to slow reconciliation of applications.
About 10:00 we noticed that exception and restarted cluster-gateway pods to give them higher CPU (4 core 1 Gi * 5) and it solved the exposed bottleneck. Later we added another 200k applications and the response latency was always low.
After publishing 400k applications, the average reconciliation time goes to 70ms but it differs across different shards. Some shards have low multi-cluster request latency like 15ms per request while others have higher latency up to 30ms. The reason also goes to the unbalanced loads over multi replicas of cluster-gateway. But generally, if you only have one large cluster-gateway you would not encounter this problem.
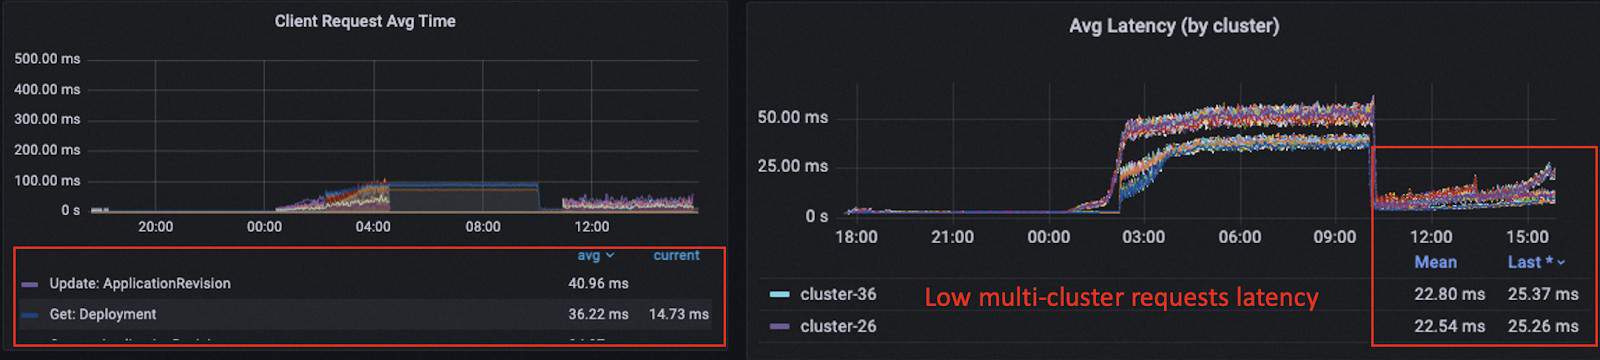
It is also noticeable that in this large-scale experiment, the managed clusters and the control plane were close and the traffic among them was fast. So unlike the multi-cluster experiment above, we could keep low reconciliation time similar to the single cluster case as well.

400k applications turn out to not be the max number of the application KubeVela control plane can hold. Only less than 20% of 32 Gi memory were used by each controller shard and the CPU usage was far from being fulfilled as well. But as there were lots of objects (Application, ResourceTracker, ApplicationRevision) stored in the etcd of the hub Kubernetes, the hub kube-apiserver and other native components like kube-controller-manager started using a large amount of computation resources, like over 90 Gi memory. The bottleneck of the system gradually went to the Kubernetes itself.
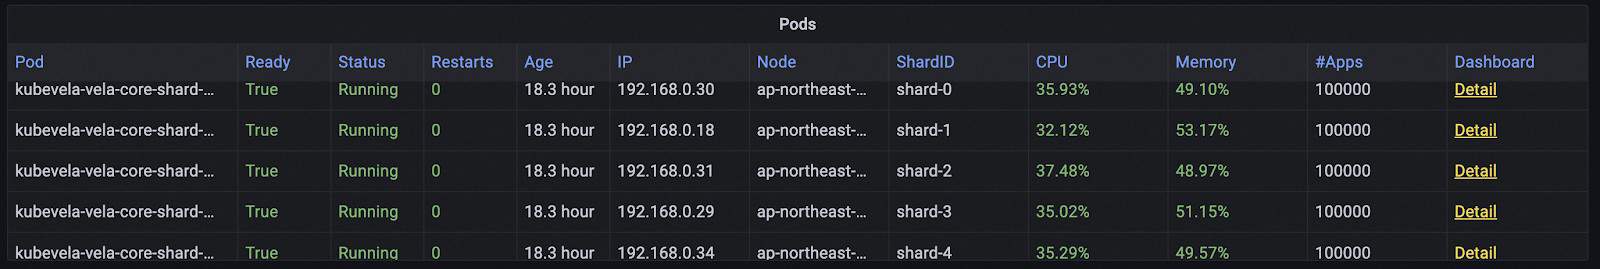
To make further verification to the above assumptions, we shrunk the memory of KubeVela controller from 8 core 32 Gi per shard to 8 core 16 Gi per shard (5 shards in total) and used one single cluster-gateway replica with 16 core 4 Gi to eliminate the imbalance of workloads. We increased the number of applications to 500k and saw all shards had similar performance. The CPU and memory usage of all controller shards were both healthy. The work queues of the controller shards are empty and the average reconciliation time for state keep was around 60 ms on average. The cluster gateway pod had high loads but could keep the average latency for multi-cluster requests at a low level (23ms).
We think the number of 400k/500k applications is large enough for almost all the KubeVela users by far so we stop the experiment here.
Conclusion
In conclusion, the large-scale experiment demonstrated that the KubeVela control plane has the ability to scale up and hold an extremely large number of applications under certain conditions.
Summary
With a series of experiments conducted under various scenarios, KubeVela v1.8.0 has shown its stability and scalability. There are considerable performance improvements compared to v1.7.5 and it gives confidence for system operators to let KubeVela manage large scale application platforms.
KubeVela nowadays has grown into a comprehensive solution for building application platforms. While the conducted load tests have covered some of the most popular use cases of KubeVela applications, we have also seen lots of more advanced usages with KubeVela, like complex workflow with input/output, canary release, GitOps, etc. Depending on the way users use KubeVela, the performance of the KubeVela system could expose different bottlenecks. And we summarized some trivial solutions as below.
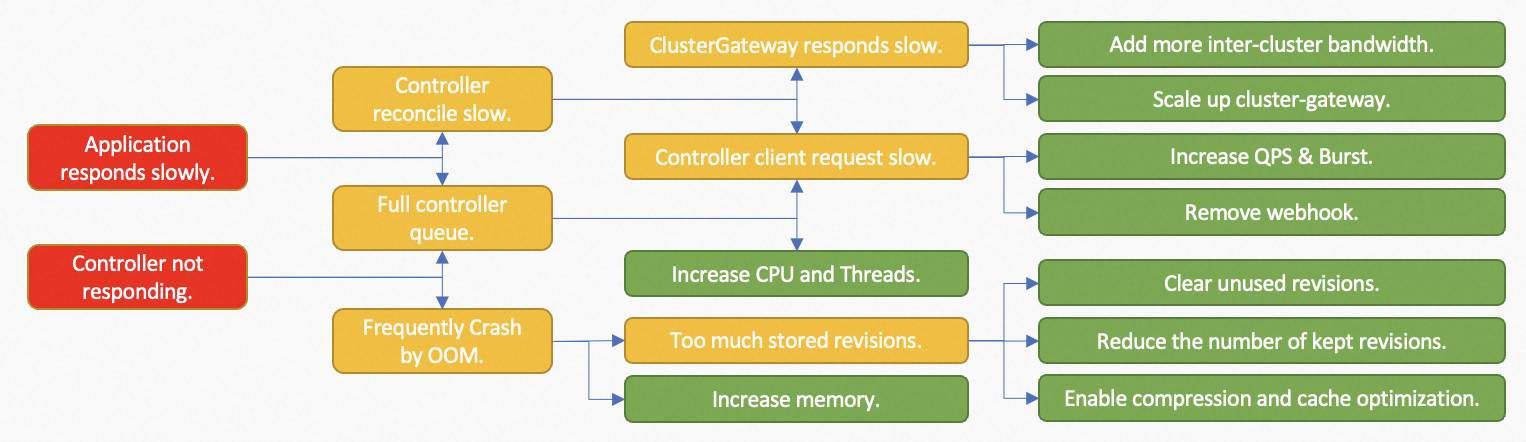
Sometimes, the bottleneck of the whole application system is not the KubeVela itself. For example, if the managed clusters have slow response or limited throughput, we can improve the throughput of KubeVela’s controller but the controller itself is unable to reduce that latency. Thanks to the system observability brought by addons, for the most time, you can find some clues why the system performs badly on the dashboard and apply proper strategies to make optimizations.
In the future, KubeVela continuously cares for the underlying performance of the whole KubeVela system and makes sure it can always provide stable and fast functionalities for the application delivery.