

Guest post by Jesse Meng and Qiming Hu, Tencent
Introduction
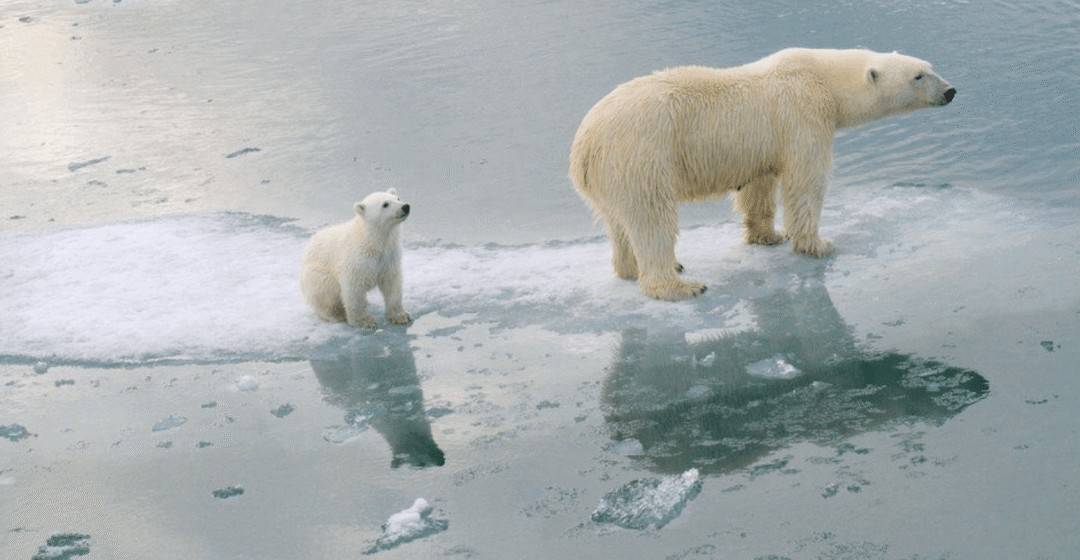
Do you know? The Arctic is so hot that you can wear short sleeves, with temperatures soaring to 32.5 degrees Celsius. Scientists say that many species have reached the brink of extinction as global warming intensifies, and polar bears will go extinct by the end of this century if no immediate action is taken. Reducing carbon emissions and protecting the planet has become a consensus for all mankind.
The Index Climate Action Roadmap released by the Global Climate Action Summit shows that digital technology solutions in energy, manufacturing, agriculture, construction, transportation and other fields can help the world reduce 15% of carbon emissions, and are key technological factors for achieving carbon reduction. Cloud computing platform is the “operating system” of data center infrastructure, connecting data center infrastructure and upper-level applications.
How to improve the overall energy consumption ratio without affecting business functions, use lower energy consumption, and make computing, storage, network and other resources meet the same business needs. Improving the overall energy consumption ratio and reducing PUE are the keys to data center energy saving. By implementing advanced technologies and management measures at the cloud computing platform level, the energy utilization rate of cloud computing data centers can be greatly improved, promoting cost reduction and efficiency enhancement, and achieving significant reduction of carbon emissions.
More and more people are paying attention to global warming, and more and more people are starting to take practical actions to reduce carbon emissions. As cloud practitioners, we also hope to awaken users’ environmental awareness through the capabilities of the cloud platform and help cloud users save energy and reduce emissions.
To this end, we launched Crane, an open source cloud native FinOps project in 2021, to help Kubernetes users perceive the carbon footprint of the applications they are responsible for. We hope to provide optimization suggestions through analysis of specific usage of applications and associate the optimization results with carbon emission reduction.
Methodology
Carbon Footprint has been discussed for years, and there are many related excellent prior works, the carbon footprint calculation methodology and emission coefficients of major cloud providers are defined by cloudcarbonfootprint.org (ref 1).
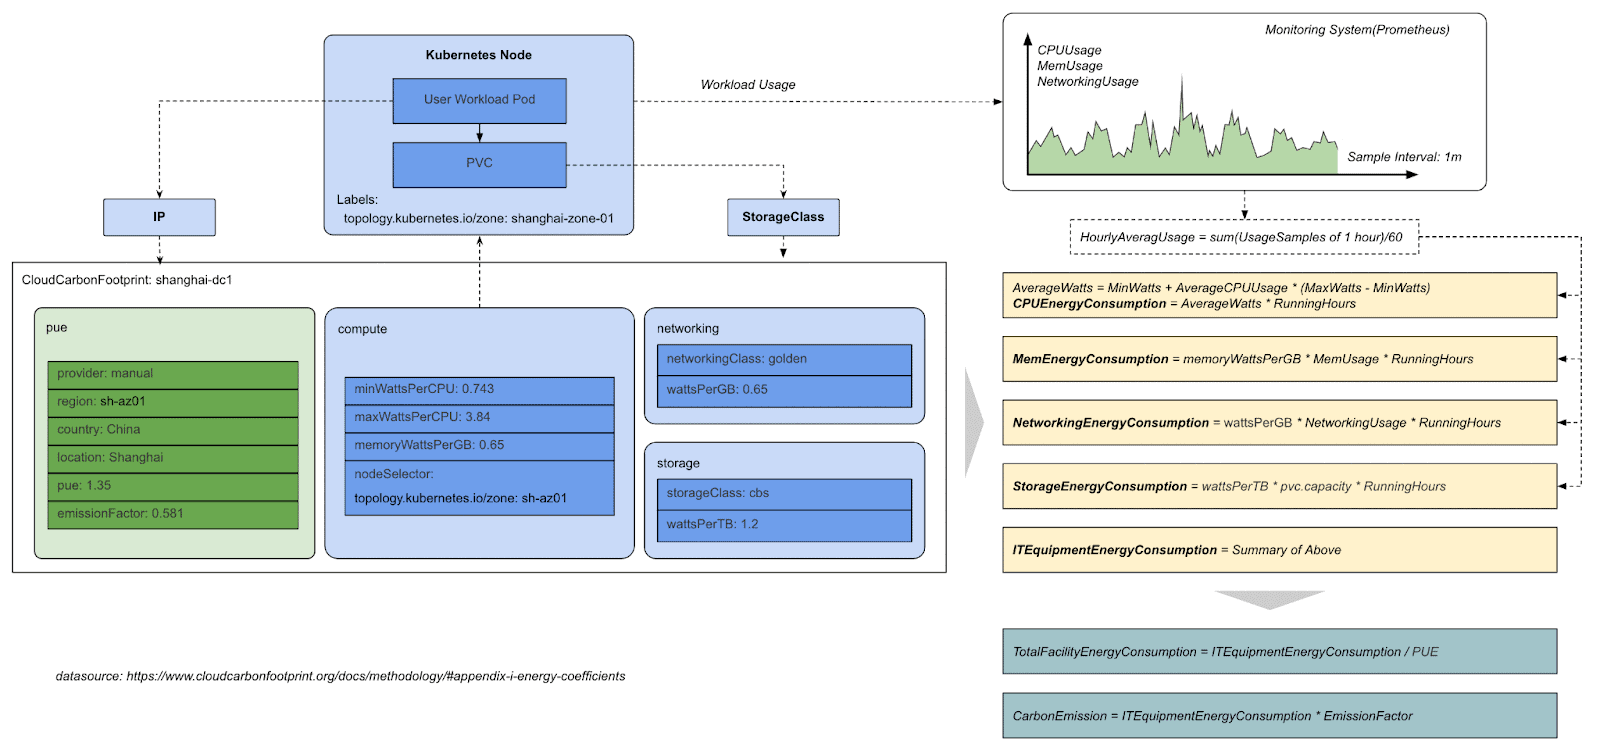
The real-time carbon emission of a Kubernetes workload can be calculated by the following steps:
- The actual workload usage which is collected by monitoring systems like Prometheus, the usage including cpu, memory, storage and networking.
- We get the emission coefficients of major cloud providers, take AWS as an example:
| Average Minimum Watts (0% CPU Utilization): 0.74Average Maximum Watts (100% CPU Utilization): 3.5Average CPU Utilization for hyperscale data centers: 50%HDD Storage Watt Hours / Terabyte: 0.65SSD Storage Watt Hours / Terabyte: 1.2Networking Kilowatt Hours / Gigabyte: 0.001Memory Kilowatt Hours / Gigabyte: 0.000392Average PUE: 1.135 |
- The CPU energy consumption of the workload can be calculated by the following forums
| AverageWatts = MinWatts + AverageCPUUsage * (MaxWatts – MinWatts)CPUEnergyConsumption = AverageWatts * RunningHours |
- Other resources energy can be calculated by the same method
| MemEnergyConsumption = memoryWattsPerGB * MemUsage * RunningHoursNetworkingEnergyConsumption = wattsPerGB * NetworkingUsage * RunningHoursStorageEnergyConsumption = wattsPerTB * pvc.capacity * RunningHours |
We get all energy consumption of the workload by summarizing all of the above,
| ITEquipmentEnergyConsumption = CPUEnergyConsumption + MemEnergyConsumption + NetworkingEnergyConsumption + StorageEnergyConsumption |
In many scenarios, we find that the energy consumption and usage information of the storage network is very difficult to collect. To simplify the energy consumption calculation, we introduce cpuEnergyConsumptionRatio in DatacenterFootprint, which allows users to estimate the proportion of CPU energy consumption in the total energy consumption. The calculation of total energy consumption can be simplified as:
| ITEquipmentEnergyConsumption = CPUEnergyConsumption / cpuEnergyConsumptionRatio |
Then the total facility energy consumption for the particular workload can be calculated by dividing the PUE factor of the datacenter.
| TotalFacilityEnergyConsumption = ITEquipmentEnergyConsumption / PUE |
And finally we get the carbon emission for the workload by multiplying the emission factor.
| CarbonEmission = ITEquipmentEnergyConsumption * EmissionFactor |
Hope the following diagram helps you understand the model better.
Crane
Crane is a FinOps Platform for Cloud Resource Analytics and Economics in Kubernetes clusters. The goal is not only to help users to manage cloud cost easier but also ensure the quality of applications.
Crane covers the whole FinOps stage from inform, optimize to operate. It provide main feature including:
- Cost Visualization and Optimization Evaluation
- Recommendation Framework
- Prediction-driven Horizontal Autoscaling
- Load-Aware Scheduling
- Colocation with Enhanced QoS
Crane is a CNCF Landscape project that enriches the area for Continuous Optimization. It naturally supports all the native Kubernetes APIs and fits well in the cloud-native ecosystem. Crane integrated with Prometheus, Grafana and ArgoCD. In the FinOps area, Crane is a FinOps Certified Solution of the FinOps Foundation.
Crane has been adopted by many large-scale organizations for cloud resource utilization tuning and cost optimization, and the contributors are from Tencent, Google, Tesla, eBay, NetEase etc.
Model
We tried to model the emission coefficients as Kubernetes API in Crane, and we leverage the model to do the operational carbon footprint calculation, visualization, and optimization.
CloudCarbonFootprint is a new model being introduced to the Crane API repo (https://github.com/gocrane/api/). It supports manual provider currently, which means the coefficients are predefined manually, and later on different cloud providers can query those informations via cloud API and fill the information dynamically.
kind: CloudCarbonFootprint
apiVersion: co2e.gocrane.io/v1alpha1
metadata:
  name: carbonFootprint-shanghai-dc
spec:
  provider: Manual
  region: shanghai
  zone: china-shanghai-az01
  locality: AP/China/Shanghai/AZ01
  pue: '1.5'
  emissionFactor: '0.5810'
  computeConfig:
  - nodeSelector:
      matchLabels:
        topology.kubernetes.io/zone: shanghai-zone-01
    minWattsPerCPU: '0.743'
    maxWattsPerCPU: '3.84'
    memoryWattsPerGB: '0.65'
  storageConfig:
  - storageClass: cloudBlockDevice
    wattsPerTB: '1.2'
  networkingConfig:
  - storageClass: golden
    wattsPerGB: '0.65'
It’s normal that there are multiple Compute Server types in a single Kubernetes cluster, so computeConfig is defined as an array, with a nodeSelector to select the subset of the cluster nodes.
Generally, there are multiple storage classes in a single Kubernetes cluster, with different types of storage as the backend, like Local or Remote, HDD or SSD, different redundant levels, like single replica or multiple replicas. Different storage classes lead to different energy consumptions, so wattsPerTB can be defined to each storage class.
We treat network links similar to storage, there are three kinds of network links which are classified as gold, silver, and bronze, which standards for bi-direction redundant, single-direction redundant, and no redundant. We define such redundant levels as networking class, and it’s clear that the energy consumptions are different.
Visualization
In terms of data center capacity, IT equipment utilization is usually very low. Server utilization is only 5-15%, processor utilization is 10-20%, storage device utilization is 20-40%, and network device utilization is 60-80%. But even if any such device is idle, the device still consumes most of the electricity. A standard server consumes 30-40% of the maximum power (idle watts: 200W+) even when it is completely idle. The core solution to reduce carbon emissions, in addition to replacing clean energy for data centers, is to increase the resource utilization and energy consumption ratio of a single machine.
Crane Carbon Emission Optimizer can help you increase the resource utilization and energy consumption ratio of a single machine. It starts from the node dimension, focusing on energy consumption, carbon emission display and guiding users how to do resource optimization.
Crane Carbon Emission Optimizer can optimize data centers with carbon emission indicators based on Crane’s capabilities, reasonably increase the workload ratio of a single machine, reduce overall energy consumption, and achieve low consumption, low emission and low carbon effects; it can also combine the capabilities of self-built IaaS platform, dynamically hibernate physical servers, thereby optimizing the online number of physical servers, reducing data center electricity costs and carbon emissions. Crane Carbon Emission Optimizer uses Crane’s Recommendation capability to analyze the number of replicas and resources of workloads, and recommend appropriate number of replicas and resource configurations. This effectively improves the problem of resource waste and improves the overall energy consumption ratio.
Optimization
By using the above formula and the workload data collected by Prometheus Exporter in the cluster, we can construct the corresponding PromQL (Prometheus Query Language) statement, and display the carbon emission of the cluster in real time on the Dashboard.
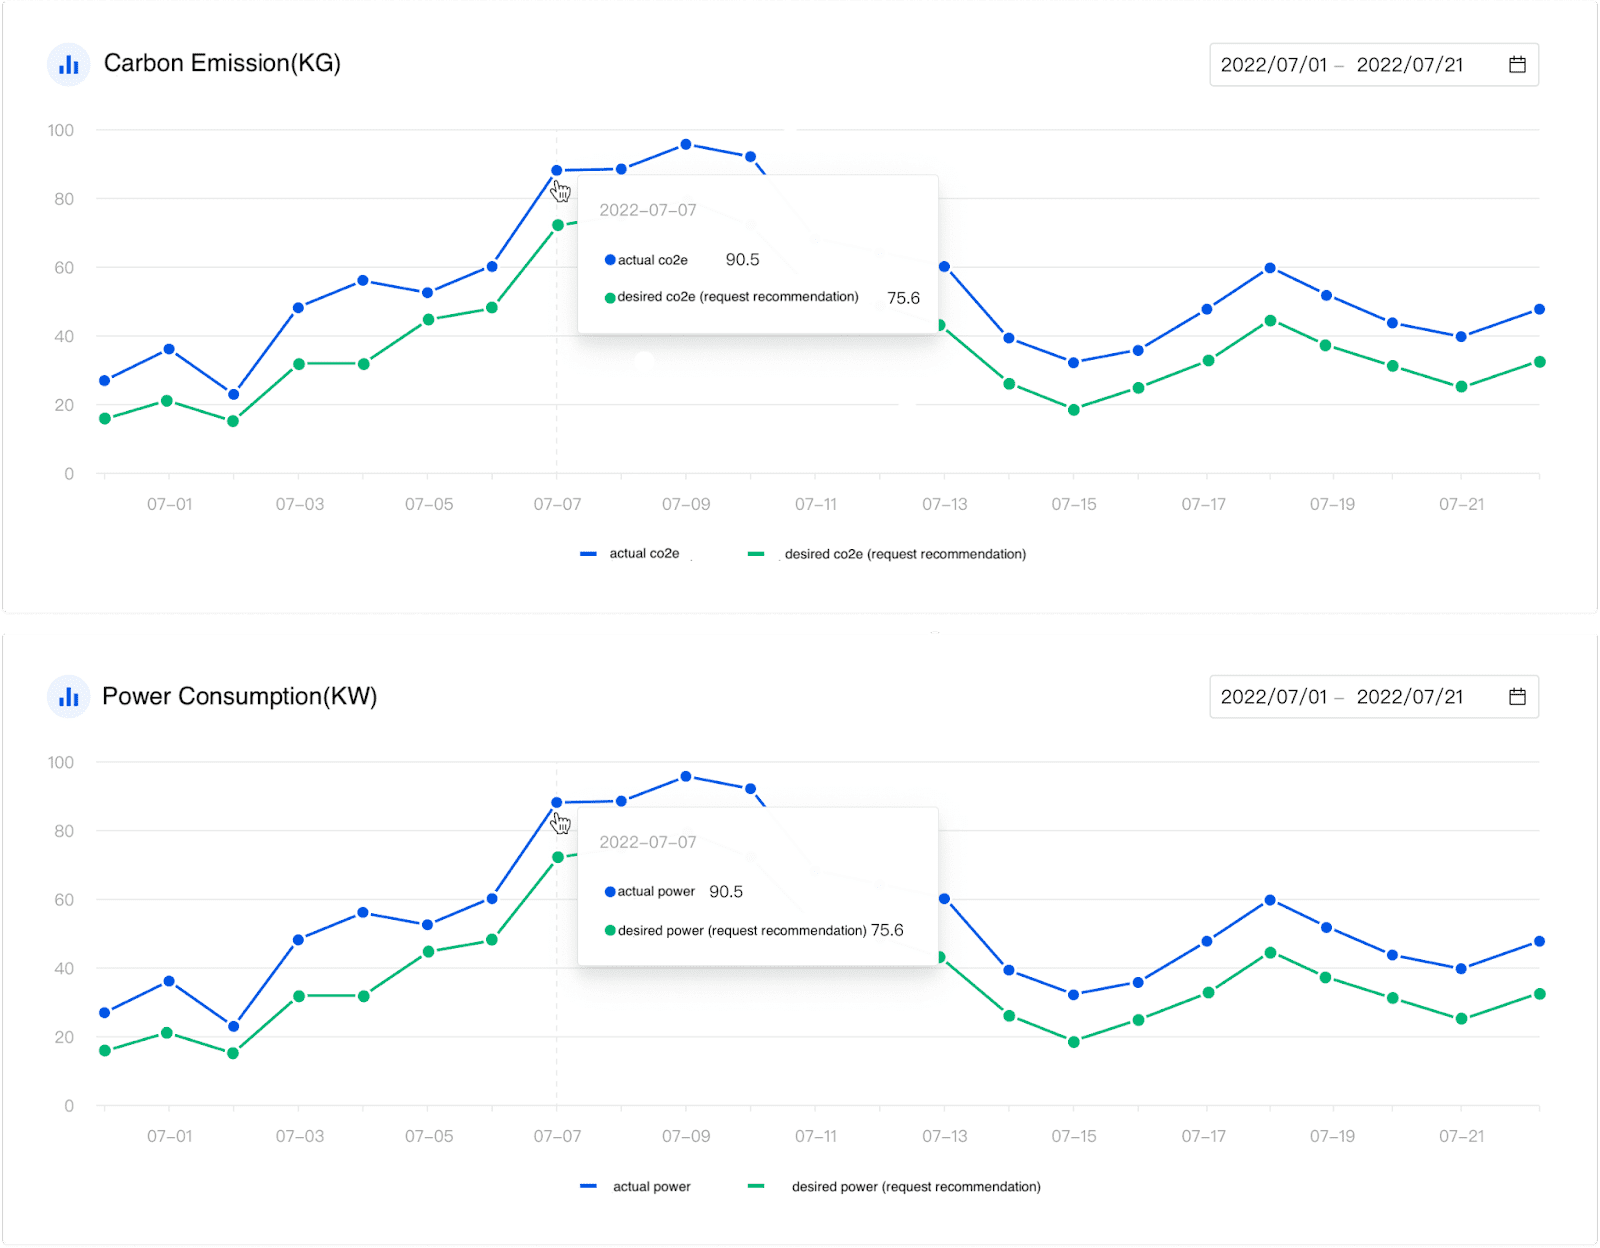
The figure above clearly shows the carbon emissions and energy consumption of each workload. If the proportion of a certain type of workload is too high, consider scheduling it to a data center with a lower electricity price. For example: if the energy consumption ratio of the workload running offline tasks in the data center in Guangzhou region is too high, you can consider migrating the workload of offline tasks to the data center in Guizhou region. That is, migrate tasks from regions with higher electricity prices to regions with lower electricity prices, which coincides with the concept of “eastern data and western calculation”.
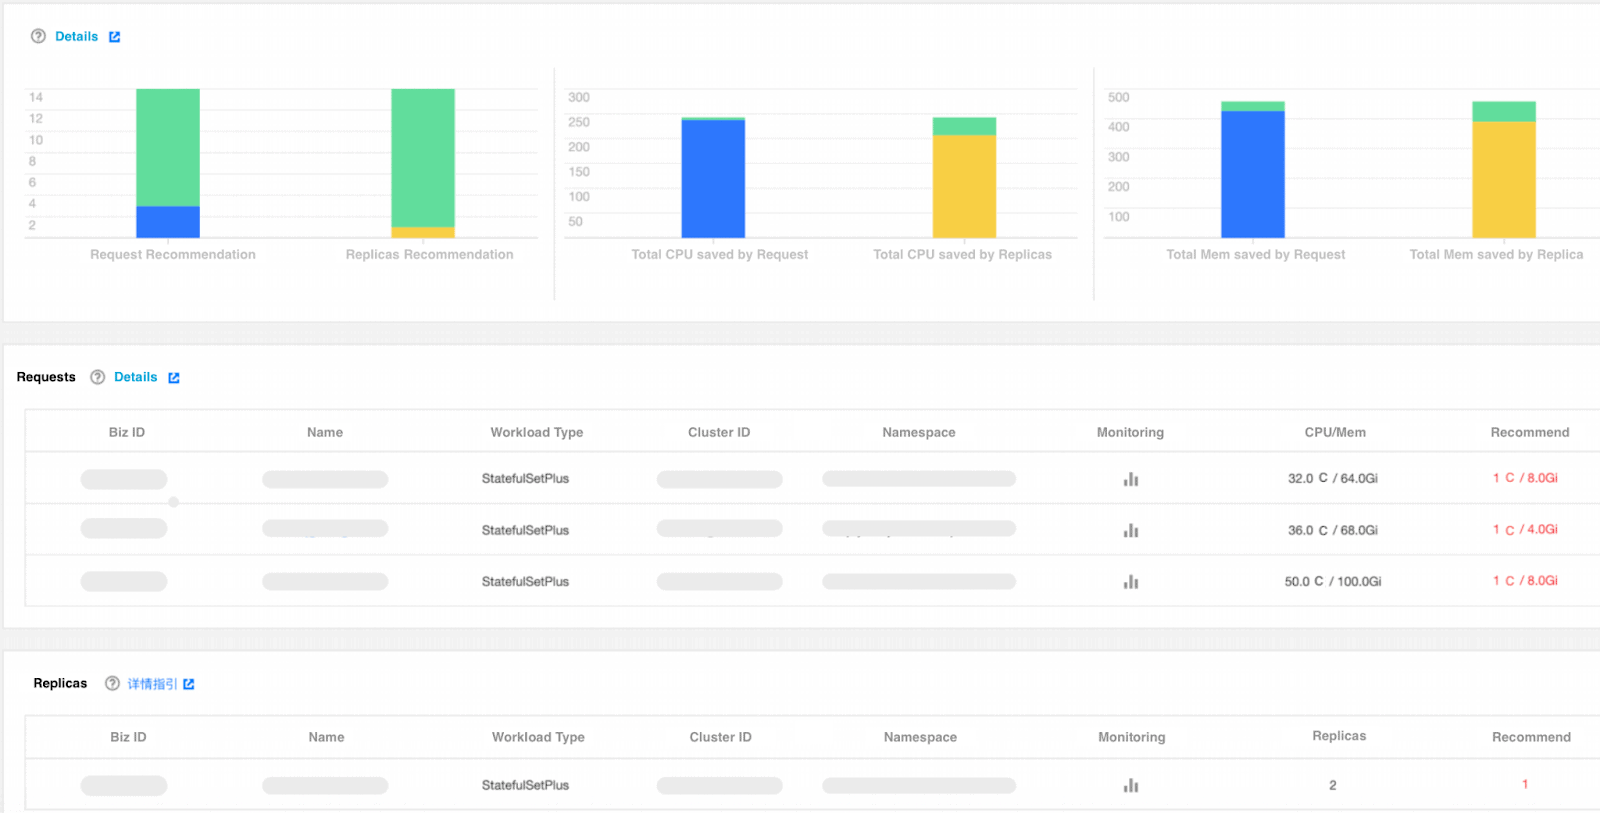
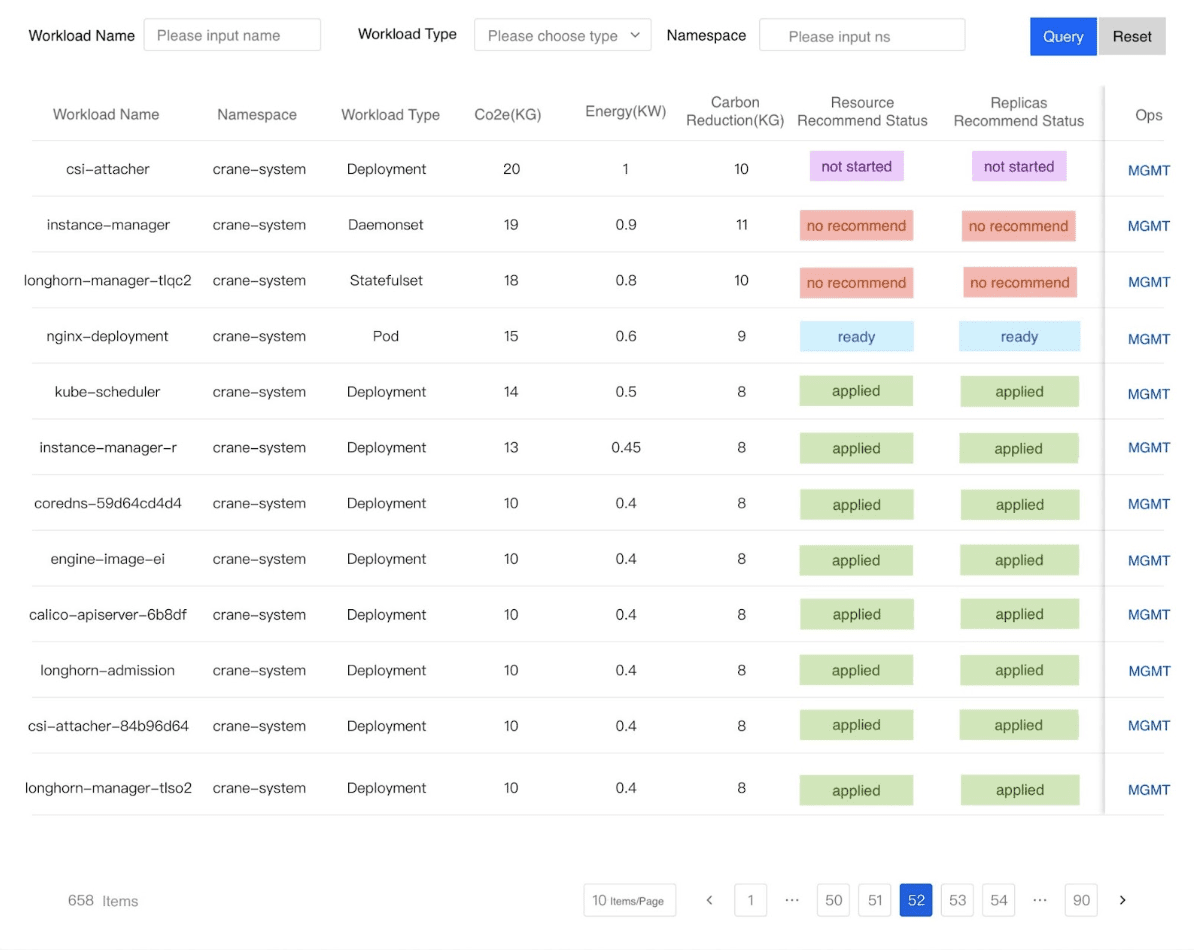
The figure above shows that there is a big difference between manual configuration and recommended configuration, reflecting that resource configuration based on experience is inaccurate and leads to a lot of resource waste. After Crane was implemented internally, it helped businesses optimize resource utilization and achieved significant energy saving and emission reduction effects. Before optimization, the application of a certain business department occupied 1 million cores, with an average utilization rate of 15%; after optimization, the number of cores dropped to 800,000, and the utilization rate increased to 19%. This business department alone reduced carbon emissions by 2064 tons per year, and Crane contributed its own strength to protect the earth.
Summary
We just started the journal of modeling carbon footprint with Kubernetes workload, with predefined experienced coefficients, and the model is still in a very early stage(v1alpha1). We really hope you can visit the code and have a look at the definitions, and any issues or PRs are most welcomed.
We also faced some challenges that need to be discussed with more audiences, and we are waiting for better outcomes with more people being engaged.
For example:
- PUE is a fixed configuration in the model now, but actually it is changed with time, so it’s more like a metric, should we collect it and how?
- Currently the Carbon Footprint info is calculated in real time, should we store the result and where?
- Tencent Cloud OS has some energy saving features called Wujing, which can migrate processes to the same cores, and put remaining idle cores to power-save mode dynamically, which can save a lot of energy. This feature will be integrated into Crane in the future.
- The predefined coefficients are only the average value of top cloud providers. If you are running an on-premises data center, then you might be able to check the server power consumption information from standard performance evaluation organizations (such as: https://www.spec.org/) and define CloudCarbonFootprints for your own devices.