
Guest post originally published on the Logz.io blog by Tamir Michaeli and Dotan Horovits
Open source metrics monitoring with Prometheus, InfluxDB, and Grafana
It’s monitoring time. We all collect metrics from our system and applications to monitor their health, availability and performance. Our metrics are essentially time-series data collected from various endpoints. Then, it is stored in time series specialized databases, and then visualized in the metrics graphs we all know and love.
There are open source solutions that have become quite popular in this domain. On the storage side, Prometheus and InfluxDB are very popular time series databases. Prometheus is a graduated open source project under the Cloud Native Computing Foundation (CNCF) that has become quite a common standard for cloud-native workloads, with many Prometheus-compatible solutions available such as M3DB, Thanos and Cortex. InfluxDB open source project, on the other hand, is maintained by InfluxData. Each of these databases has its own query language for the time series data: Prometheus works with PromQL while InfluxDB works with InfluxQL. Check out this post for an overview of how Prometheus and InfluxDB compare.
On the visualization side, Grafana open source project by Grafana Labs has been quite a popular user interface for visualizing metric data from various data sources, including InfluxDB and Prometheus and their respective query languages. Similarly to Prometheus, there are multiple solutions offering compatibility with open source grafana.
InfluxQL and PromQL: Different languages for querying time series data
As the popularity of Prometheus increases, many users choose to migrate their metrics monitoring from InfluxDB to Prometheus. As Grafana supports both data source types, it’s compelling to keep the same frontend (Grafana) while migrating the time series database under the hood. This, however, isn’t as seamless as you might think.
Each Panel (an individual visualization in a Grafana dashboard) has an underlying query that defines the dataset being visualized. And since InfluxDB and Prometheus employ different query languages, these queries need to be translated in order to migrate existing dashboards.
How different is it? Let’s look at an example query as it’s written in both languages:
PromQL:
max_over_time(disk_used_percent{host=~\"$host\",path=~\"$paths\"}[$__interval]InfluxQL:
SELECT "used_percent" FROM "disk" WHERE ($timeFilter AND "host"=~$host$ AND "path"=~$paths$) GROUP BY time($_interval),"host","path"As you can see, PromQL is a single string in a functional syntax, whereas InfluxQL has an SQL-like declarative syntax. The examples also demonstrate the use of variables (the ones with ‘$’ sign). We’ll get back to this example later when showing how the conversion works.
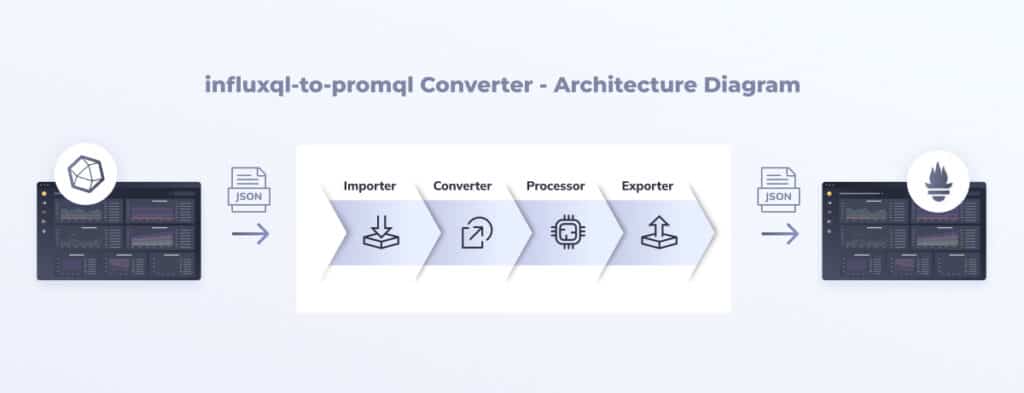
We’ve seen the growing need and decided to automate the migration process of Grafana dashboards from influxQL to PromQL to help our users and the broader community. This is how the new open source influxql-to-promql-converter tool came to be. Grafana dashboards can be exported as JSON files, and this JSON can be automatically manipulated to perform the transformation, resulting in a new JSON that can be imported into open source Grafana or any compatible service. In this article we’ll describe how the tool works, and how you can get started using it.
Note: This project is based on an open source library developed by Aiven.io’s Markus Stenberg and Rauli Ikonen.
InfluxQL and PromQL in Grafana dashboards
Grafana’s dashboard JSON model makes the task of editing and changing dashboard settings very easy. The dashboard conversion process addresses the following fields:
- Templating – this field contains an array of template variables with their saved values along with some other metadata.
- Panels – this field consists of data source queries, type of graphs, aliases, etc. Specifically, we will work on the “target” field, which contains the source query.
For more information on the dashboard JSON model check out the project documentation.
The heart of the dashboard conversion process lies in converting the queries. In PromQL the query is a single string in the “targets” element of each panel, while in InfluxQL it is multiple objects containing the elements of the query, such as “select”,”groupBy” and ”measurement”, in JSON format, in the “targets” elements of each panel. The tool needs to construct the InfluxQL query from the separated elements and then convert it to PromQL. Let’s look at an example:
PromQL-based Grafana panel targets example:
{
  "expr": "avg_over_time(JVM_HeapMemoryUsage_used{Environment=\"Prod\",host=~\"$host\"}[$__interval]) ",
  "format": "time_series",
  "instant": false,
  "intervalFactor": 1,
  "legendFormat": "{{ jolokia_name }} p1003",
  "refId": "A"
}
InfluxQL-based Grafana panel targets example:
{
  "alias": "$tag_host",
  "dsType": "influxdb",
  "groupBy": [
    {
      "params": [
        "$_interval"
      ],
      "type": "time"
    },
    {
      "params": [
        "host"
      ],
      "type": "tag"
    },
    {
      "params": [
        "null"
      ],
      "type": "fill"
    }
  ],
  "measurement": "mem",
  "orderByTime": "ASC",
  "policy": "15d",
  "refId": "A",
  "resultFormat": "time_series",
  "select": [
    [
      {
        "params": [
          "used"
        ],
        "type": "field"
      },
      {
        "params": [],
        "type": "max"
      }
    ]
  ],
  "tags": [
    {
      "key": "host",
      "operator": "=~",
      "value": "/^$host$/"
    }
  ]
}
Now that we understand how the dashboard JSON is structured, let’s see how to convert it.
Converting Grafana Dashboards from InfluxQL to PromQL
The tool makes extensive use of regex capture groups to parse the InfluxQL strings and extract the relevant elements, which are then used to construct the equivalent PromQL string.
The conversion process is comprised from two steps:
- Converting the “templating” element of the dashboard.
- Creating the InfluxQL query string and converting it to PromQL.
Let’s see how each step works:
1. Converting templating
Templating is a very important feature of Grafana, which allows us to make our dashboards more interactive and dynamic by defining variables (among other features). The main conversion takes place on the “query” element, which defines the key and value for the defined variable.
Let’s look at an example templating query in an InfluxQL dashboard:
"SHOW TAG VALUES FROM "disk" WITH KEY = "host\""The tool extracts the key and tag from the query, in our example disk and host , and constructs the equivalent in a PromQL templating query:
"label_values(disk,host)"2. Converting queries and targets
The target element of each panel contains the database query, along with additional fields that affect the representation of the query result in the dashboard.
Let’s look again at the example query we showed before:
InfluxQL:
SELECT "used_percent" FROM "disk" WHERE ($timeFilter AND "host"=~$host$ AND "path"=~$paths$) GROUP BY time($_interval),"host","path"PromQL:
max_over_time(disk_used_percent{host=~\"$host\",path=~\"$paths\"}[$__interval]
The tool addresses several elements when parsing the InfluxQL query and constructing the PromQL equivalent:
Metric name and the series name. In our example, extracting disk and used_percent and construct the PromQL concatenated full metric name disk_used_percent.
Labels and their values. In our example, it extracts ("host", ^$host$), ("path", ^$paths$) and constructs the PromQL equivalents: (host, “$host”) , (path, “$paths”)
Aggregations. In InfluxQL primary aggregations appear after the SELECT statement. Our original example didn’t use one, so let’s look at a new example with such aggregation, and its PromqQL equivalent:
InfluxQL:
SELECT non_negative_derivative("ClientRequest.Read.Latency_Count", $interval) FROM "cassandra" WHERE ($timeFilter AND "host"=~$host$) GROUP BY time($__interval)PromQL:
rate(cassandra_ClientRequest_Read_Latency_Count{host=~\"$host\"}[$__rate_interval])This example InfluxQL query contains non_negative_deravative aggregation. The tool uses a predefined mapping of InfluxQL aggregations to their PromQL equivalents. In our example, non_negative_deravative will be converted to PromQL’s rate aggregation function. If no match is found in the mapping, it defaults to avg.
This is only a partial list of the elaborate query conversion logic implemented in the tool. We haven’t addressed elements such as the GROUP BY statement in InfluxQL which can contain fills or time intervals, as well as aggregations, which the tool carefully decomposes as well.
The tool can also identify that the query contains any sub-queries, in which case each sub-query will be treated under the same logic as above. In InfluxQL sub-queries would look something like that:
SELECT “used percent” FROM (SELECT “used percent” ..)
Once the query conversion is complete, the tool wraps the new query in a target object in the new JSON of the PromQL dashboard.
It’s important to note that InfluxQL is very flexible in terms of naming and syntax (i.e. templating syntax), therefore there are cases where the conversion will not work. We are constantly improving the conversion algorithm. We welcome any feedback and contribution from the community to help us improve it.
A pluggable approach to import, process and export dashboards
In order to make the script usable for a wider range of users and not only developers, we needed to add additional components around it and turn it into an operational tool with configurable import, processing and export capabilities.
We built the tool in a modular data pipeline architecture, similar to the approach taken by other projects such as OpenTelemetry and Telegraf. This approach provides modularity, extensibility and maintainability, while also providing operating flexibility and run results in a readable format for the end user.
Example Setup
Let’s look at an example of using the tool to import an InfluxQL dashboard from a Grafana repository over the internet, converting the dashboard and exporting the resulting JSON of the dashboard to a remote target, in our case to Logz.io’s Infrastructure Monitoring service. You can find the example source code in the examples folder of the GitHub repo, as well as a similar example using locally hosted Prometheus and Grafana instances, in case you wish to run it locally rather than via a hosted service.
We will use the following dashboard JSON as our example.
Clone the repository:
Git clone https://github.com/logzio/influxql-to-m3-dashboard-converter.gitStep 1: Configure the import, processor and export.
In our case, we want the InfluxQL dashboard to be extracted from Grafana, converted and processed with the available processors to enable maximum coverage of metrics naming changes, and then exported to our Logz.io account. In the following steps we’ll see how to edit the config.yaml configuration file to set it up.
InfluxQL source dashboard import configuration
We will define our desired datasource and logging level:
log_level: DEBUG
datasource: Prod Env metrics
Next, we will define our importer to extract the dashboard from our Grafana instance:
importer:
 grafana:
   endpoint: https://myusername.grafana.net
   api_token: <<grafana_api_token - redacted>>
The Grafana API token can be created by navigating to Settings, in the API Keys windows.
Besides a Grafana API endpoint, the tool currently also supports importing from a local folder.
Metric names processor configuration options
Next, we will add our processor configurations. The processor is a very powerful component that can transform metric names, in case a different nomenclature is used in InfluxQL and PromQL. The transformation can be explicitly stated in the processor configuration, or it can be automatically inferred by querying the existing metrics in our time series database (using standard Prometheus API) and comparing them to the existing metrics in the imported dashboard. This automatic matching can be done by checking permutations on the metric name, or using statistical matching algorithms.
In our example, we will use replace_metrics_names processor to compare existing dashboard metrics against the sent dashboard metrics, replace metrics with high statistical match (to overcome different shippers namings), and use permutation matching to replace metrics with similar namings.
We will use Logz.io as our managed Prometheus and Grafana-compatible instances. If you don’t have an account you can get a free one here.
We can use other managed/non managed Prometheus and Grafana instances by configuring the endpoint and header accordingly.
processor:
 find_metrics_names:
   metrics_db_endpoint: https://api.logz.io/v1/metrics/prometheus/api/v1
   metrics_db_header:
     key: X-API-TOKEN
     value: <<logzio_prometheus_api-token - redacted>>
   replace_strategy:
     strategies: ['statistic_combination' , 'permutation']
     min_match_percent: 95
     min_filter_percent: 92
Note that Logz.io’s Prometheus API token can be provided also through the support chat.
Export configurations for the resulting PromQL dashboard
For the last part of the configuration, we will add our export target. Currently the tool supports a Grafana API endpoint, or a local folder. For this example we will export the converted dashboard to a local folder and to our Logz.io account:
exporter:
 grafana:
   endpoint: https://api.logz.io/v1/grafana/api
   auth_header:
     key: X-API-TOKEN
     value: <<logzio_grafana_api_token - redacted>>
 folder:
   path: "disk_test_promql"
Note that Logz.io’s Grafana API token can be retrieved by navigating to Settings, and then to the Manage Tokens section under API Tokens tab, in the Logz.io app.
Step 2: Run the converter
Install the requirements and run the converter with the updated configuration.
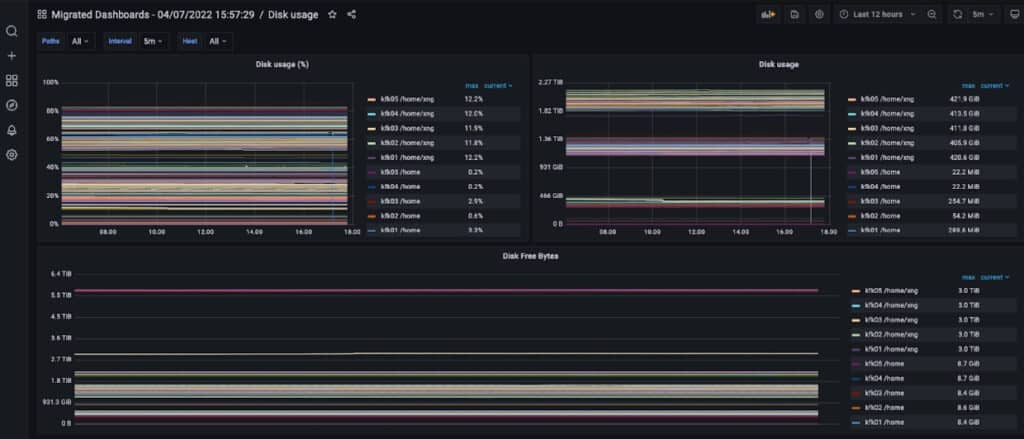
pip install -r requirements.txt && python3 main.pyStep 3: View the resulting Grafana dashboard
Now it’s time to review the converted dashboard. Let’s open the dashboard in our Logz.io account:
Summary
Prometheus is the leading metrics monitoring tool today, and many want to move to using it, but they get stuck because of all the investment put into developing their existing dashboards.
This new open source influxql-to-promql-converter tool offers a lean and pluggable approach to importing Grafana dashboards from various sources (local or remote), automatically converting the metrics names and queries from InfluxQL to PromQL, and exporting the resulting dashboard to your Grafana-compatible destination of choice.
Try out the tool and share your feedback over the GitHub repo, and better yet get involved and help us make it better. For importing the dashboards to Logz.io, find detailed instructions here.
For more insight into which metrics are best to monitor and the best types of visualizations to monitor them, watch the webinar First Steps to Building the Ultimate Monitoring Dashboards in Logz.io where we deep dive into how you can use Logz.io’s Open 360 platform to get to where you want in your cloud infrastructure monitoring data visualization journey.