

Guest post by Benoit Schipper
I have been working with multiple Kubernetes-like distributions for the past few years. Adopting Kubernetes brings many benefits, but also many challenges. Traditionally we have hosted web servers or proxies, such as NGINX, on physical servers. Even if these servers were virtualized, they were still servers that we rarely modified after initial setup. The server was running a stable OS, receiving occasional updates, and happily doing its thing. The fact that the server didn’t change meant that it was relatively easy to monitor it and the applications running on it.
In Kubernetes, servers change all the time. Pods and nodes move and the containers running servers move with them. Microservices and micro-front ends make the monitoring environment even more dynamic. In many cases, we’re monitoring not just a server but a service, not just an application but compound applications that are composed of many small front ends.
My experience is that it’s difficult to monitor NGINX Open Source and applications running on NGINX web servers and proxies in a Kubernetes environment. This post describes the simple solution I developed: I create a key-value pair that allows us to match metrics to time-series data, export that information into a Prometheus monitoring database, and display the information in Grafana dashboards.
The Challenge
Working as a Site Reliability Engineer (SRE) and DevOps expert at HCS Company in the Netherlands, I have built and monitored infrastructure for many large corporations, nationally and internationally. When working with one of our customers’ DevOps teams, I became annoyed that I couldn’t easily gather the metrics needed to monitor front ends. We had been successfully scraping metrics using Prometheus on OpenShift from back-end applications and wanted to do the same for our micro-front-end applications.
A quick explanation – with a micro-front end, instead of hosting our complete front end on one web server, we split it up logically into parts that can be spread across multiple pods (deployments) within OpenShift. This adds some complexity but also the following benefits:
- Compartmentalization and reduced blast radius – If any of the deployments or pods that make up our front end fail, only that part of the front end goes down. The rest keeps running.
- Simpler troubleshooting and safer deployment – Using micro-front ends also means that any changes made to the front end are deployed within a smaller context relative to the overall front-end codebase. This makes it easier to troubleshoot issues and safer to deploy to production.
(Note: For more about micro front ends, I recommend this post by Michael Geers.)
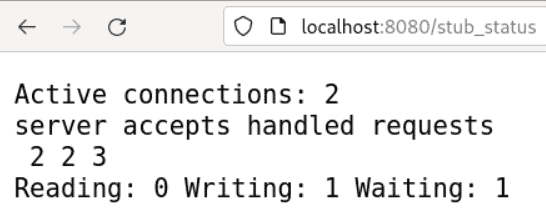
So what was the problem? The NGINX Stub Status module exposes metrics at a HTTP endpoint, /stub_status by convention. Unfortunately, the metrics are not in the key-value format that Prometheus requires to scrape and store the information:
The Solution
So I had to find a way to reformat the metrics. Whenever I encounter such a problem, I always think to myself, “someone else must have encountered this problem before!” And indeed someone had – I found the nginx-prometheus-exporter project at NGINX’s GitHub repo.
NGINX Prometheus Exporter runs in a sidecar container within the same pod as the NGINX container that was hosting part of our micro-front end. After reading the documentation I exposed the /stub_status endpoint in my NGINX configuration. I then spun up a deployment that initialized our micro-front end pod, containing the nginx-prometheus-exporter container. Here’s the relevant part of the YAML-formatted deployment template:
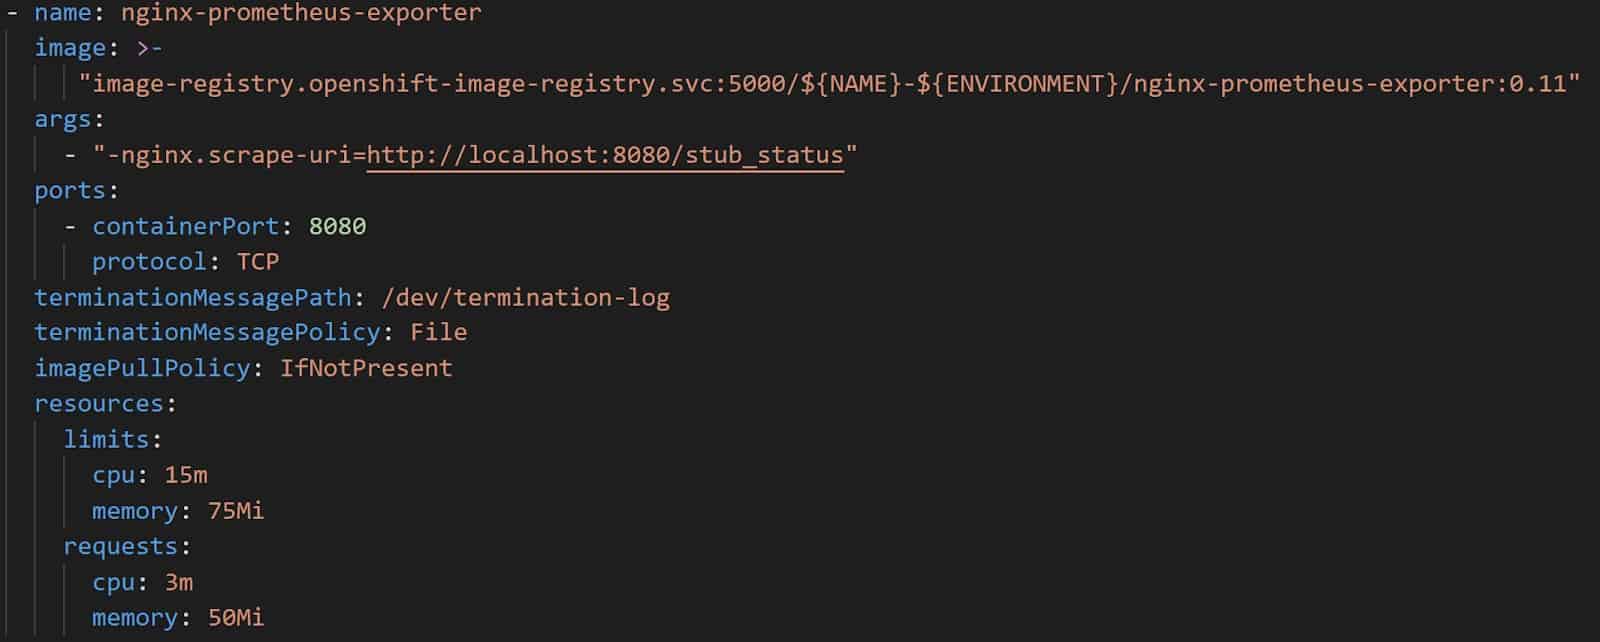
As shown in the screenshot, the only thing I had to pass along was the nginx.scrape-uri=http://localhost:8080/stub_status argument to args, which tells NGINX Prometheus Exporter to scrape the /stub_status endpoint. Once the pod was healthy, I was happy to see that NGINX Prometheus Exporter found the /stub_status endpoint and extracted a healthy list of key-value pairs. Then I used Prometheus to scrape the /metrics endpoint exposed by NGINX Prometheus Exporter on port 9113. A quick curl command within the pod showed me the following metrics: “curl -s localhost:9113/metrics | grep ^nginx”. Happy days!
$ curl -s localhost:9113/metrics | grep ^nginx
nginx_connections_accepted 11
nginx_connections_active 1
nginx_connections_handled 11
nginx_connections_reading 0
nginx_connections_waiting 2
nginx_connections_writing 1
nginx_http_requests_total 9001
nginx_up 1
Now, you might think “job done!” But I was concerned that both the /stub_status and /metrics endpoints were exposed and reachable by anyone who knew about them. I wanted only authorized people to see the metrics, because they can be used for malicious purposes and should be kept within the organization in general. The /metrics endpoint needed to be available from within the OpenShift cluster so I could use ServiceMonitor objects to define the endpoints where Prometheus can scrape metrics.
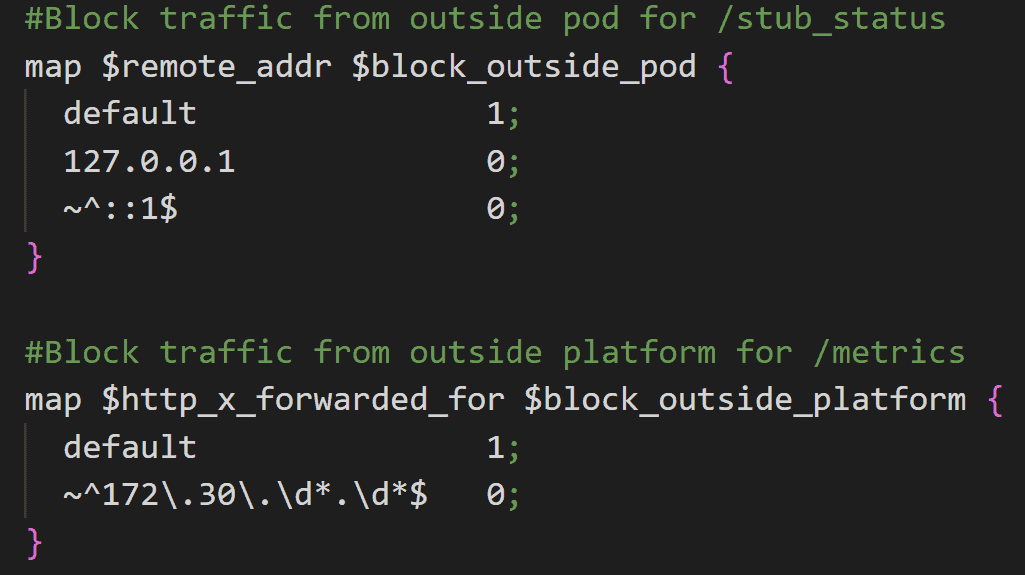
To keep things simple, I wanted to use existing NGINX features. First, I needed to differentiate the traffic destined for /stub_status and /metrics. I decided to use the NGINX Map module because it allows me to assign variable values based on the values of other variables. As shown in the following configuration snippet, I set variables based on the values of the $remote_addr or $http_x_forwarded_for variables for network traffic destined for this micro-front-end pod:
- For the /stub_status endpoint, I name the variable $block_outside_pod and only allow traffic from the IPv4 and IPv6 addresses for localhost.
- For the /metrics endpoint I name the variable $block_outside_platform and only allow traffic coming from the internal pod network within the OpenShift cluster (addresses in the 172.30/16 range).
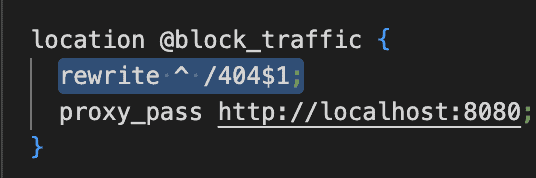
Once the map block sets the $remote_addr or $http_x_forwarded_for variable to either 0 or 1, I can use the variables in NGINX location blocks to route traffic. I use the if directive in the blocks for the /stub_status and /metrics endpoints to determine the value assigned to the $block_outside_pod and $block_outside_platform variables. If the value is 1, the NGINX location block returns error code 418. If the value is 0, the NGINX location block allows the traffic to pass through to either the /stub_status or the /metrics endpoint. With the error_page directive, I route the 418 messages to another NGINX location block, @block_traffic., where I manipulate the URL so any traffic hitting /stub_status or /metrics is processed according to the rewrite and proxy_pass directives.
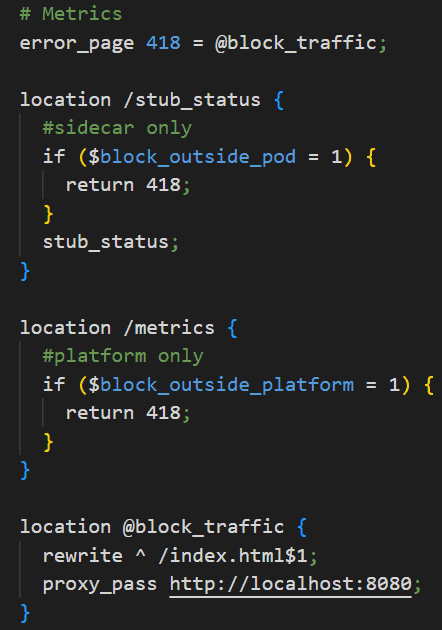
This means that when users request /stub_status or /metrics they are served the /index.html page. In this sample configuration, the user gets rerouted towards the root of the web server. But in the case of our micro front-end applications, we use this rewrite directive so that the request is routed to a /404 page on port 8080:
As a result, users see a pretty /404 page and stay within the context of the web application. In this setup, any end-user request that is trying to get to /stub_status or /metrics endpoints is “fooled” and rerouted – Nothing to see here 😉.
Now that we solved the problem of selectively allowing NGINX Prometheus Exporter to scrape the /stub_status endpoint and the platform-wide Prometheus server to scrape the /metrics endpoint, we can gather the information we need and do something with it. First, we create a ServiceMonitor object like that shown in the following screenshot, to scrape the /metrics endpoint exposed on port 9113 by the NGINX Prometheus Exporter container. (For more information about the ServiceMonitor object, see the OpenShift documentation).
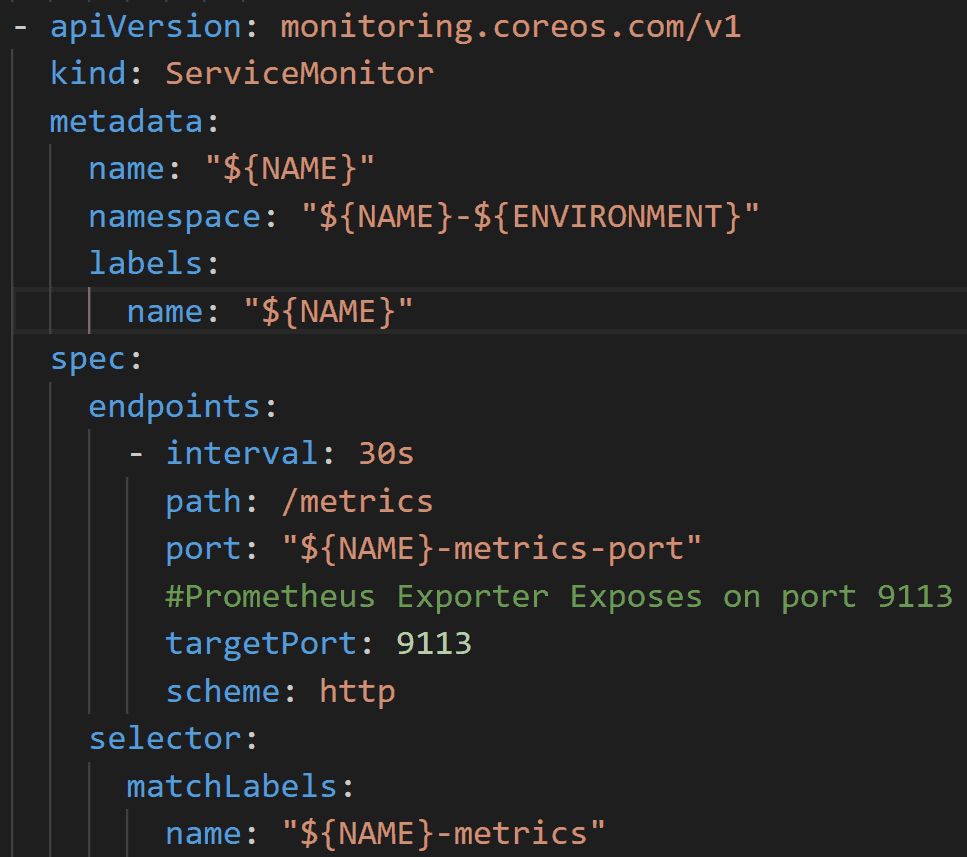
Prometheus now knows where to find the endpoints where it can gather the key-value pairs from the NGINX pods that serve content to our end users. In this example, Prometheus stores the information in its time-series database. NGINX Prometheus Exporter can scrape metrics from both NGINX Open Source and NGINX Plus, the commercial product from F5 NGINX. With NGINX Open Source you get fewer metrics than you do with NGINX Plus, but in most cases, NGINX Open Source provides more than enough metrics to get started.
Generating Alerts
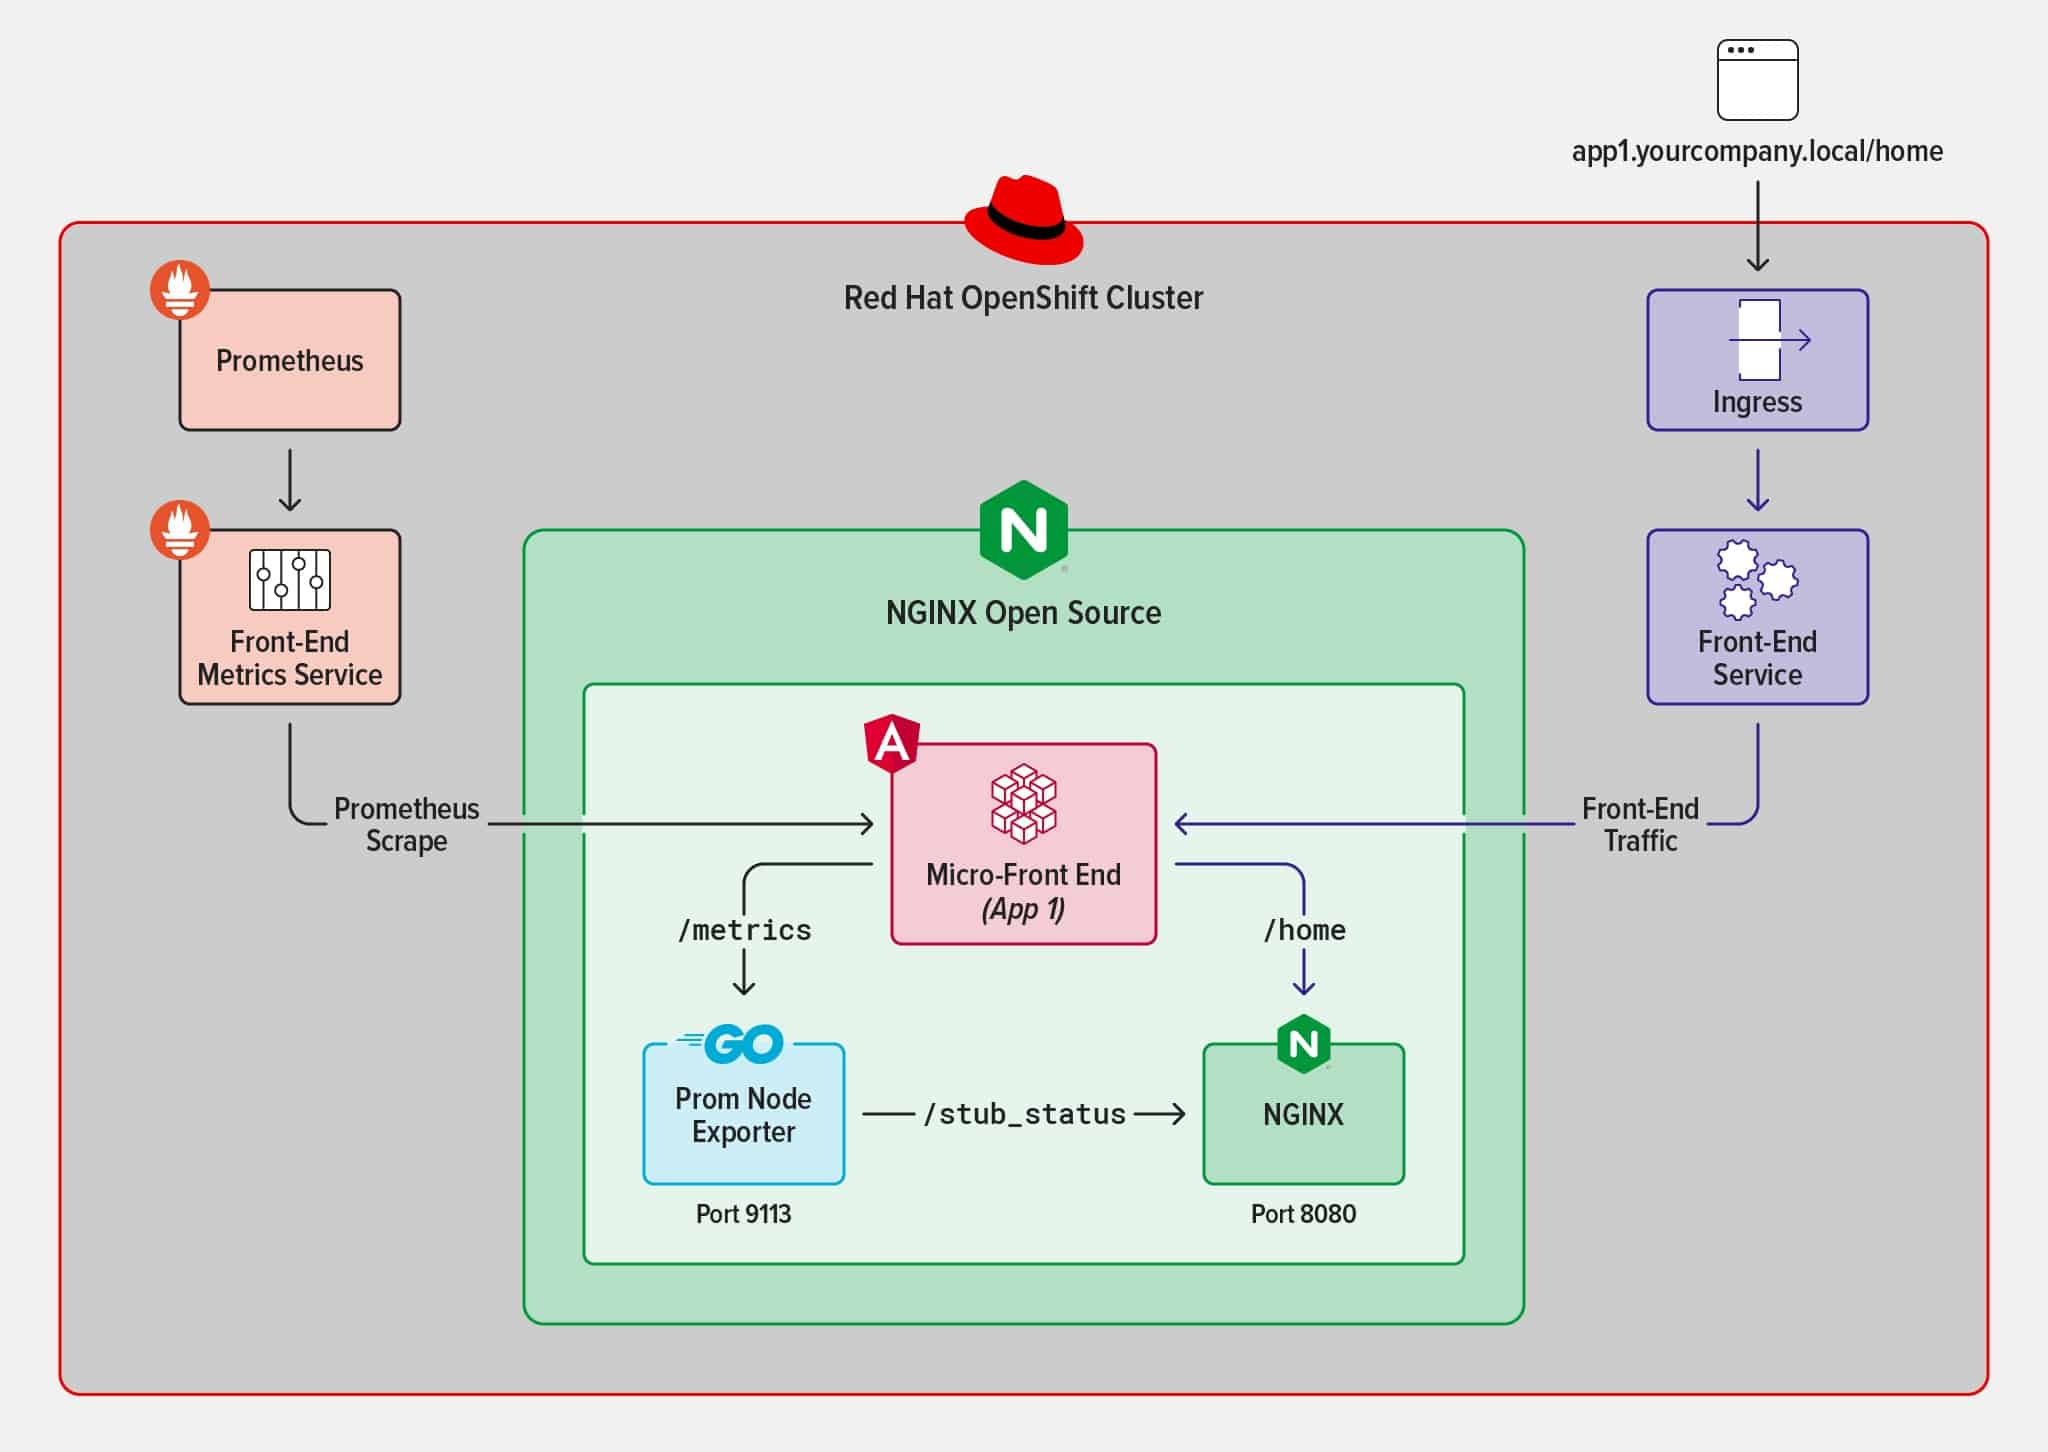
The following diagram illustrates our solution. We expose metrics, secure the metric endpoints to prevent anyone outside the OpenShift cluster from being able to gather them, and finally instrument Prometheus to scrape the metric endpoints.
Now we can finally reap what we have sown and use the metrics data for insights or alerting. With OpenShift, we define alerts in a YAML-formatted PrometheusRule file. The PrometheusRule instruments Prometheus to send alerts based on certain criteria using the Prometheus query language PromQL.
There are many types of alerts you can set up using Prometheus. I usually sort my alerts into two types:
Specific alerts – Target a single deployment, for example micro-front-end-app1.
Generic alerts – Target all deployments of the same type, by which I mean all of the applications on the OpenShift cluster that expose the same type of metrics. A sample type is all micro-front-end applications. Generic alerts scale well: any new application with the same type of metrics qualifies for these alerts.
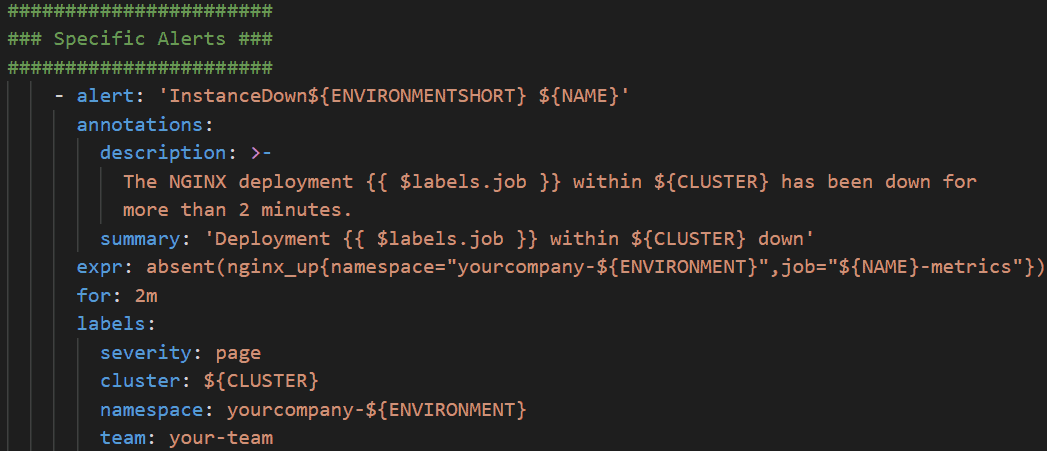
This example of a specific alert reports that a specific deployment is down within the OpenShift cluster.
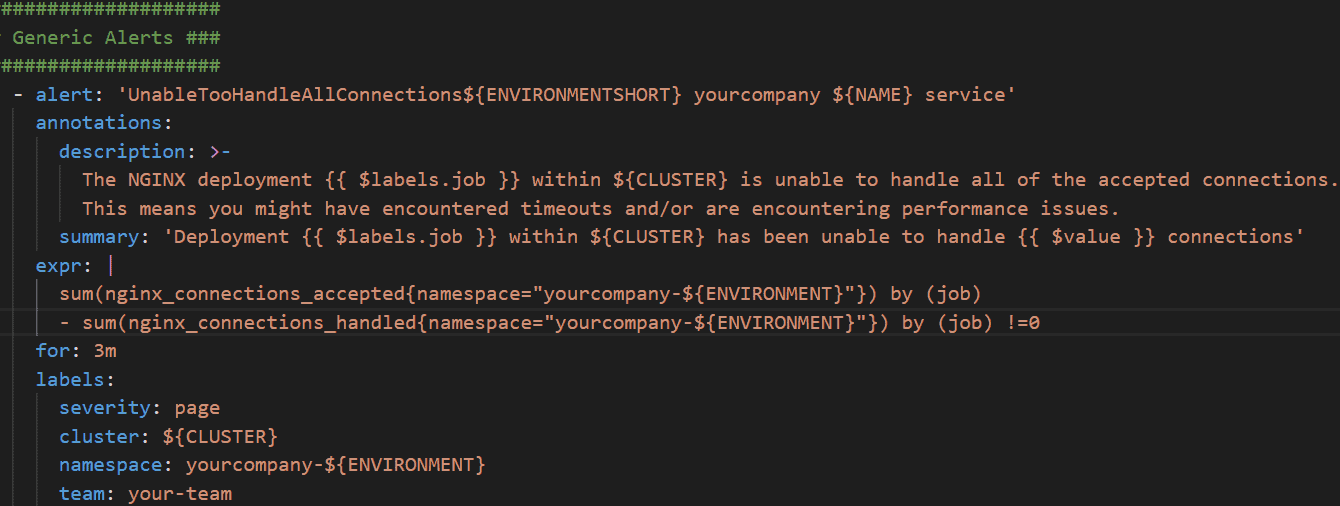
An example of a generic alert is one that measures all applications of the same type rather than targeting a specific application. The following alert checks whether NGINX is unable to handle any connections. The {{ $labels.job }} variable is used to report the specific application that is affected.
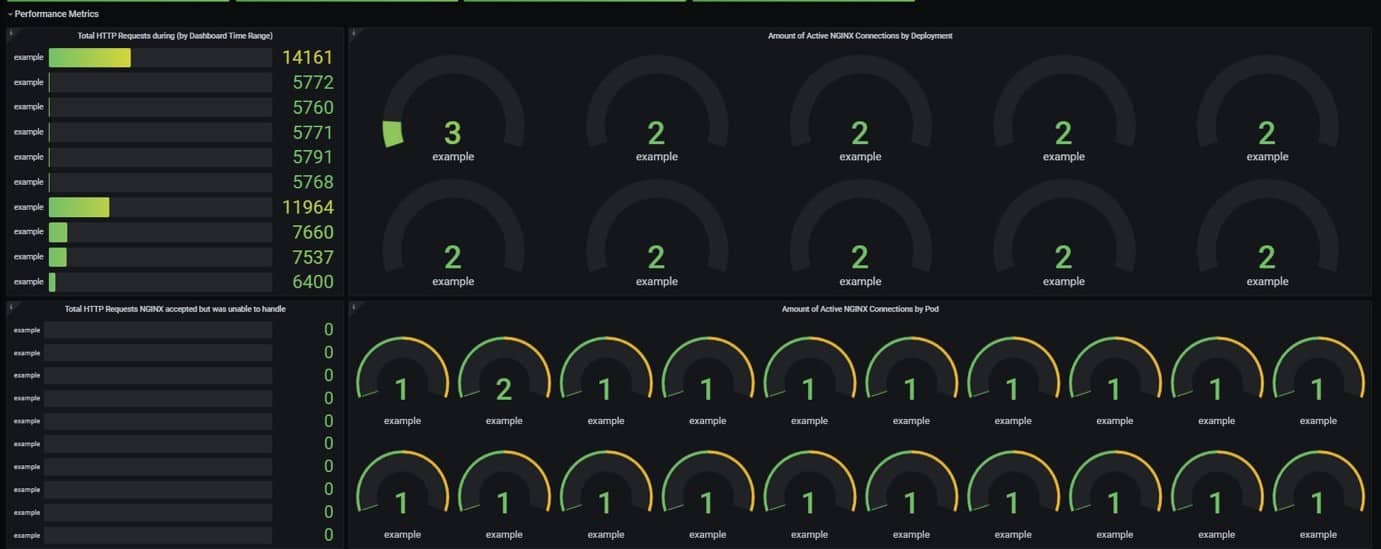
Alerts are a great way to avoid having to look at a dashboard the whole day to make sure everything is running smoothly. But dashboards are also a good thing to have when troubleshooting or analyzing your applications or microservices. My go-to application for visualizing metrics on dashboards is Grafana. When creating a Grafana dashboard with new metrics, I always start by exploring the data. I then create a simple dashboard to visualize the data, starting with the data surrounding the alerts I have set up. I do this because it allows me to, in one overview, see what is going on in the case of a production alert.
Make sure at least one other person reviews and understands a dashboard before you use it in production. Not everyone thinks the same way. This, in my experience, helps with the adoption of the dashboard within the team or organization.
Conclusion
In the future I hope that NGINX will allow for key-value metrics to be scraped directly from NGINX instead of having to rely on a side-container to re-format the information provided by NGINX Open Source or NGINX Plus into usable key-value pairs, ready to be scraped by Prometheus or any other time-series database solution. This would make it easier for NGINX users to gain further insights on their deployment. (Big hint to the NGINX product team!)
Thank you for reading. Please check out our Git repository (https://gitlab.com/hcs-company/hcs-nginx-container-deployment-reference) for everything you need to test out this setup on OpenShift, from base image to gathering metrics to creating a Grafana dashboard. Have fun! If you have any questions or want to know more, feel free to contact me!
About the author
Name: Benoit Schipper, Site Reliability Engineer
Mail: benoit.schipper@hcs-company.com
LinkedIn: https://www.linkedin.com/in/benoitschipper
Company: HCS-Company / Amsterdam – Netherlands