Guest post by Eran Kinsbruner, Lightrun
Why Troubleshooting Kubernetes Apps Is Tricky!
Apps that are deployed across Kubernetes clusters are a huge challenge to debug and analyze.
There are a couple of major reasons for this.
Firstly, access is limited. The nature of such environments prevents developers from easily gaining access to the live application from their local development environment (IDE). Gaining remote access to an app running in an EKS cluster requires port-forwarding from the developers machine to the app in the running pod, which is a security risk. Even identifying the pod in which the app is running against is a challenge on its own!
Secondly, tooling is limited. K8s environments are very basic and do not contain any debugging tools, meaning that developers are unable to debug production issues. They have to get around this problem by adding new layers of logs and telemetry to these remote apps until they’ve found the problem, redeploying the app each time. But this is costly and time-consuming!
So how can we access K8s infrastructure from a dev machine and ensure we have sufficient tooling in these remote workloads?
How Dynamic Logging Can Help
Developers can use dynamic logging to add new logs anywhere in the codebase on-demand and in real time – without writing new code or redeploying the application. They can add logs at runtime and focus only on what they need, when they need it.
And this is a cost-effective way of overcoming the above challenges, saving developer time and reducing costs.
Let’s explore the key features and benefits of dynamic logging.
Key Features Of Dynamic Logging
- Retroactive: devs can add dynamic logs on the fly eliminating the need to write them upfront for every eventuality
- Ephemeral: dynamic logs do not persist in the codebase, they have a lifetime at the end of which they automatically expire
- Conditional: they are written with very precise conditionality that is only relevant for the logs themselves, not for the entire application
- Granular: they can contain exactly the same information normal, static logs contain
- Performant: they only have a small performance impact when active and can be limited to cap and throttle the performance impact during execution
This enables developers to:
- Troubleshoot live applications: dynamically add logs anywhere in the application code in real time and on demand
- Visibility straight from IDE: view log metrics without having to switch away from code
- Instant, on-demand answers: developers can ask a question and get an instant answer without having to wait to redeploy the application
- Unlimited telemetry: add as many logs as needed until the issue is resolved (using simple or complex conditional statements)
- Log across instances: add logs to multiple instances of a running production service (microservices, big data workers) using tagging
- Integrate tooling: leverage a better-together workflow where developers can explore and inspect logs in both their local IDE as well as their log analysis tool of choice: DataDog, Splunk, Elastic
What Are The Benefits Of Dynamic Logging?
Dynamic logs offer a few key benefits over static logs that make them much more efficient in modern workflows in comparison to traditional logs.
They help developers in three main ways:
- Improved developer productivity: developers can get the answers they need right in their IDE without having to redeploy or stop their application, saving time and reducing the need to constantly switch context away from their code
- Slash logging costs: developers only add logs when and where they need them, massively reducing the volume of logs needed, along with associated ingestion, storage and analysis costs
- Reduce mean-time-to-recovery/between-failures (MTTR/MTBF) reduction: with access to real-time telemetry, developers can fix production issues much more quickly, ensuring business continuity and meeting production SLAs
Open Source leaders recognize the benefits of using dynamic logs alongside traditional static logs. One example for such a project is the sidekick solution.
Recently, we have seen an upsurge in open source and commercial solutions that are aiming to increase developer awareness around the cost of their code: FinOps, cloud computing cost optimization and so on. A great example of this recent activity is Kubecost, which provides real-time insights into K8s costs.
Similarly, dynamic logging is a great method to optimize costs and expedite K8s apps troubleshooting. However, with the help of modern cost observability tools like Kubecost, engineers are able to be more aware and accountable for the overall cost of their product development and empowered to act based on data to optimize these recurring costs.
Troubleshooting K8S Apps Using Dynamic Logging
Let’s have a look at how we can use dynamic logging to troubleshoot an app hosted on a K8s cluster and massively increase developer productivity.
We saw above how troubleshooting apps on K8s can really eat into developer productivity due to the difficulties of access and tooling.
However, when debugging K8S apps using a dynamic logging and instrumentation solution, developers are free from all the hassle like SSH into pods, port-forwarding from a local port to a pod’s port, permissions for kubectl, stopping and restarting the app and so on.
Instead, they can focus on the task at hand: reproducing the issue on the app that’s running remotely and quickly resolving it.
The two major limits—access and tooling—are instantly lifted.
How do you get set up?
There are various dynamic logging solutions available. With Lightrun—our own platform—developers can get going by choosing one of two simple methods:
- Either add the lightrun SDK to the docker container through a docker file configuration
- Or use a K8S operator that simply requires a creation of a dedicated namespace for the SDK, and than deploys the SDK to the created K8s namespace
- kubectl create namespace lightrun-operator
- $ kubectl create namespace lightrun-agent-test
- $ kubectl apply -f https://raw.githubusercontent.com/lightrun-platform/lightrun-k8s-operator/main/examples/deployment.yaml -n lightrun-agent-test
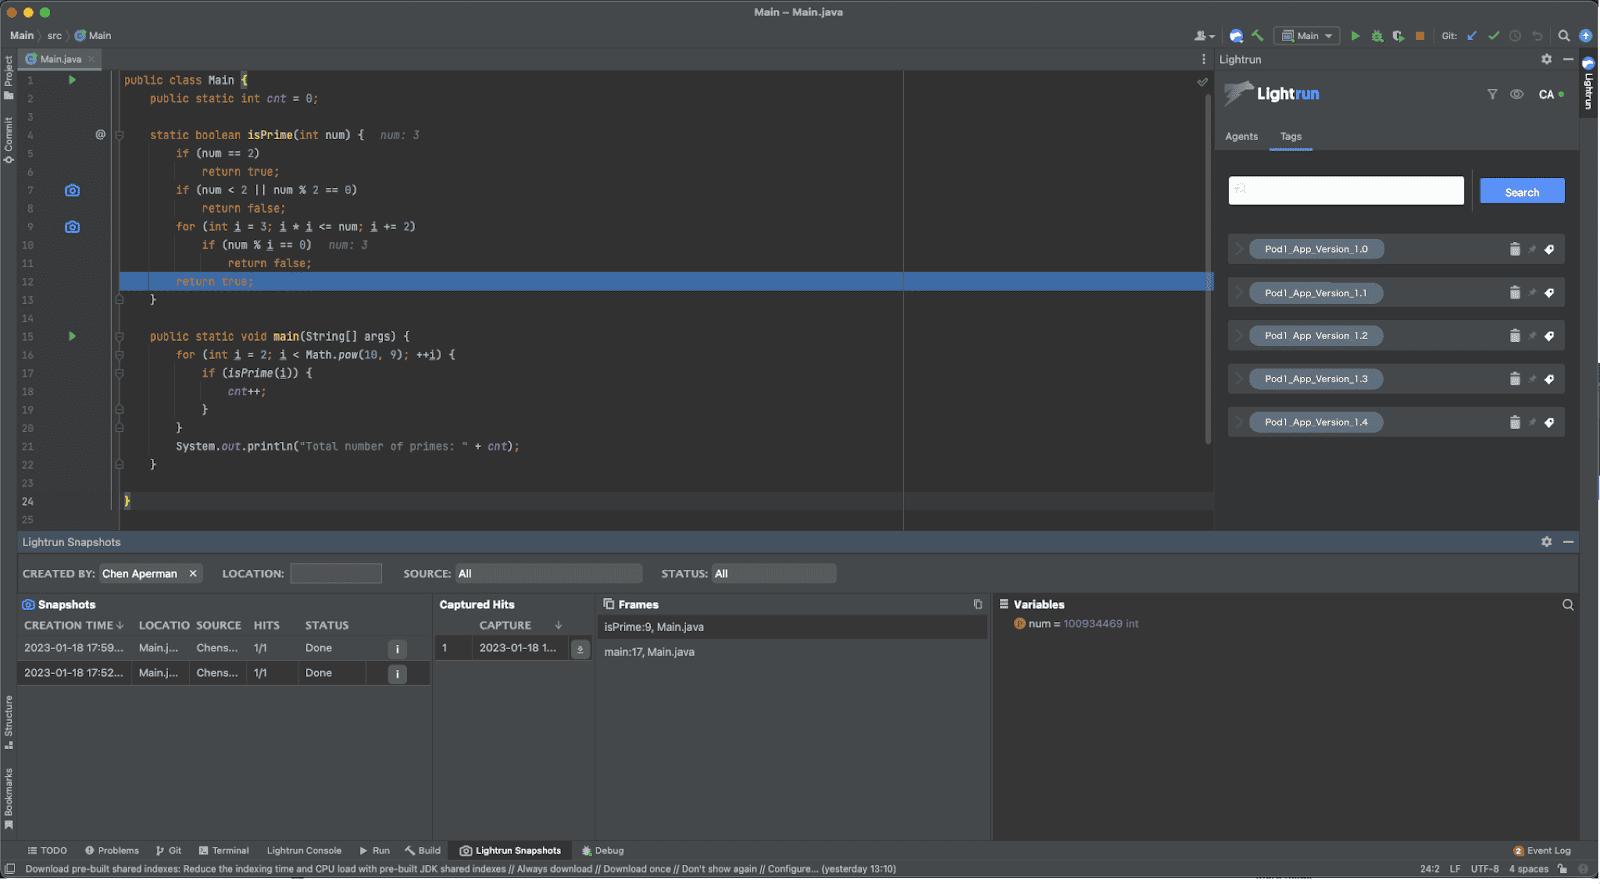
Once the K8s operator is deployed to the K8s environment or the Docker image is deployed, developers are able to troubleshoot their apps straight from their local IDE. This instantly removes the major challenges we outlined at the beginning around access and tooling.
They can tag a specific application instance on a remote pod or as many pods as they like and troubleshoot their apps from their local IDEs.
This helps us to cost-effectively debug our K8s app in a few key ways:
- Multiple instances: they can efficiently debug multiple instances within a running pod/node
- Overcome tooling limits: overcome the previously mentioned limitation of debugging images that do not contain any tools, shells, or infrastructure abilities for troubleshooting.
- Avoid dependencies: get around debugging with breakpoints that have dependencies on other running services to avoid cascading failures.
- No changing app state: preserve the application state while debugging the application from the outside and resolving the issues quickly.
- No loss of security or privacy: troubleshoot within EKS clusters with maximum security and privacy enforcements.
Bottom Line / Summary
In this blog, we have articulated the growing challenges around troubleshooting live applications across K8s clusters.
We highlighted the negative impact of these challenges on development productivity and MTTR, the cost of adding more and more static logs as part of debugging against a distributed workload, and the lack of tools that developers often have available for the job.
We then provided an introduction to dynamic logging as a way to overcome the challenges of debugging K8S apps, concluding with a real-life example of a solution that helps with the above challenges. Dynamic logging can be extremely powerful when used alongside other static logs and APM tools and can help close some of the existing gaps around debugging complex cloud-native applications.
About the author
Eran Kinsbruner, Global Head of Product Marketing at Lightrun and a best selling author.