
Guest post by Dave McAllister, Sr OSS Technical Evangelist at NGINX
Observability is key when running cloud‑native apps. In cloud native, app functionality emerges from the interaction between numerous microservices running in multiple locations. The loosely coupled nature of microservices apps potentially means each microservice reports on its activities in its own way. Without a tool that compiles and correlates that telemetry data, it’s hugely difficult – if not impossible – to track the processing of a request from start to finish.
Such granular, step-by-step tracking is crucial for troubleshooting and performance tuning. When searching for a multi‑functional observability tool, the team behind the NGINX Modern Apps Reference Architecture (MARA) project chose OpenTelemetry. In this blog, you’ll learn why OpenTelemetry is such a great asset for microservices architectures and how it’s changing the cloud-native application landscape.
OpenTelemetry Powers Observability 2.0
First announced at KubeCon 2019 in Barcelona, OpenTelemetry has attracted an enthusiastic set of contributors. Today, it continues to be a popular project at the Cloud Native Computing Foundation (CNCF). Its increasingly large number of contributors shows that OpenTelemetry has matured and is starting to cross the chasm between early adopters (who are willing to be ahead of the curve) and pragmatists (who desire mature products).
OpenTelemetry is focused on data – specifically, the data and data stream (telemetry) needed to best understand, troubleshoot, and improve our applications. Data is only useful if it can be aggregated, analyzed, and visualized at scale. While OpenTelemetry doesn’t provide direction for how to visualize the data, it lets us stop worrying about what data we can get and instead focus on what we can do with the data.
OpenTelemetry simplifies event correlation across data sources and across apps. This leads us to Observability 2.0 – a new benchmark for measuring application activity in the cloud. Because the data is automatically correlated, we’re no longer limited to just knowing whether the app is running or not. We can now understand the exact data pathway any request takes through our apps.
To make this possible, two functional aspects of OpenTelemetry are critical: distributed tracing and application intelligence.
Why Distributed Tracing Is Needed in Modern App Architectures
While distributed tracing has been around for years – going back to DTrace in Solaris – many changes in the last decade have increased the need for it. Using the Cynefin framework, we can highlight some of the changes and challenges we now face in modern applications:
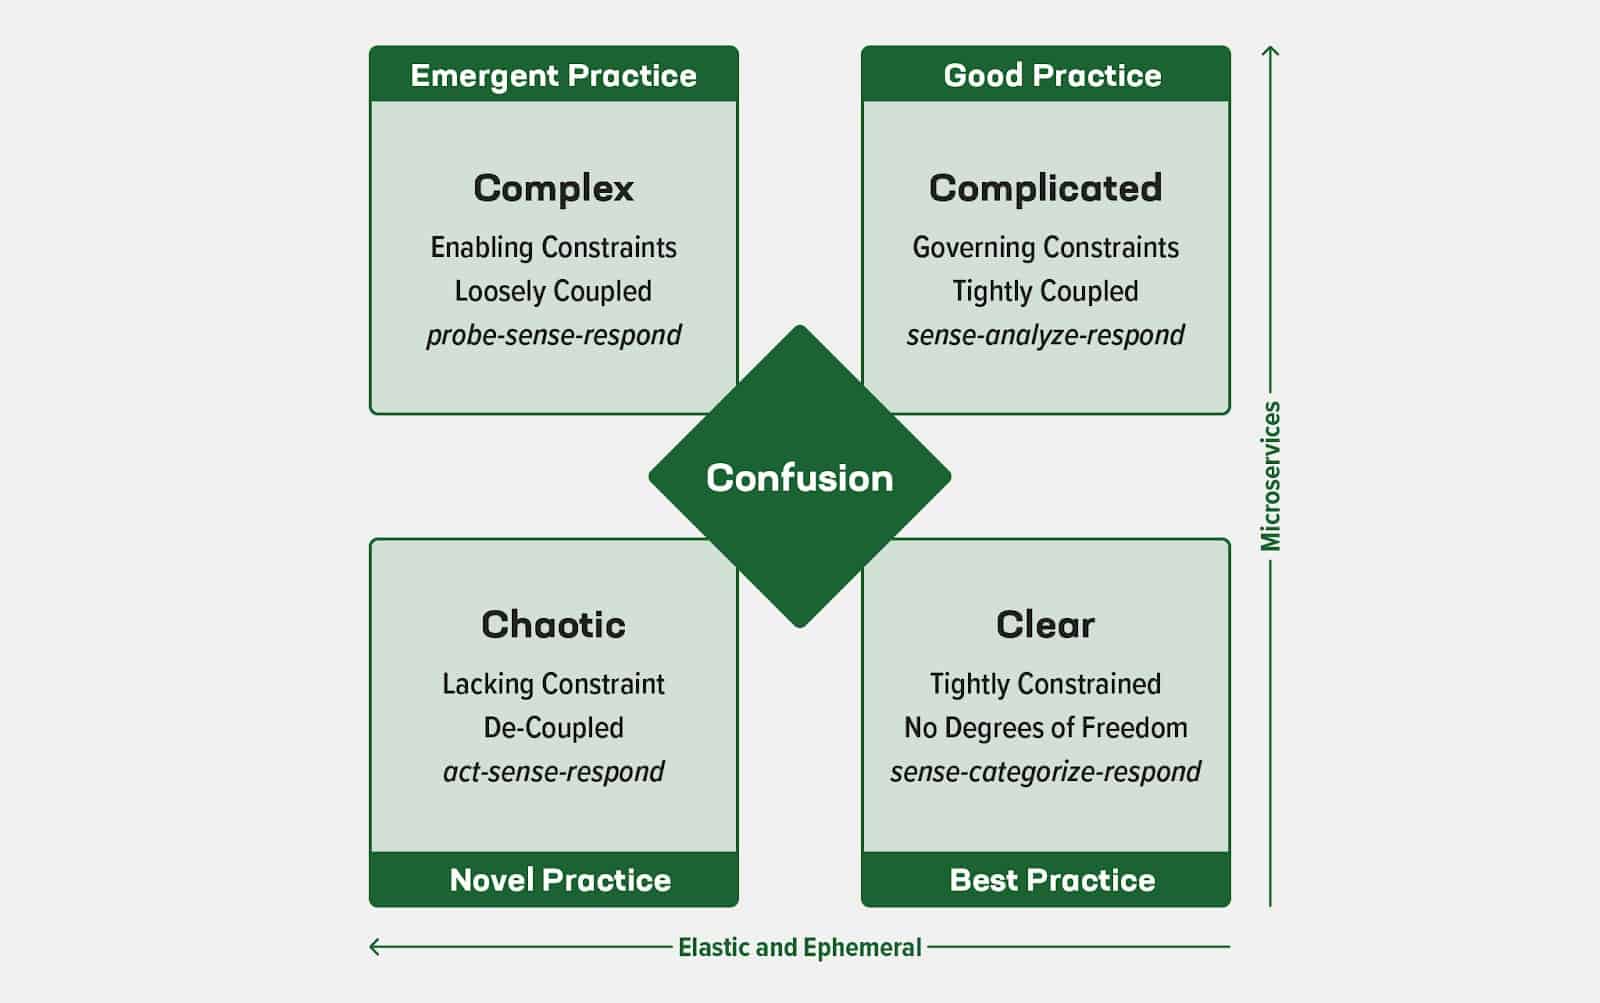
The Cynefin framework illustrates how we can change our practices as we move from simple to complex. The challenge is that our movement is along two separate paths, each with its own characteristics, and trying to take a shortcut directly from simple to complex often creates disorder and incomplete progress.
Let’s identify which elements create the paths in our modern app and cloud‑native journey. In our first path (the Y axis in the Cynefin diagram), we have modern apps which are usually microservices architectures, where each app does a specific job. In the second path (the X axis), our complicated environment is ephemeral, as microservice instances spin up and down in response to demand and are moved to different hosts in response to network issues.
We also have to consider the emergence and massive growth of cloud environments like Amazon Web Services (AWS), Microsoft Azure, and Google Cloud Platform (GCP). An advantage of such clouds is elastic response – expanding or contracting resources to match the current level of demand. With the added impact of container orchestration (most commonly using Kubernetes), we start seeing chaotic behavior as the number and location of resources change over time. (Even this relatively constrained view is chaotic, and elements like serverless functions can make it more so.)
In a modern architecture, with many separate parts producing the telemetry we need to monitor and maintain our apps, the data load is massive and complicated. Problems might not repeat reliably or be easy to elicit, as we do not fully control the infrastructure and communication pathways. We need technology that lets us track all activities and related elements, all the time, so we can understand and analyze our changing environments and identify not only recurrent problems but outliers as well as the associated application and network conditions.
That’s where OpenTelemetry comes in.
The Future of Distributed Tracing with OpenTelemetry
Distributed tracing enables tracking new metrics of many types, but most commonly those related to the number of requests per time unit, number of errors per time unit, and how long an aggregate request takes over that time unit.
In OpenTelemetry, all apps that generate metrics can send them to a common collection point via a telemetry (transfer) layer, which helps to align and correlate the data from the loosely coupled services generating it. This includes alignment with the underlying infrastructure. In short, with OpenTelemetry, it becomes easier to acquire and send highly detailed metrics.
OpenTelemetry can also help solve the problem of timestamp drift and skew, which makes it difficult to correlate events. OpenTelemetry assigns each request a TraceId, but data can still be impacted by drift and skew, which often appear in cloud‑native architectures. Drift and skew can result from reporting paths with varying durations or from lack of tight synchronization among the clocks on the various hosts. By tracking communication among components during traffic processing, distributed tracing allows OpenTelemetry to measure individual spans – the units of work and building blocks of a trace – without requiring deep instrumentation of the associated app.
Combining these three signals (categories of telemetry) enables us to correct issues and return our apps to production quality:
This is where we come back to Observability 2.0. The ability to obtain traces and immediately see which metrics correspond to which trace gives us a lot of power. For example, when the metrics indicate a problem, distributed tracing lets you go all the way back to the specific request that caused the initial issue and track progress through each step of the request fulfillment. Since our trace is made up of the spans in the order they occur, we can follow the request through each step in its journey. Understanding what happened, in what order – from the initial event to the indicated problem and all the way to the end result – allows us to target exactly “where” within our apps to focus our attention.
As simple as it may sound, the distributed tracing aspect of OpenTelemetry can provide us great insight into what our users are experiencing, being a proxy for request success and timing of execution. As a user, I care about my request. As a site reliability engineer (SRE), I care about the aggregated requests. As an application owner, I also care about tail latencies, which might translate into bad performance under certain conditions for small but significant groups of users. OpenTelemetry gives me all three, along with the ability to drill from aggregate into specifics, since it is designed to make all needed data available across all apps.
Application Intelligence with AI and ML
This new data stream from OpenTelemetry also allows us to be adaptive and automated in our development and operational response. With all this accrued data, we can make our application more intelligent and adaptive. And adaptive apps are just what they sound like: applications that automatically and intelligently adjust their behavior in reaction to changes in their environment.
By making telemetry data accessible and standard, OpenTelemetry makes the journey to adaptive apps that much easier. As different types of products start to output similar metrics, and by making use of the established semantic conventions within OpenTelemetry, it becomes easier to correlate their actions during request processing and feed that information to artificial intelligence (AI) and machine learning (ML) algorithms to enable applications and infrastructure to dynamically adapt.
Summary
Codifying telemetry is an obvious win for both the users of OpenTelemetry and for the applications that use it as their telemetry channel. Data can be collected from multiple sources and forwarded to any compatible aggregation and analysis tools. Additionally, the OpenTelemetry Collector frees vendors from the need to implement collectors themselves. Instead, they can focus on enhancing their code to perform meaningful analysis and take intelligent actions, and can build new tools to assist in understanding this complex and chaotic new world. In fact, the OpenTelemetry Collector – backed by the innovation of open source – is immensely capable of working with nearly every existing format while bridging the technology into the future.
With its focus on the principal classes of data we need to understand our applications, OpenTelemetry has made it possible for our apps to provide deeper insights into both the performance and issues of our complex modern application landscape. By correlating our data, aligning to semantic and standard conventions, OpenTelemetry makes the journey to modern applications more approachable.
As the project continues to mature and adoption continues to grow, OpenTelemetry is the clear approach to our deeper understanding. We are also hopeful OpenTelemetry will enable applying AI and ML techniques to unravel complexities, automate remediation, and illustrate ways cloud-native apps can be made even more adaptive and performant.