
Guest post originally published on InfluxData’s blog by Thinus Swart
Fluentd is an open source data collector capable of retrieving and receiving event data from several sources and then filtering, buffering, and routing data to different compatible destinations. It utilizes a plugin system to help you quickly set up specific inputs, apply any required filtering, and send data to your preferred data ingestion platform.
Fluentd supports multiple sources and destinations, and it can be deployed to multiple operating systems, including Windows, Linux, and macOS.
In this article, you’ll learn about Fluentd and how to install it on a Ubuntu Linux system, receive data from a syslog source, and then send the syslog event data to an InfluxDB instance.
Fluentd overview
In addition to supporting multiple sources and destinations, Fluentd has a few benefits that make it stand out from other data collection tools, including the following:
Unified logging layer
Fluentd endeavors to be the middleman for all your data sources and destinations. By treating all logs as JSON, Fluentd lets you apply the same rules to different data sources and make sure that the result is readable by your destination system, whether that system is a MongoDB instance or an OpenSearch cluster.
It is also horizontally scalable and has been used in organizations to collect data from thousands of machines, so you should be able to safely implement it as the centralized log event routing engine for your organization.
Source and destination agnostic
The unified logging layer is enabled because Fluentd supports receiving data from dozens of different sources. Those same source events can then be filtered, formatted, modified, and sent to one of the dozens of supported destinations.
This is highlighted by the robust plugin system that Fluentd uses to receive, transform, and send data to multiple destination types. These plugins support everything from specific tools like NGINX to general network protocols like MQTT or HTTP.
Low memory footprint
Fluentd has been developed using a combination of the C programming language and Ruby, which in turn enables it to use very little memory (about 40 MB) when it’s installed and run on a system.
Fluentd claims that in its default configuration, a Fluentd instance should be able to handle about 13,000 events/sec/core. It also has a lightweight event forwarder version called Fluent Bit, in case your memory requirements are smaller than 40 MB.
Strong community
When choosing any tool you want to know if it will be supported long term. Fluentd is a graduated CNCF project with many companies contributing and using Fluentd in production. The Fluent Bit component of the project recently crossed 3 billion downloads and growth is actually accelerating rapidly, with daily downloads going from around 3 million per day at the start of 2022 to around 14 million per day in October of that year.
All this is simply to show that you can rest easy if you choose to use Fluentd as part of your application’s architecture.
InfluxDB overview
InfluxDB is an open source time series database purpose-built for storing and querying time series data.
Some advantages of using InfluxDB compared to a more general database for time series data:
- Performance optimized for writing large volumes of data and querying ranges of data based on timestamp
- Improved data compression due to column oriented storage which lowers storage costs
- Built-in tools for working with time series data that improve developer productivity
- Flexible deployment options that can be optimized for edge computing and IoT environments, hybrid architectures, or pure cloud deployments
Implementing Fluentd with InfluxDB
In this tutorial, you’ll be making use of a cloud-based instance of InfluxDB to simplify setting up an InfluxDB database. You could set up an open source instance of InfluxDB on your local desktop or laptop, but that won’t be the focus of this tutorial.
You can view the contents of the configuration files in this GitHub repository.
Create an InfluxDB Cloud instance
To begin, you need to create an InfluxDB Cloud instance. If you don’t already have one, go ahead and sign up for one on InfluxDB’s website:
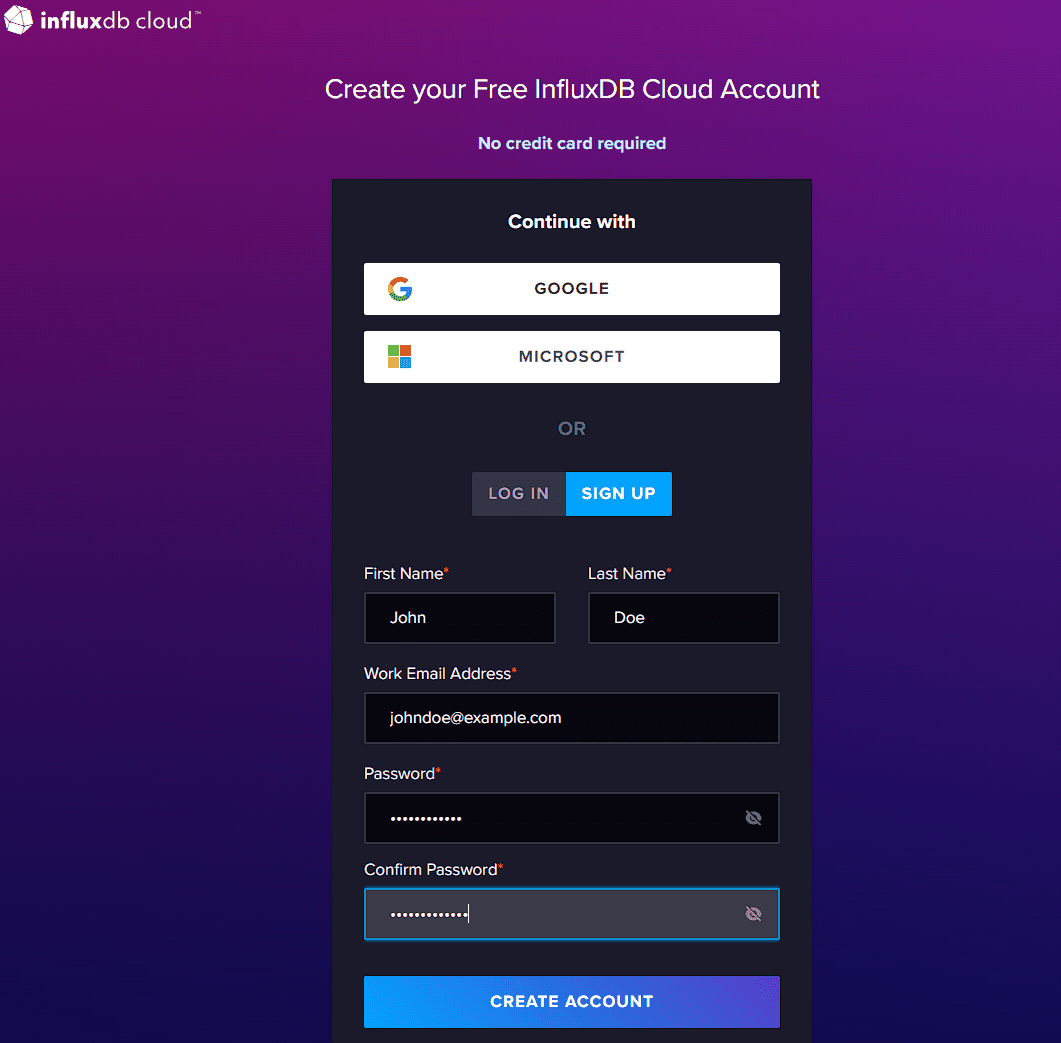
Once you’ve filled in the details and entered a secure password, you’ll be asked to choose where you want to store your data:
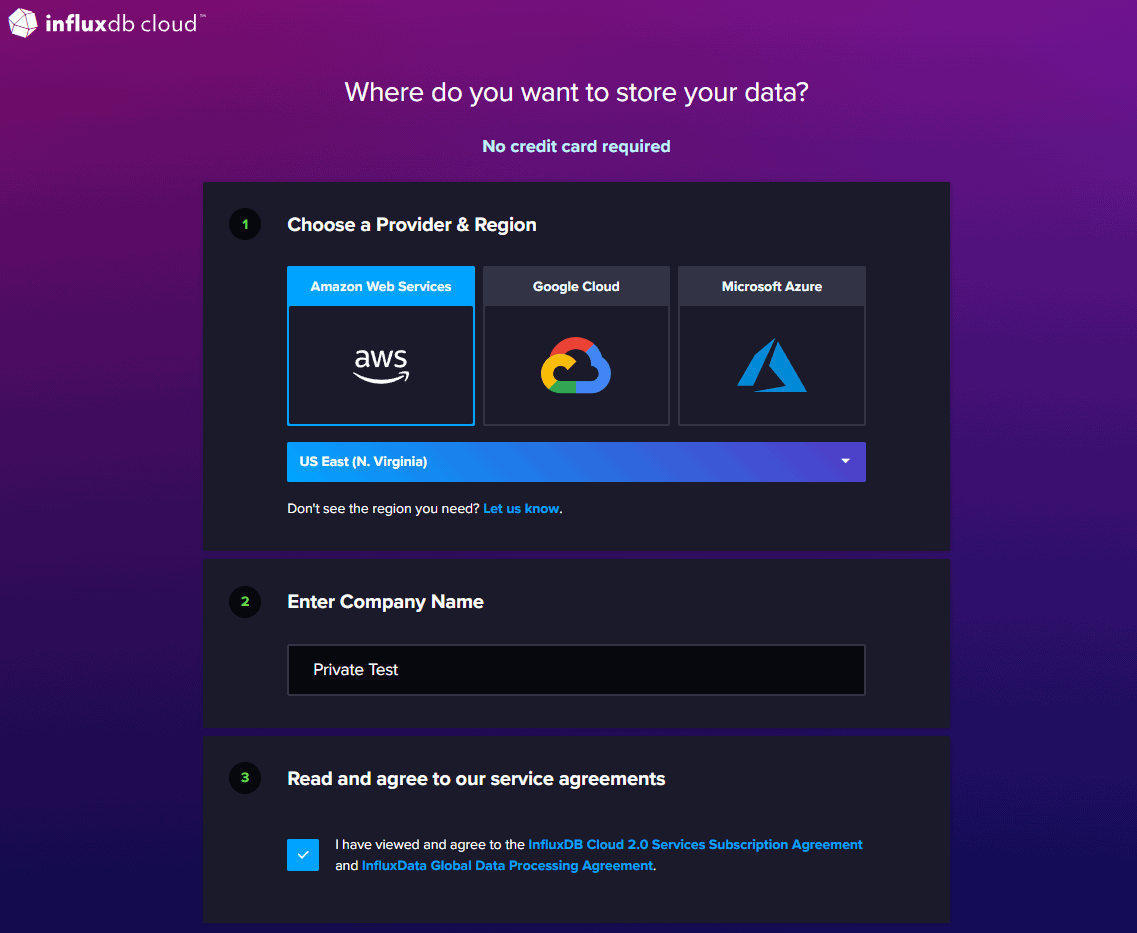
When choosing a provider and region, try and find a combination that is the closest to you geographically. Take note of which region and provider you selected, as you will need this information later.
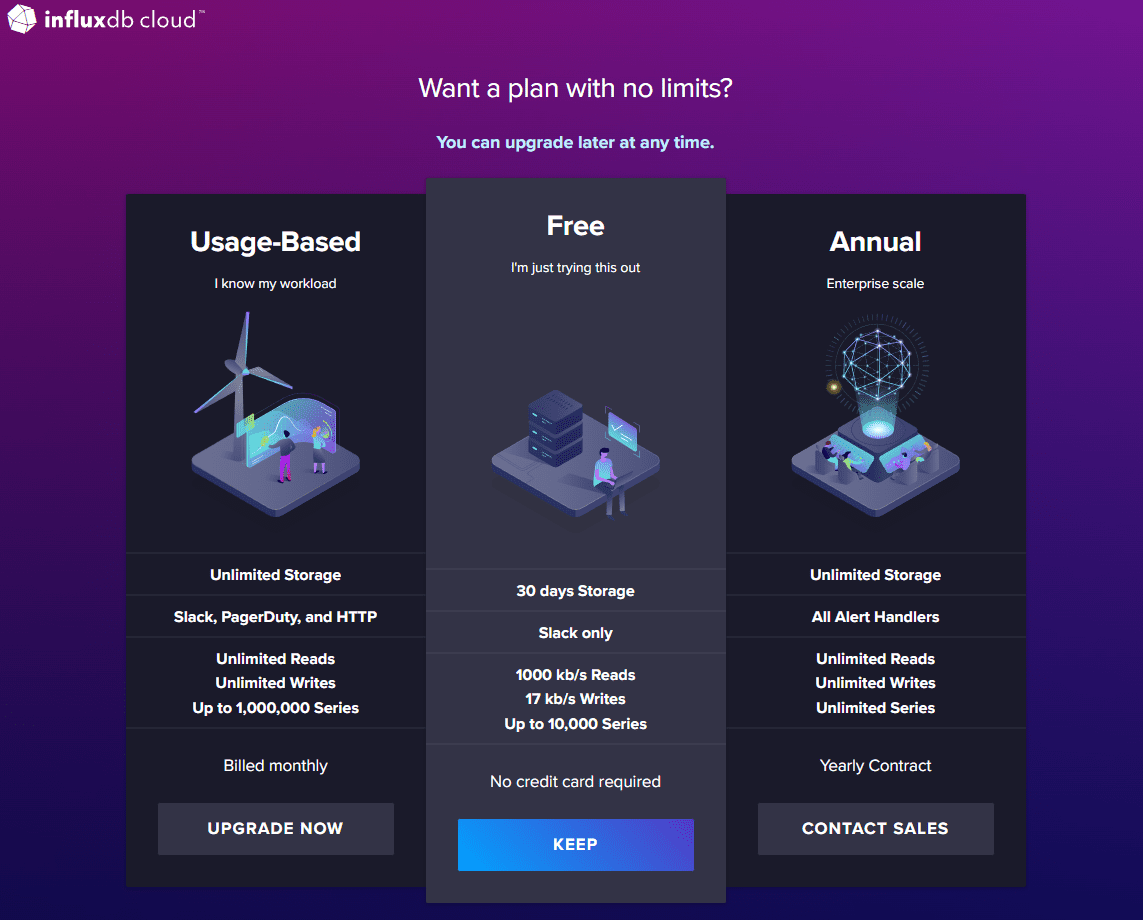
Next, you’ll be asked which plan you want to sign up for. For the purpose of this tutorial, the free plan is sufficient:
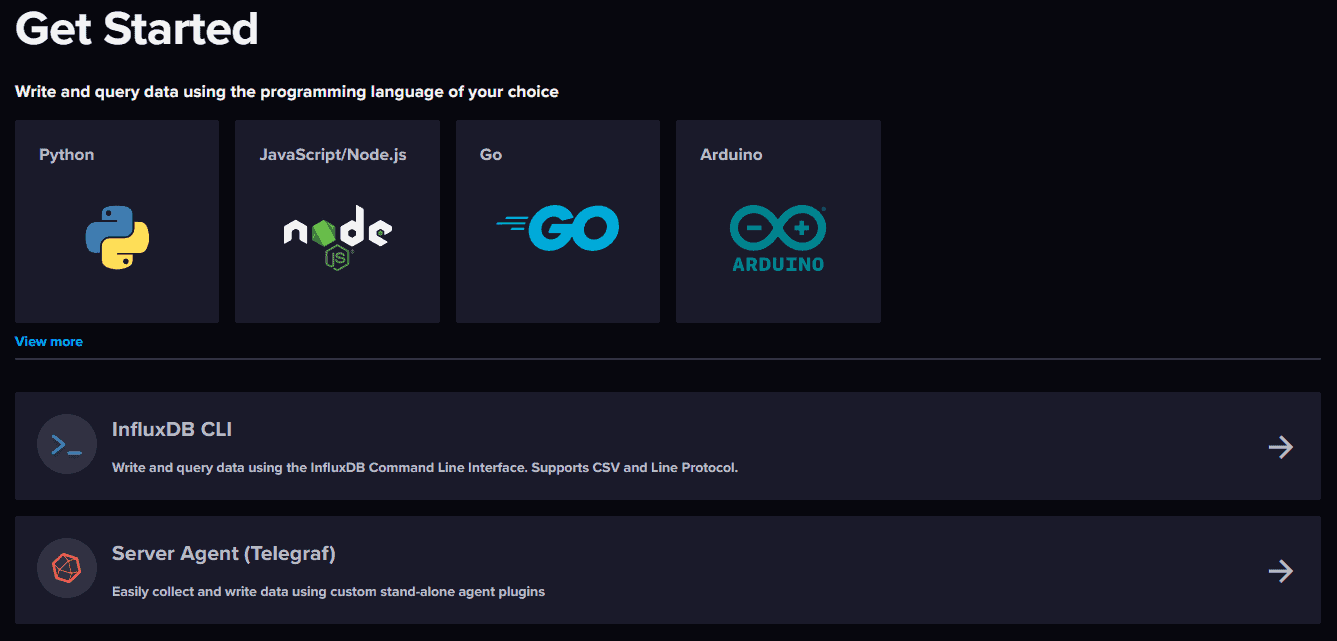
Once you’ve selected your plan, you’ll be redirected to your InfluxDB Cloud instance’s dashboard. From here, you’ll be able to monitor your data sources, create dashboards to visualize your data, and more:
Create a bucket
After reviewing your dashboard, it’s time to set up a bucket where you will store your data. A bucket is a logical store, like a database, where you store events of a similar nature. Often, individuals choose to split different application logs into different buckets. On the free tier, you’re allowed a total of two buckets.
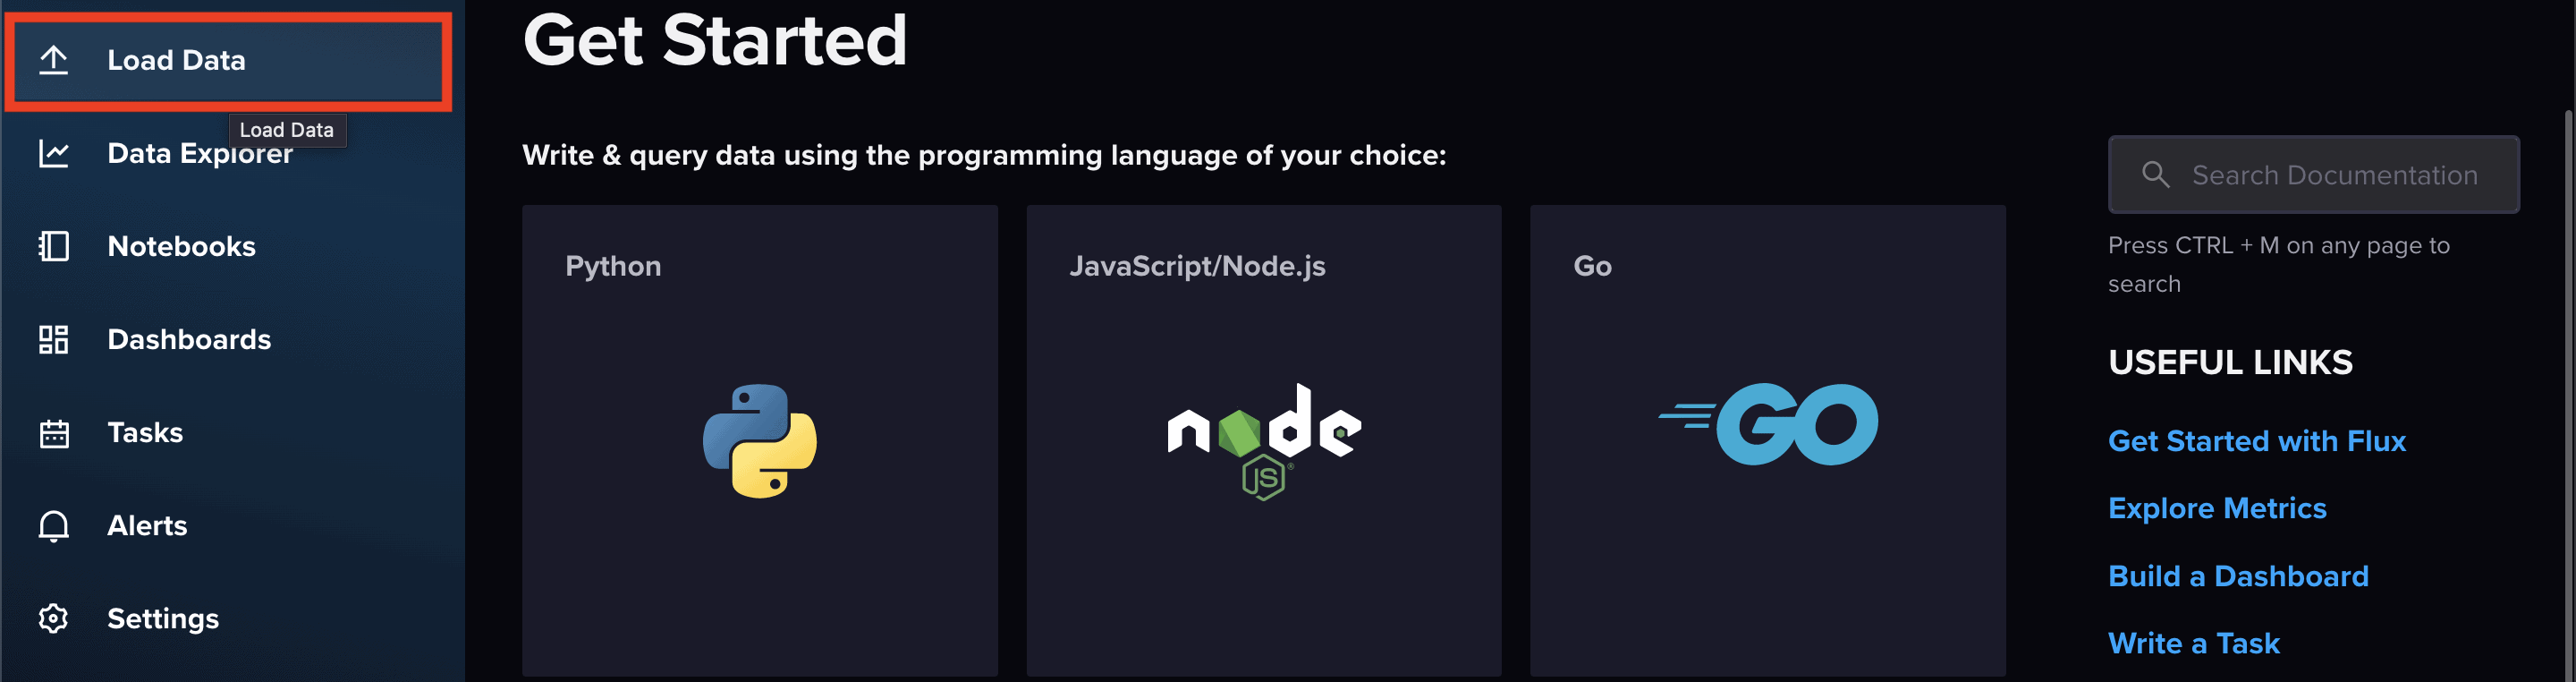
Now you need to create a bucket that will hold your syslog data. Begin by selecting Load Data on the left navigation menu:
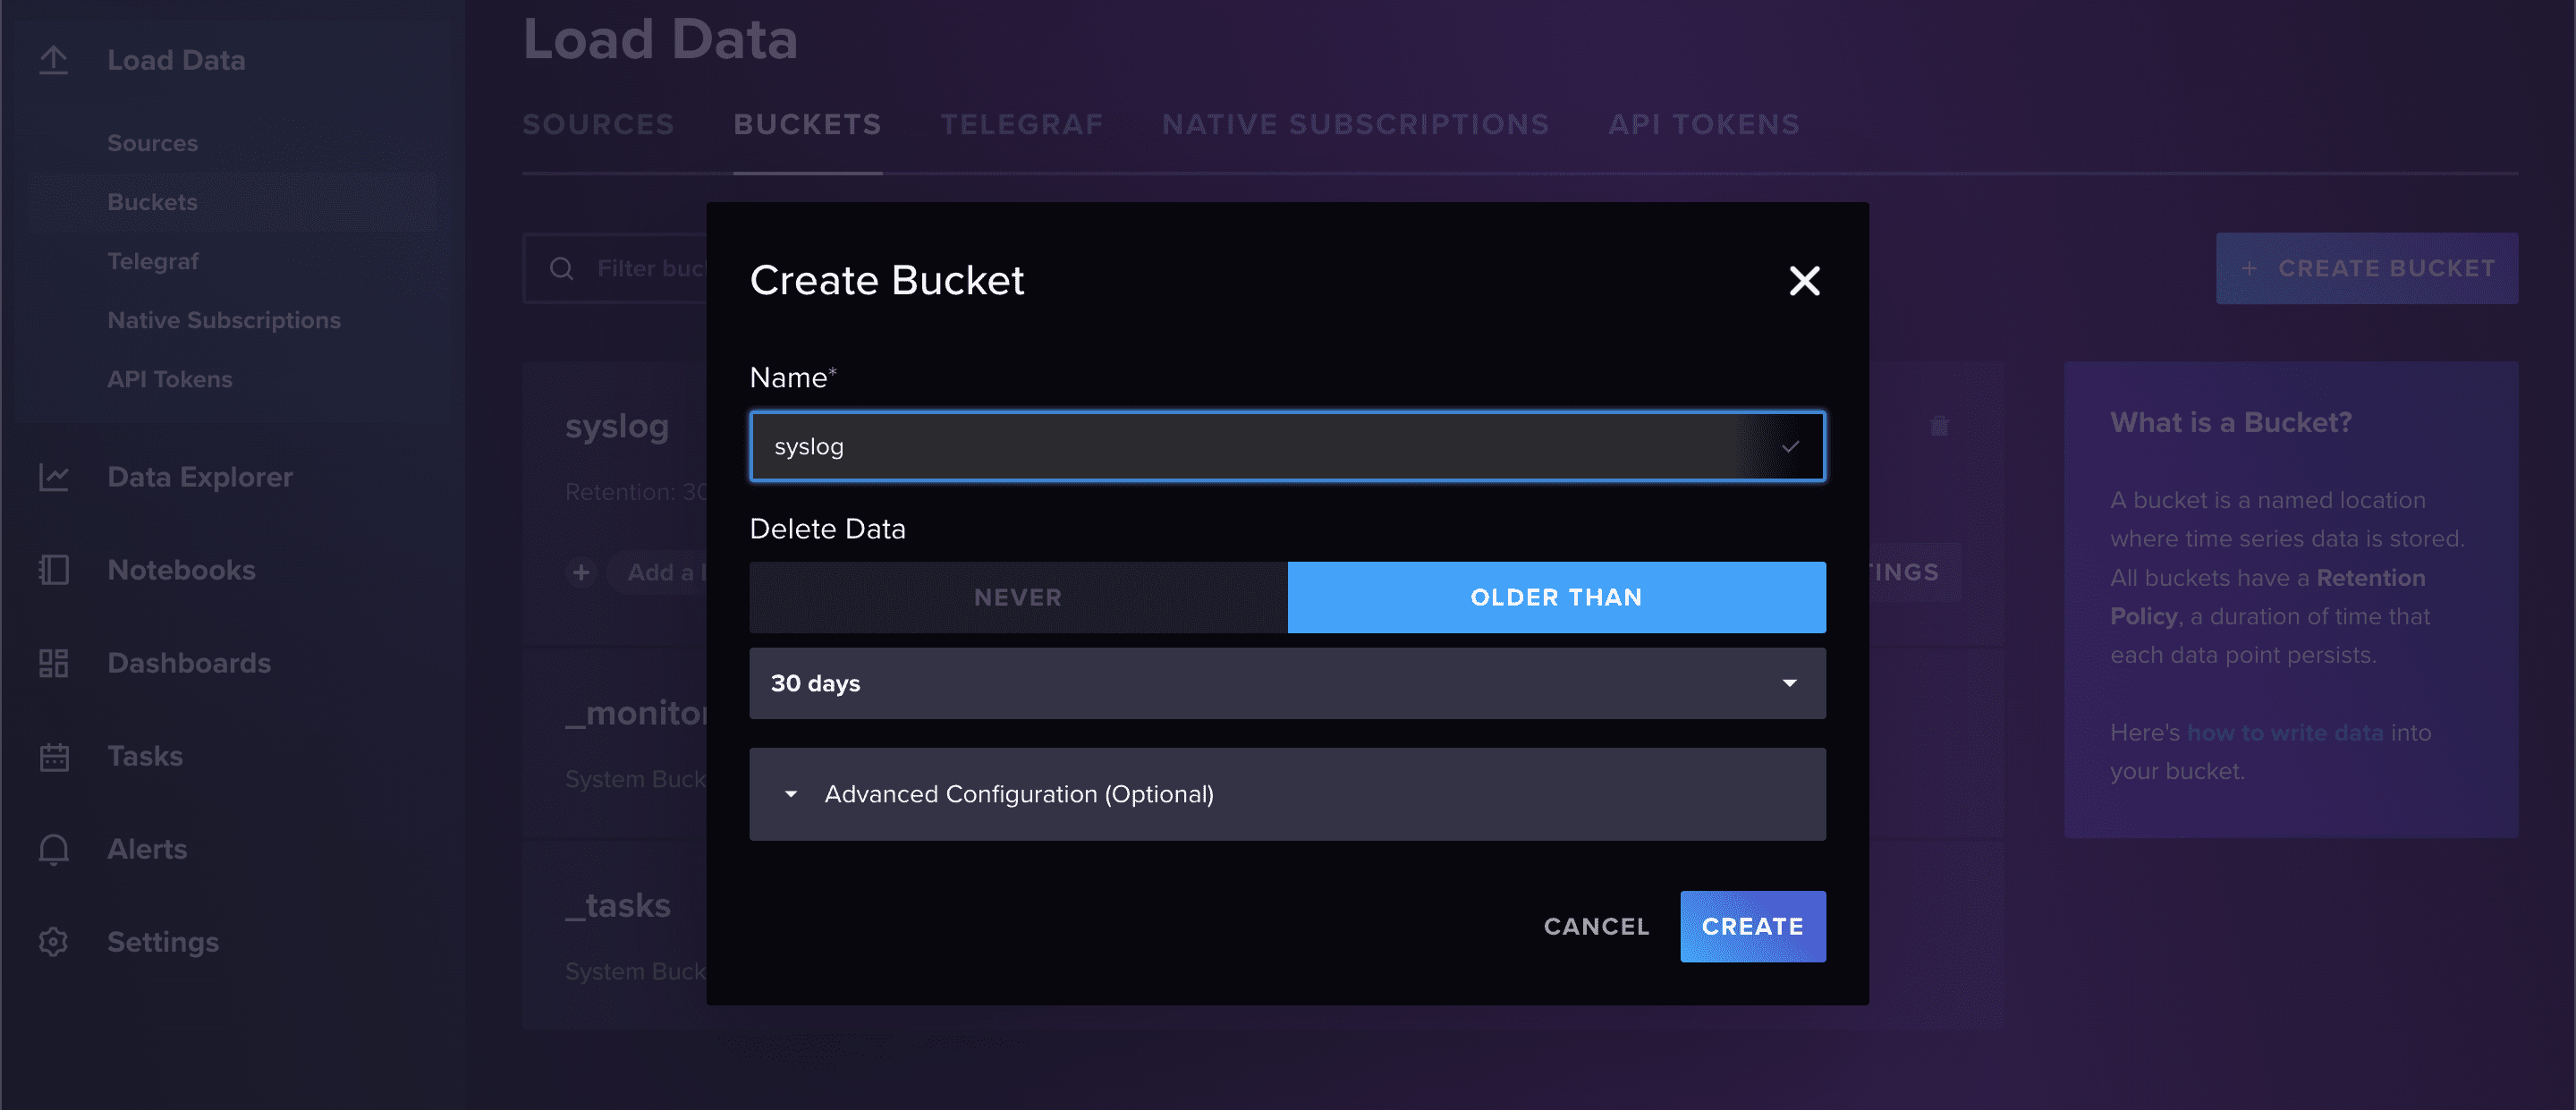
Then select Buckets > CREATE BUCKET:

Give your bucket a name and set a retention period (the default of thirty days is fine). Select CREATE when you’re done:
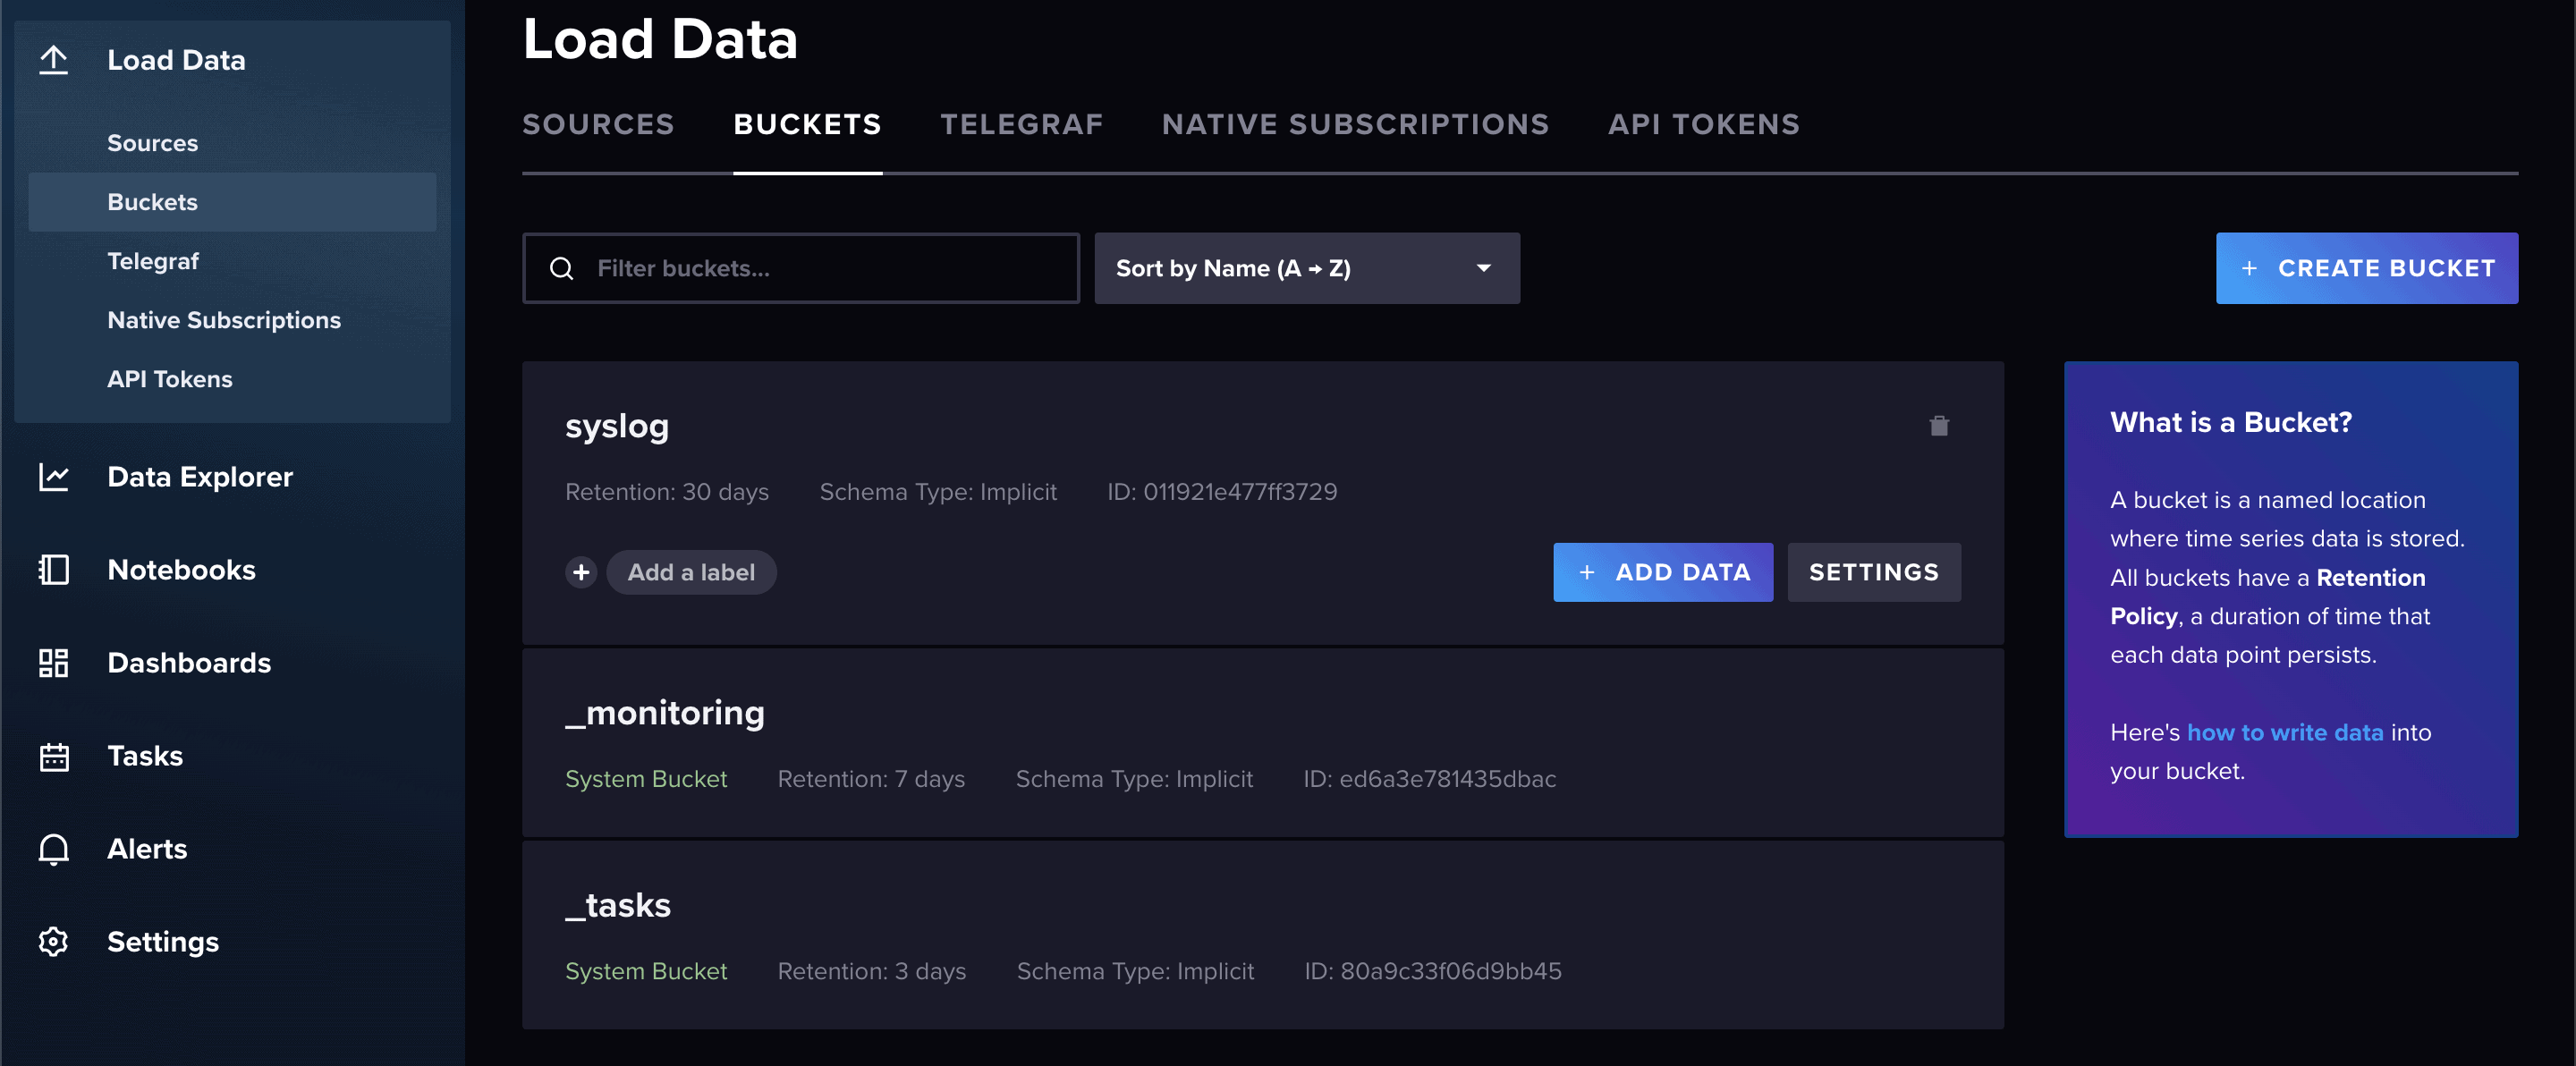
Now you should see your newly created bucket listed with the other two built-in system buckets:
Generate an API token
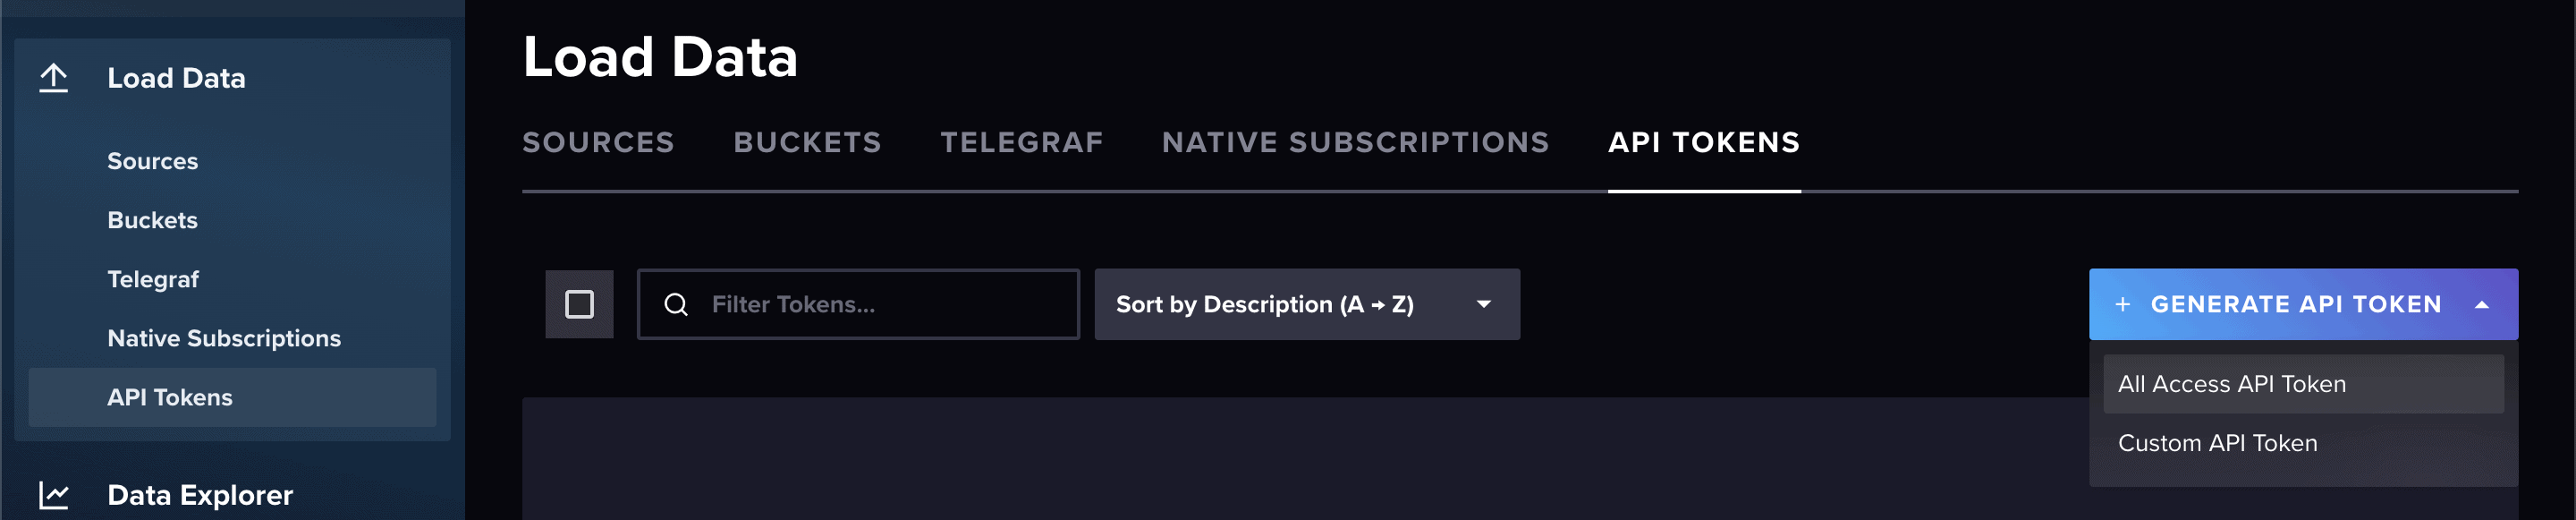
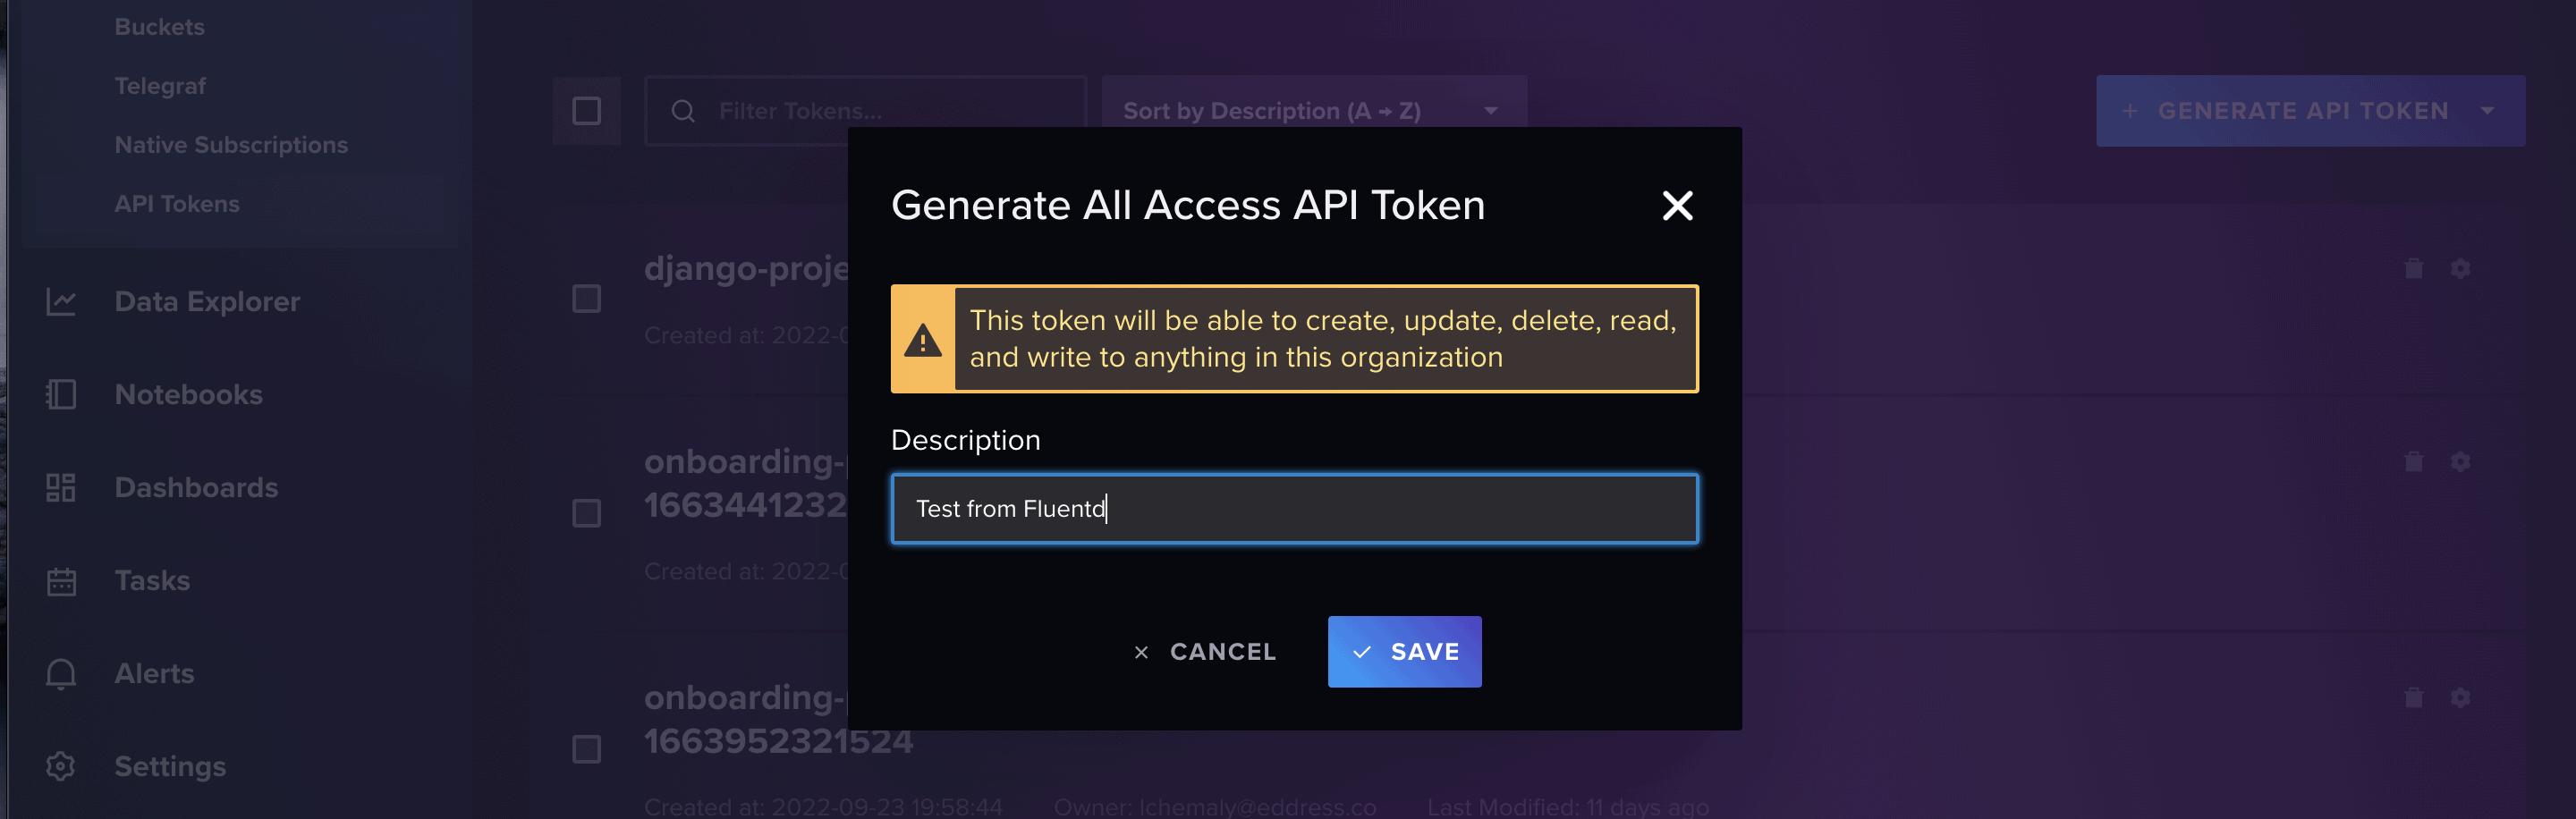
Next, you need to create an API token so that Fluentd can authenticate and send data to your newly created bucket. Navigate to the Load Data screen again and click on API TOKENS > GENERATE API TOKEN. Then you need to select All Access API Token:
Please note: In a production environment, you want to be more careful with your configuration, following the principle of least privilege.
Add a description for your token, and then click SAVE:
The final screen will display your token. Copy and paste the token somewhere safe before continuing:

Remember that you don’t have to sign up for the cloud-based instance of InfluxDB. If you’re comfortable installing your own instance on your own machine, go ahead and do that. The rest of the instructions shouldn’t differ too much if you decide to install a local copy of InfluxDB.
Install and configure Fluentd
Using the RubyGems installation method should work on almost any mainstream Linux distribution. RubyGems is Ruby’s package manager and a standard way of distributing Ruby libraries.
The following commands are all entered into the terminal application of your choice. In Ubuntu, for example, most people would use the GNOME Terminal that comes installed with the operating system.
Before continuing, you need to have Ruby installed on your OS. If, for some reason, you don’t have it installed already, you can follow these instructions to install it.
Additionally, you’ll also need the ruby-dev package available:
sudo apt install ruby ruby-devAfter installing Ruby, use it to install the Fluentd agent with this command:
gem install fluentd --no-doc --user-installThis will install the Fluentd agent as a Ruby gem for your current user.
Depending on your shell, you may need to add the RubyGems directory to your path so that the executables can be run from anywhere:
export PATH="~/.local/share/gem/ruby/3.0.0/bin:$PATH"Make sure that the version of Ruby you specify in the $PATH variable corresponds to the version of Ruby installed on your system. If you have a new Ubuntu system, Ruby 3.0 will need to be installed.
Now you need to configure the Fluentd agent with a default configuration in your user’s home directory and then test to make sure it’s working:
fluentd --setup ~/fluent
fluentd -c ~/fluent/fluent.conf -vv &
echo '{"json":"message"}' | fluent-cat debug.test
The previous commands will set up Fluentd with a clean config inside a ./fluent directory. Then they’ll run Fluentd in daemon mode using the bare configuration file and send a test message to the Fluentd daemon.
If you get an error, then that means there’s still something wrong with your $PATH variable.
If the configuration goes well, you should see the following test message in the console:
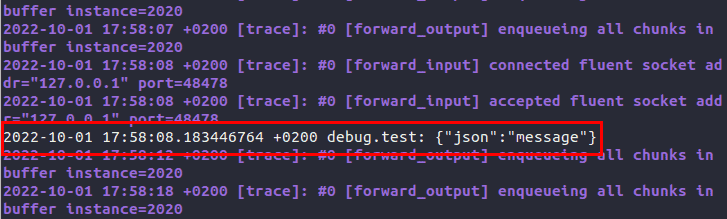
You may notice that all sorts of messages from the daemon are flooding your console. You can stop that using CTRL-C or killall fluentd from another terminal process. The daemon will exit gracefully, and you can continue setting everything up.
Now you need to grab the InfluxDB output plug-in. Conveniently, Fluentd has its own RubyGems-like system called fluent-gem for managing and downloading plug-ins. You need v2 of the InfluxDB plug-in since your hosted InfluxDB instance uses the newer version.
Install the plug-in with the following command:
fluent-gem install influxdb-plugin-fluent --user-installThen configure Fluentd with a clean configuration so it will only do what you need it to do. Edit your .conf file using your text editor of choice. The example is using vi:
vi ~/fluent/fluent.confReplace the contents of the file with the following:
| <source> | |
| @type syslog | |
| port 41514 | |
| source_address_key src_ip | |
| facility_key facility | |
| severity_key severity | |
| <parse> | |
| message_format auto | |
| </parse> | |
| tag influxdb2 | |
| </source> | |
| <match influxdb2.*.*> | |
| @type influxdb2 | |
| url https://westeurope-1.azure.cloud2.influxdata.com | |
| org 1234abcd4567ef00 | |
| token your-api-token-you-created-earlier | |
| bucket syslog | |
| flush_interval 30s | |
| </match> |
view rawfluent.txt hosted with ❤ by GitHub
Here, the <source> section sets up a listener on UDP port 41514. You can use any high-numbered available port in your config.
Then a field called source_address_key is added and gets the value of the source IP that sent the syslog event. Two more fields called facility_key and severity_key are added, and those values are retrieved from the syslog message.
Next, the <parse> section determines which RFC specification the syslog message is in and parses it accordingly. Finally, there’s an internal tag called influxdb2 so that you can target it later in the <match> section.
In the <match> section, the section header matches all events tagged with influxdb2.
@type tells Fluentd which plug-in to use, and the url can vary depending on where you selected to host your instance when you first set up your InfluxDB account. Take a look at the InfluxDB docs to get the correct URL for your instance.
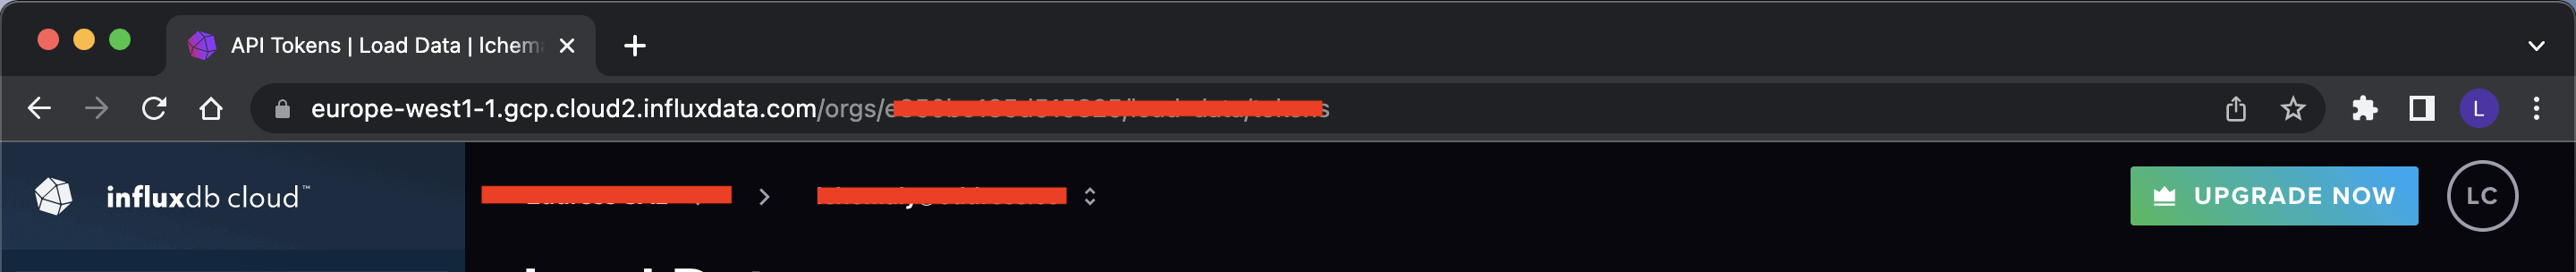
The org is the organization that you set up earlier. However, the value is not a string. If you look at the URL for your InfluxDB Cloud instance, the sixteen-character code behind .../orgs/ in the URL is your organization code that you need to put into the configuration file:
Then the token is the token you created earlier in the InfluxDB Cloud frontend, and the bucket value references the bucket you created in the frontend. Finally, flush_interval 30s tells Fluentd that it should buffer events but send whatever it has in the buffer every thirty seconds.
Now you need to save this file and then start Fluentd in daemon mode using the new fluentd -c ./fluent/fluent.conf -vv configuration file. Then Fluentd will set up a listener on the port you specified and make a connection to the InfluxDB Cloud instance.
Configure Syslog to send to Fluentd
There is a very good chance that your Linux distribution already has some version of syslog installed. Ubuntu comes installed with rsyslog, a popular choice for a syslog server. If you don’t have a syslog package installed, you may have to look up the installation documentation for your particular version of Linux.
After you install syslog, you can go ahead and edit the default rsyslog configuration file:
sudo vi /etc/rsyslog.confAt the bottom of the file, add the following:
# forward everything to fluentd
*.* @127.0.0.1:41514
This sets up rsyslog to send every syslog message that it receives to the port that Fluentd is listening on.
Once you’ve saved the file, go ahead and restart the rsyslog daemon:
sudo systemctl restart rsyslogSend a test Syslog message
If you’re lucky, you may already see some system-level syslog messages arrive in your bucket.
If not, you can run a test message to see if it’s working. To do so, enter the following command in your terminal:
logger -d -p local0.debug "Testing Syslog to Influxdb cloud"CopyConfirm that your data arrived
To confirm that your data arrived, navigate to your InfluxDB Cloud home page and select Data Explorer on the left-hand navigation menu:
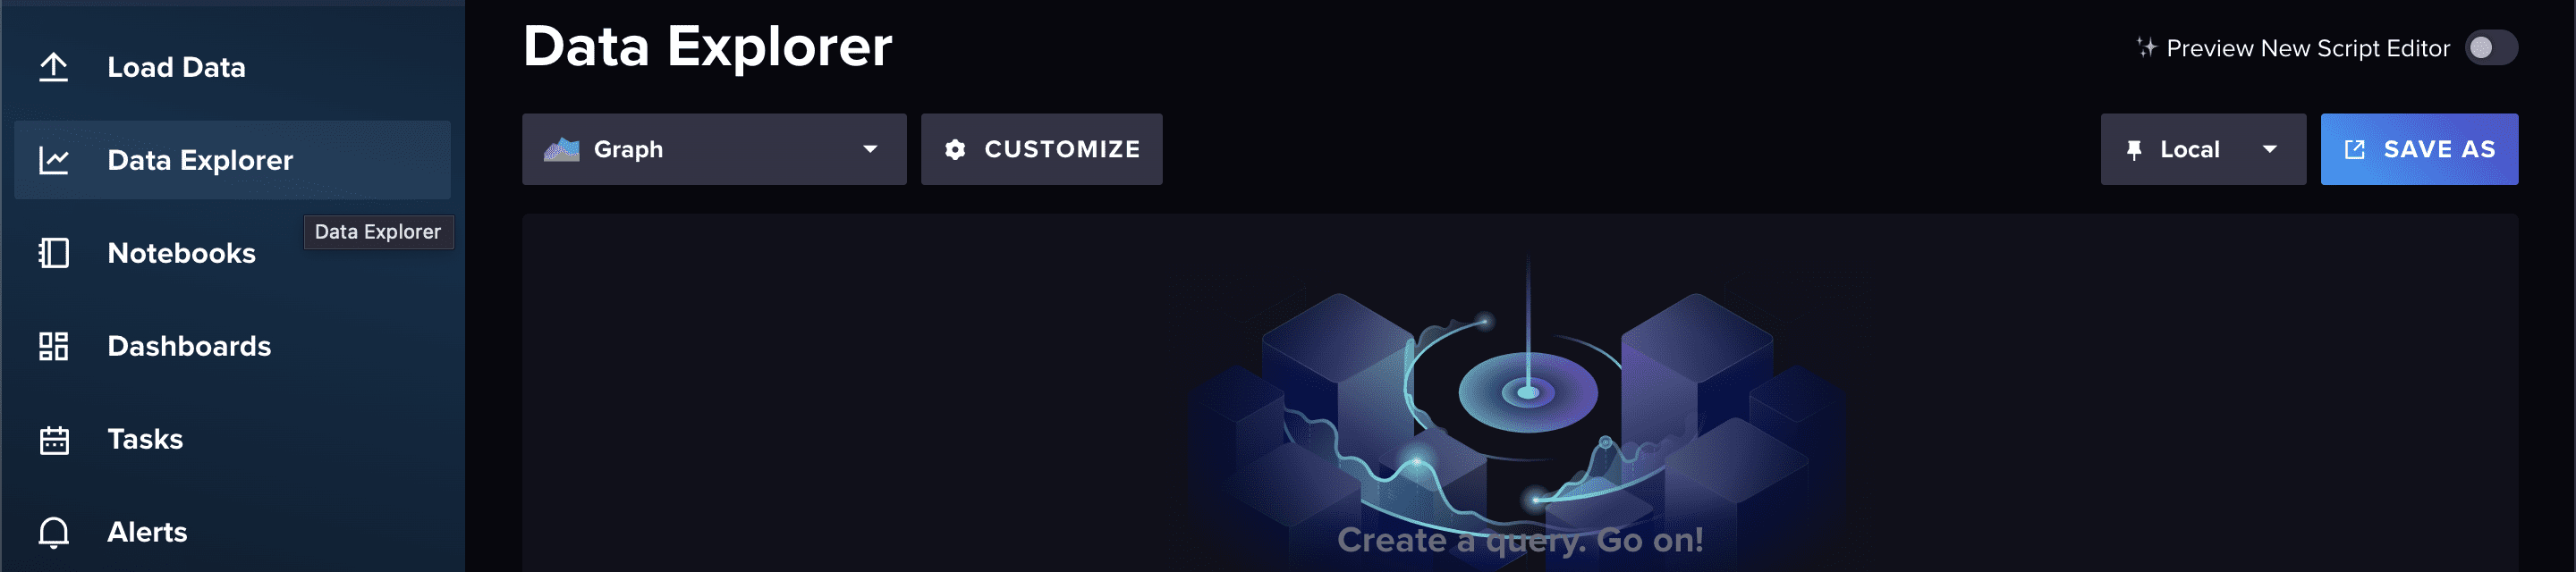
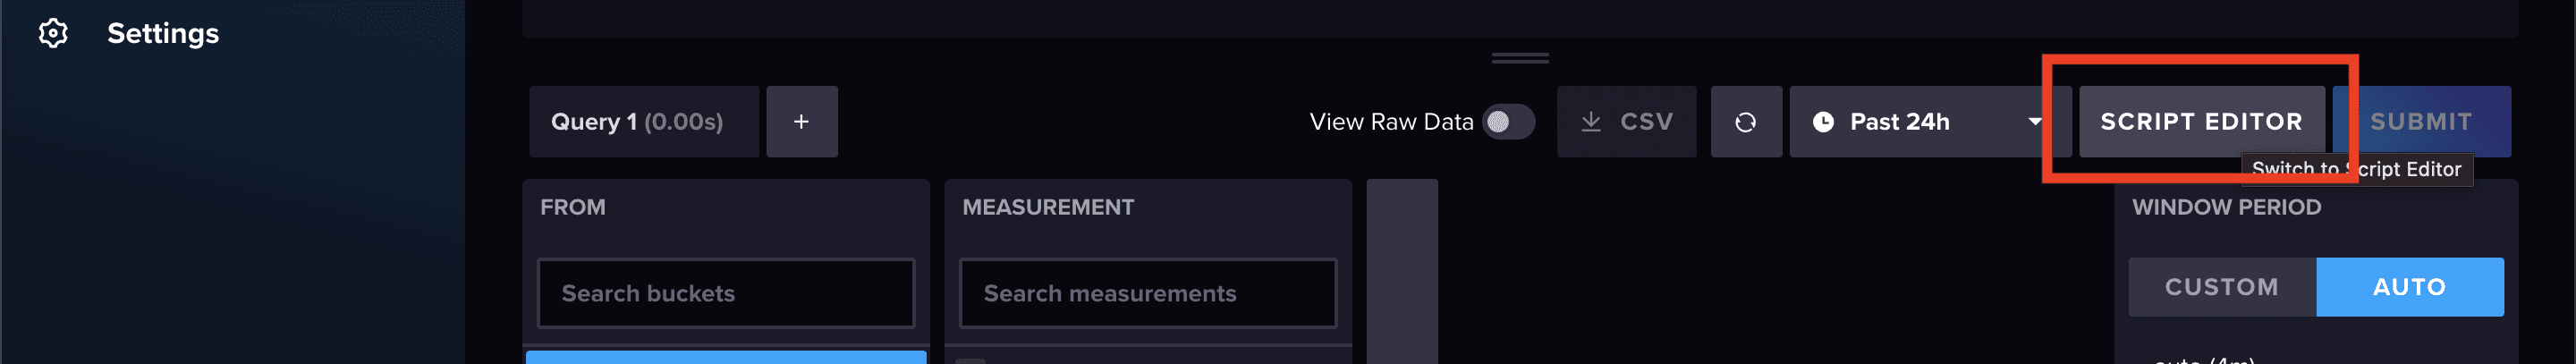
To speed things up, switch from the default Query Builder view to Script Editor:
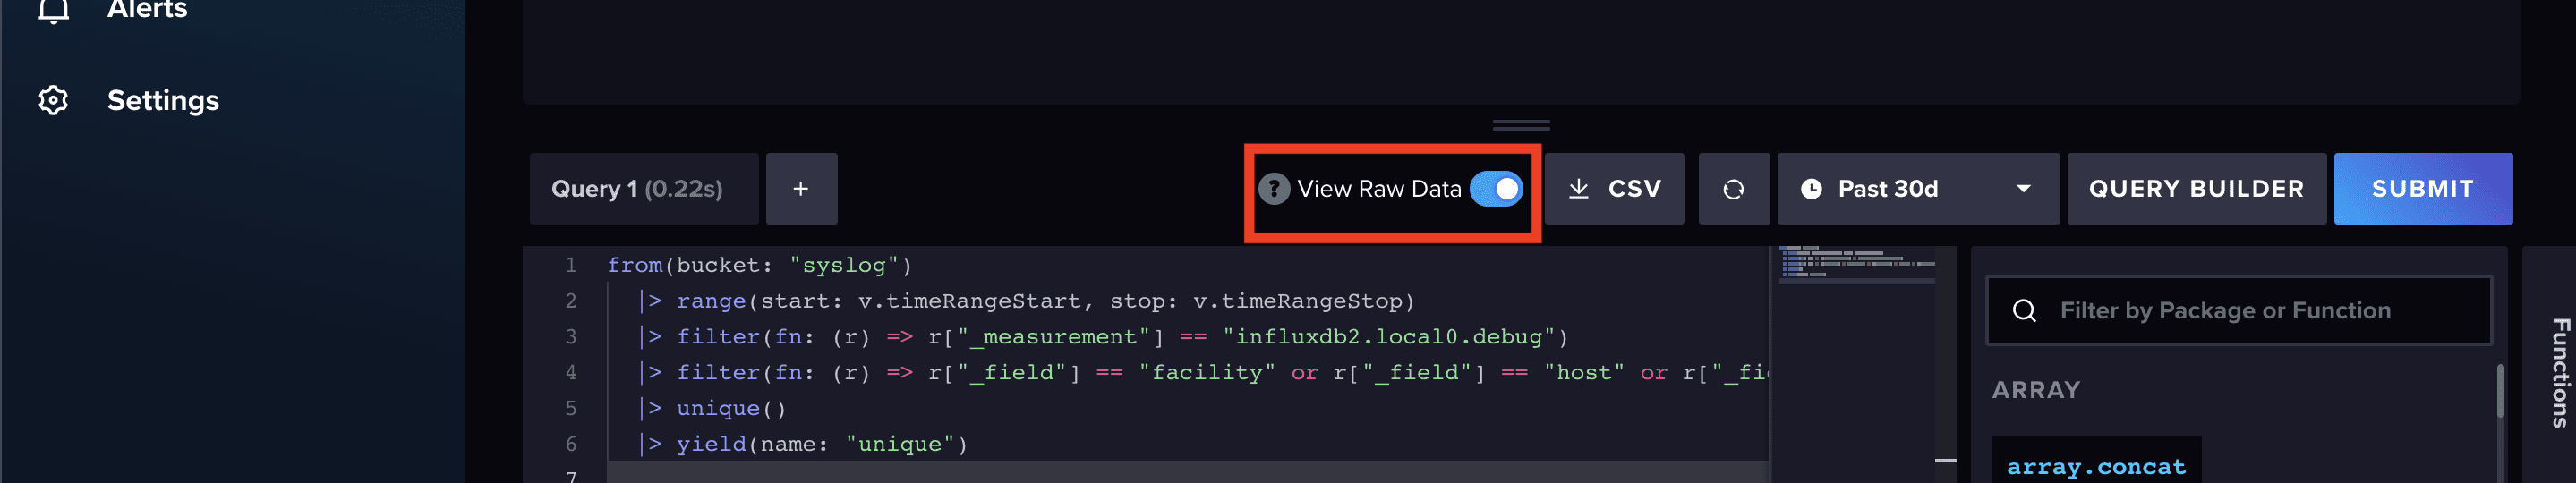
Inside the Script Editor window, copy and paste the following query:
| from(bucket: “syslog”) | |
| |> range(start: v.timeRangeStart, stop: v.timeRangeStop) | |
| |> filter(fn: (r) => r[“_measurement”] == “influxdb2.local0.debug”) | |
| |> filter(fn: (r) => r[“_field”] == “facility” or r[“_field”] == “host” or r[“_field”] == “severity”) | |
| |> unique() | |
| |> yield(name: “unique”) |
view rawflux.txt hosted with ❤ by GitHub
This script is written in Flux, InfluxDB’s querying and scripting language that can be used for simple queries as well as building complex data transformation and manipulation scripts. InfluxDB also recently added support to query data with SQL as well.
Then toggle the View Raw Data switch on:
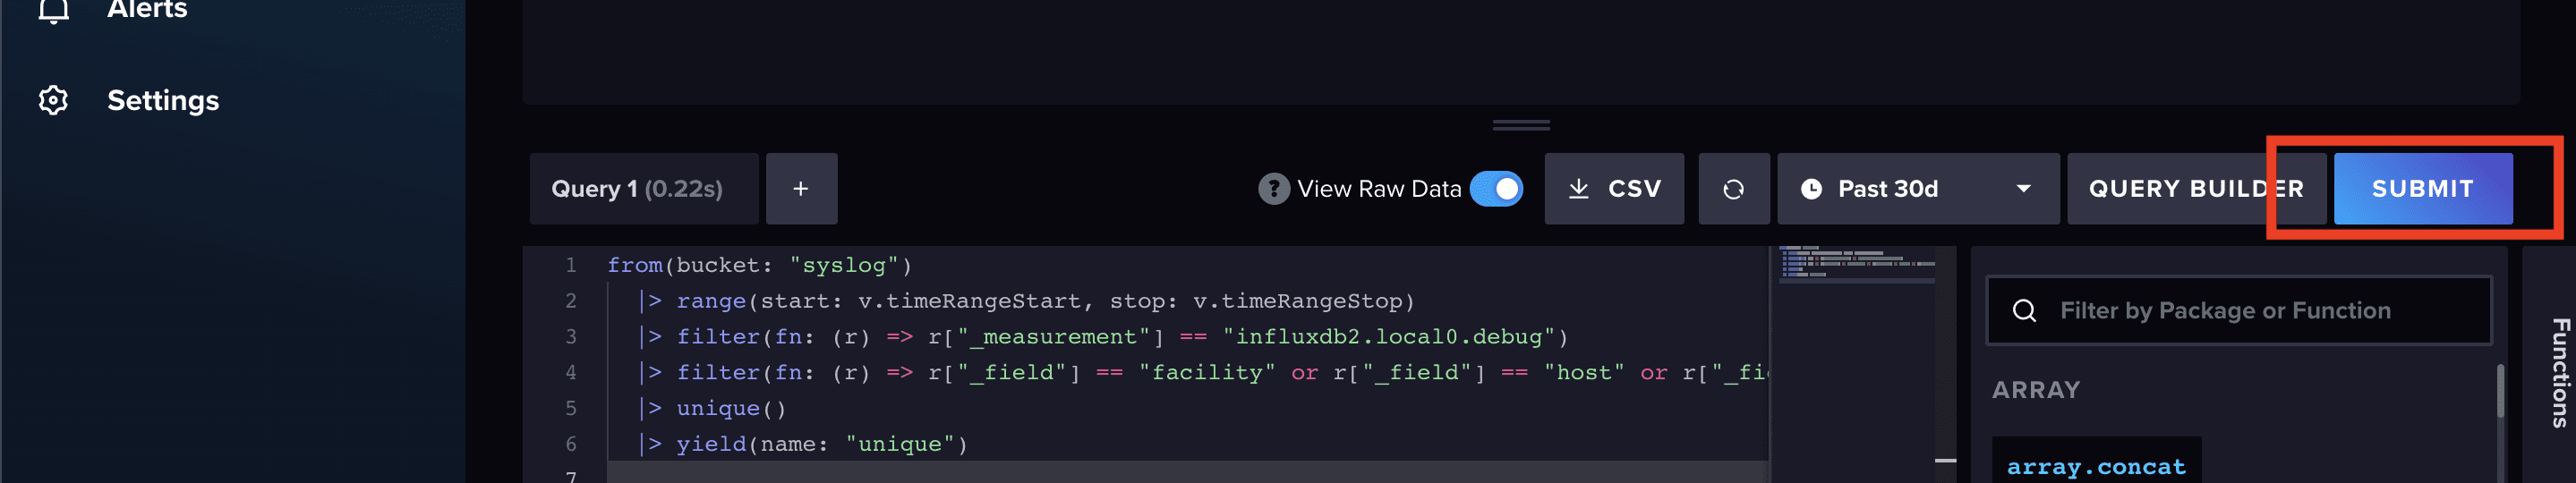
Finally, click SUBMIT:
Now, you should see the results of your query:
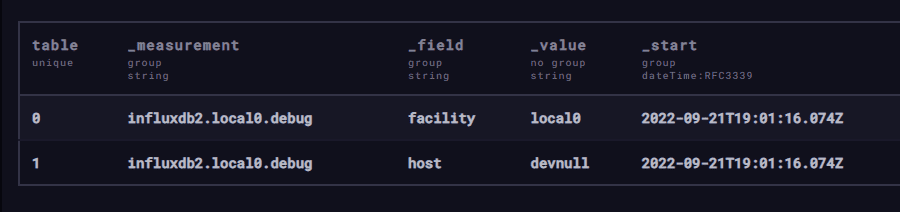
While this example query might not seem exciting, it does show that you have received the syslog events, and at this point, you’ve successfully set up Fluentd to forward messages to an InfluxDB Cloud instance!
Conclusion
In this tutorial, you successfully registered and configured an InfluxDB Cloud instance, installed and configured Fluentd to listen for syslog messages, configured syslog to forward messages to Fluentd, and confirmed that data is flowing from your system to your InfluxdB Cloud instance.
You can view the contents of the configuration files on this GitHub repository.
Storing your data is just the first step and there is much more you can do with your data once it is stored inside InfluxDB to get value from it. Take a look at these additional resources to see what you can do next:
- Analyze your data
- Make forecasts with your data
- Visualize your data
- Create no-code automated workflows
About the author
Thinus Swart is a longtime data geek. More recently, Thinus has been working with Splunk specifically but gets excited about anything related to big data.