

Project post originally published on the LitmusChaos blog by Akash Shrivastava
This article is a getting-started guide for HTTP Chaos in LitmusChaos. We will be talking about
1. Introduction to LitmusChaos
2. How does HTTP Chaos work — Architecture
3. Types of HTTP Chaos Experiments
4. HTTP Chaos Demo
What is LitmusChaos
LitmusChaos is a toolset to do cloud-native chaos engineering. It provides tools to orchestrate chaos on Kubernetes to help SREs find weaknesses in their deployments. SREs use Litmus to run chaos experiments initially in the staging environment and eventually in production to find bugs and vulnerabilities. Fixing the weaknesses leads to increased resilience of the system.
Litmus takes a cloud-native approach to creating, managing and monitoring chaos. Chaos is orchestrated using the following Kubernetes Custom Resource Definitions (CRDs):
* ChaosEngine: A resource to link a Kubernetes application or Kubernetes node to a ChaosExperiment. ChaosEngine is watched by Litmus’ Chaos-Operator which then invokes Chaos-Experiments
* ChaosExperiment: A resource to group the configuration parameters of a chaos experiment. ChaosExperiment CRs are created by the operator when experiments are invoked by ChaosEngine.
* ChaosResult: A resource to hold the results of a chaos experiment. The Chaos-exporter reads the results and exports the metrics into a configured Prometheus server.
For more information, you can visit [litmuschaos.io](https://litmuschaos.io/) or [github.com/litmuschaos/litmus](https://github.com/litmuschaos/litmus)
Architecture
The experiments internally use two things to inject HTTP chaos and redirect traffic properly. First, it runs a proxy server that acts as a middleman and modifies the request/response per the experiment type. Second, it creates a routing rule in the network routing table using the IPtables library to redirect all incoming traffic on the targeted service port to the proxy port.
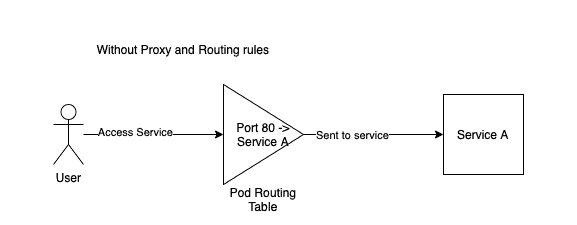
This diagram shows a request without HTTP chaos injected. The request to access Service A comes at port 80 and is forwarded to Service A to be processed
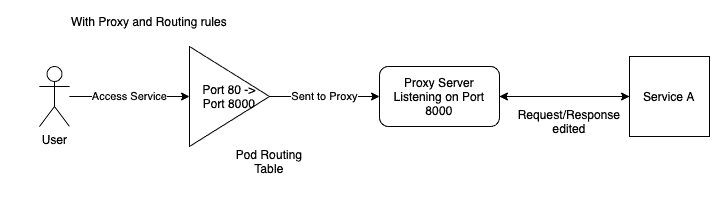
Now, after we inject HTTP chaos, the request to access Service A comes to port 80 but is forwarded to port 8000, on which the proxy server listens for requests. This is done by adding a routing rule in the routing table using IPtables. After the proxy server has modified the request, if required, it will forward the request to Service A to be processed. Now the response will follow the same path, the proxy server will modify the response if required and then send it back to the client to complete the request loop.
The proxy server is running inside the service pod and the service pod routing table is updated by running commands inside the service pod using the `nsenter` tool.
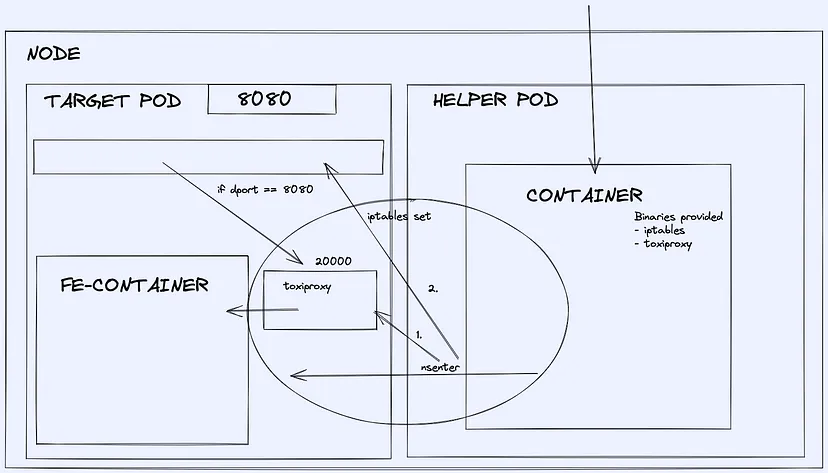
To facilitate the creation of a proxy server and adding rules to the routing table, a helper pod is run which uses `nsenter` to enter inside the target pod to run commands to achieve this.
Experiments
Currently, there are 5 different types of HTTP experiments available. They are
1. HTTP Latency
Let’s know more about them
HTTP Latency
HTTP latency adds latency to the HTTP requests by adding a sleep timer before sending the request forward from the proxy server. It can be used to simulate delayed responses from the APIs. To tune the latency value, use the `LATENCY` experiment variable and provide the value in milliseconds.
HTTP Reset Peer
HTTP Reset Peer simulates TCP connection reset error by closing the connection after a specified timeout. It can be used to simulate connection failures. To tune the timeout value, use the `RESET_TIMEOUT` experiment variable and provide the value in milliseconds
HTTP Status Code
HTTP Status Code can modify the status code of the response from the service as well as change the body of the response for the defined status code with a predefined template. It can be used to simulate API failures. To specify the status code using the `STATUS_CODE` experiment variable to tune the value. Supported values are available in the docs. You can also provide a comma-separated list of values and the experiment will select a random value from the list to use. If no value is provided then any random value from the supported values will be chosen.
You can use the `MODIFY_RESPONSE_BODY` variable to tune whether the response is changed with a predefined template according to the status code or not.
HTTP Modify Header
HTTP Modify Header can modify, add or remove headers from a request or response based on provided values. To specify whether you want to modify the request or response, use the `HEADER_MODE` variable. You can set it to `request` or `response`.
The `HEADERS_MAP` needs a JSON-type input. Suppose you want to add a header `litmus` with a value `2.12.0` then you should provide it like this `{“litmus”: “2.12.0”}` similarly for multiple values as well. To remove a header, you can overwrite its value to an empty string, currently removing the header key is not possible.
HTTP Modify Body
HTTP Modify Body can modify the request/response body completely. This can be used to modify API responses. You can use the `RESPONSE_BODY` variable to provide the overwrite value, this can be an HTML, plain text or JSON object.
Important Tuneable
These are the tuneable specific to all the HTTP Chaos experiments
Toxicity
`TOXICITY` can be used to provide the probability of requests being affected. Suppose you want only 50% of the requests to be affected, by setting the value `TOXICITY` to 50, the probability of a request getting affected is 50%. This doesn’t mean every alternate request will be affected, but each request has a 50–50 chance of being affected. In large requests count, this comes out to be around 50% of requests being affected.
Target Service Port
`TARGET_SERVICE_PORT` is the port of the service you want to target. This should be the port where the application runs at the pod level, not at the service level. This means if the application pod is running the service at port 8080 and we create a service exposing that at port 80, then the target service port should be 8080 and not 80, which is the port at pod-level.
Proxy Port
`PROXY_PORT` is the port at which the proxy server will be running. You are not required to change the default value (which is 20000) if this port is being used explicitly by any of your other services. If the experiment fails due to a port bind issue for the proxy server, you can change this value to an empty port to make it work.
Network Interface
`NETWORK_INTERFACE` is the interface name for the network which your service is using. The default value is `eth0`. If the experiment injection is failing due to a network interface error, you can use this to change it to the correct value.
Demo
Let us run the HTTP Status Code experiment. For simplicity, we will be injecting chaos into an Nginx service.
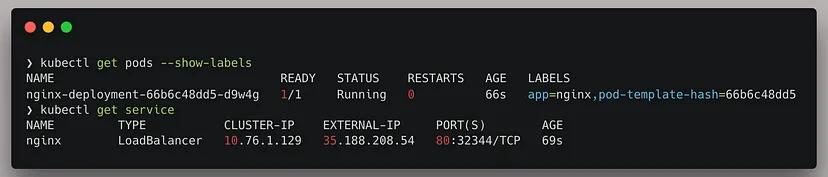
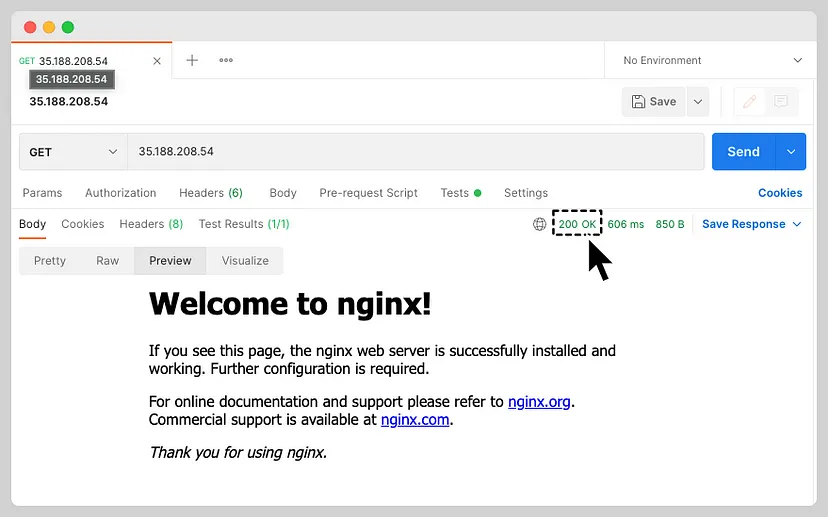
The service is running on port 80, we will be targeting this.
If we access the service, we are getting a 200 OK response with the default Nginx webpage. I will be using Postman to verify the status code.
Now that we have the application set up on which we will be injecting chaos, let’s start creating a chaos scenario with the HTTP Status Code experiment.
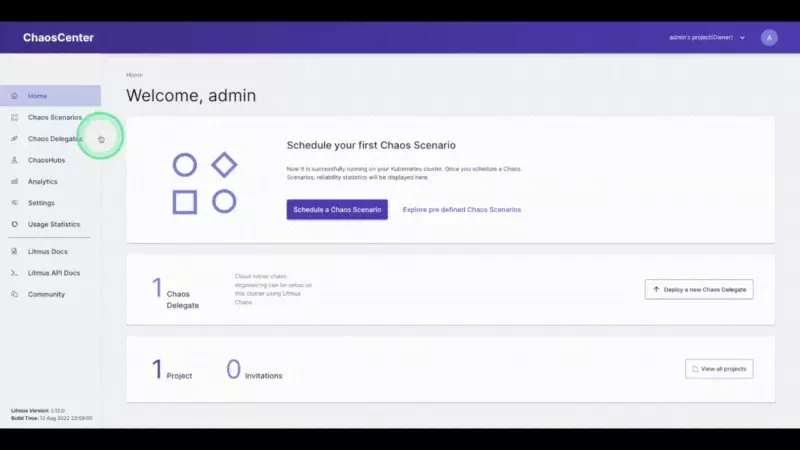
Login to the Chaos Center and get to the Chaos Scenario section. Click on the Schedule a Chaos Scenario button. Select your agent and then select the chaos hub (HTTP experiments are available from ChaosHub version 2.11.0). Add a name for your scenario and move ahead. Now we are selecting the experiments page.
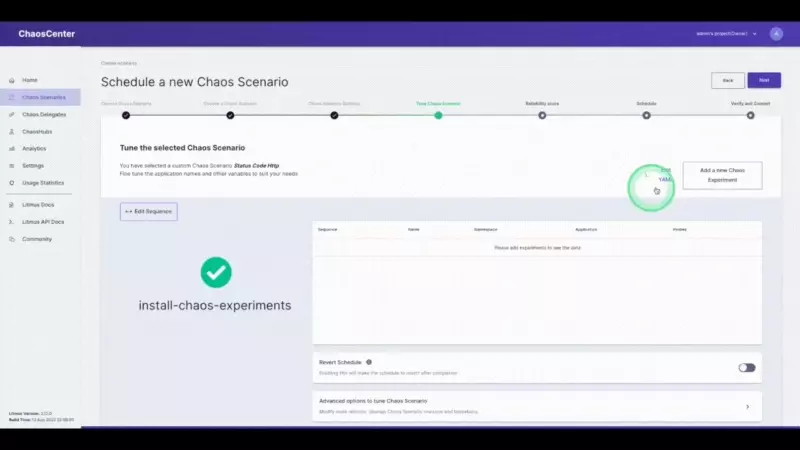
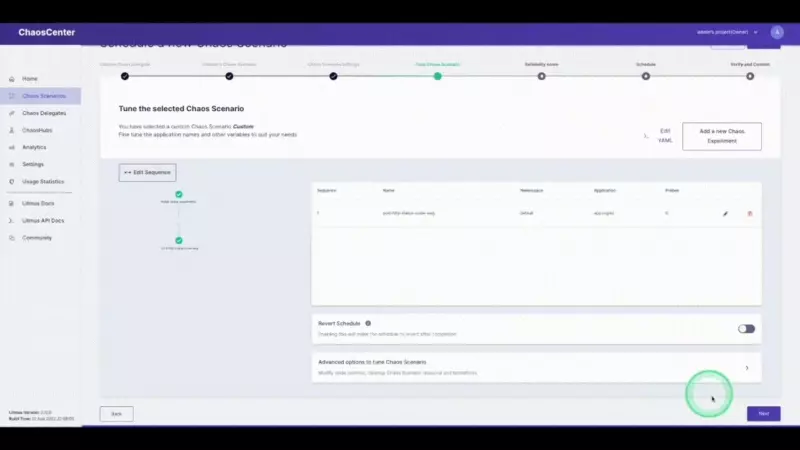
We will be selecting the `generic/pod-http-status-code` experiment from the list of experiments. Moving ahead, we will tune the experiment variables.
Click on the pencil icon next to the experiment name to edit the experiment. Now we have to select the app to inject chaos into. The NGINX application we are using is running in the `default` namespace, it is of the `deployment` kind and has the label `app=nginx`. We will skip adding probes to keep it simple. The next section is to tune the experiment variables. Change the `STATUS_CODE` to `500` and the `TARGET_SERVICE_PORT` to the port of the service, in this case, it is `port 80`. The `MODIFY_RESPONSE_BODY` is a boolean to specify whether the response body should be changed to a pre-defined HTTP template according to the status code. Now we are done with tuning the required variables in this experiment, let’s move ahead and run this.
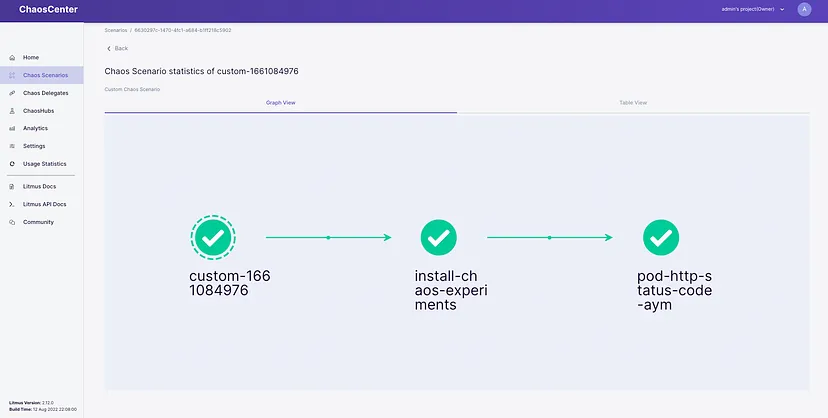
Now LitmusChaos will set up the experiment and then run it, once it starts injecting chaos we will be seeing the status code changing for the service. The output will be something similar to this.
That’s it, we have injected HTTP chaos into our application. The experiment passed because we haven’t specified any criteria to verify, we can do this using probes.
Summary
Through this article, we could understand how the HTTP chaos experiment works internally and then talk about the current types of HTTP chaos experiments available. Then we injected the HTTP Status code experiment on a sample NGINX service and saw the experiment in live action. In further tutorial blogs, I will be talking about running the other HTTP experiments as well.
You can join the LitmusChaos community on GitHub and Slack. The community is very active and tries to solve queries quickly.
I hope you enjoyed this journey and found the blog interesting. You can leave your queries or suggestions (appreciation as well) in the comments below.
Show your ❤️ with a ⭐ on our Github. To learn more about Litmus, check out the Litmus documentation. Thank you! 🙏
Thank you for reading
Akash Shrivastava
Software Engineer at Harness