Guest post by Matt Lenhard, co-founder and CTO of ContainIQ
You probably already know that Kubernetes is the leading container orchestration system. And according to the most recent CNCF study, you’re likely already using it for production workloads or considering it for the year ahead. The 2021 study found that an astounding 96% of respondents are using Kubernetes or are planning to use it in the near future — and that 69% of respondents are using Kubernetes in production today.
Kubernetes offers many benefits for both large organizations and small ones: it improves developer productivity, reduces costs, increases efficiency, and ultimately leads to a better experience for end-users.
But while Kubernetes has many advantages, it comes with some challenges, too. Implementing a comprehensive monitoring stack is an important early step for teams running workloads on K8s. In this post, we’ll explore four open-source tools and technologies that you can use to reduce downtime, troubleshoot more efficiently, and get a full picture of everything happening inside a cluster.
4 Open-Source Tools and Technologies
The Cloud Native Computing Foundation, or CNCF, has incubated and graduated a number of amazing technologies and tools used for monitoring and observability. Four of these tools and technologies stand out as especially helpful and can be leveraged by organizations of all sizes. Let’s jump in.
Prometheus | Metrics and Alerting

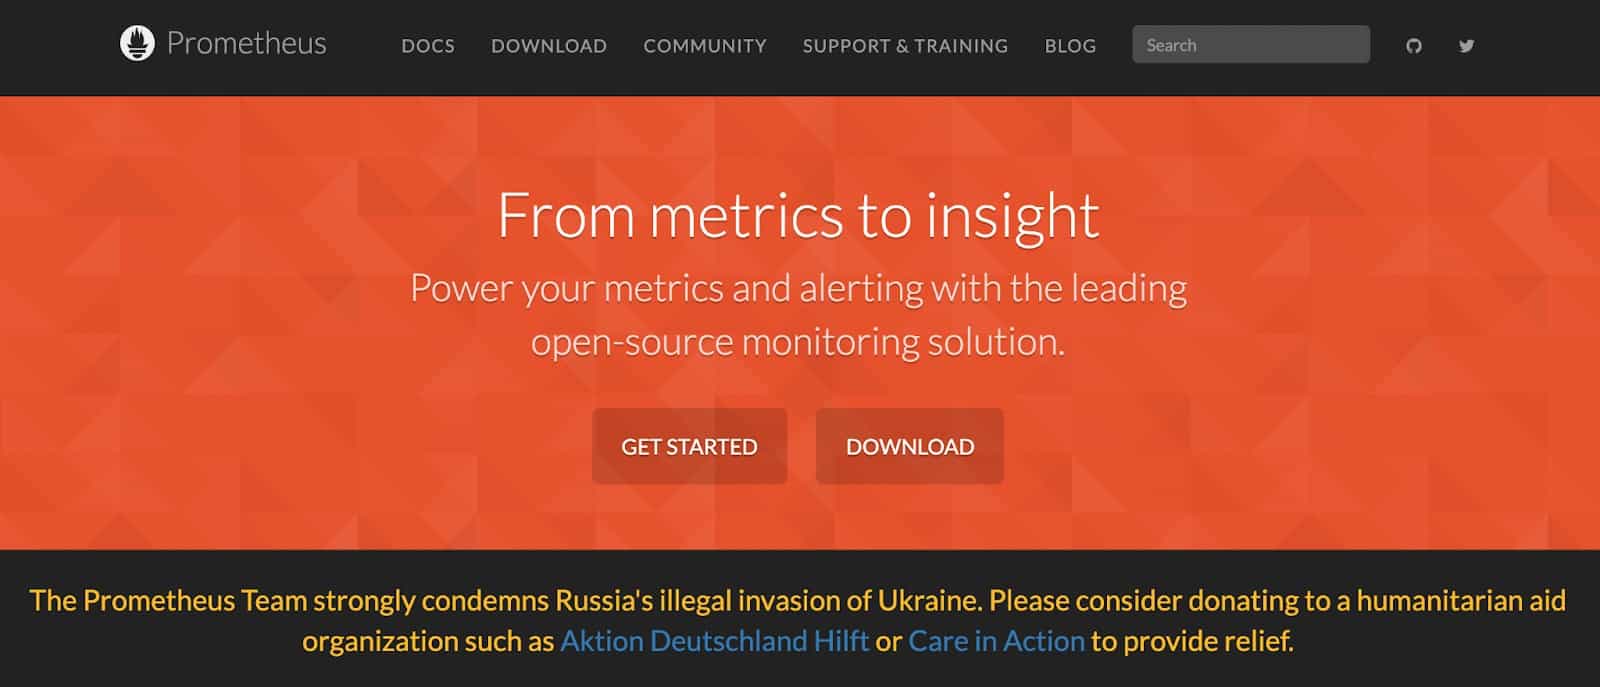
Prometheus, accepted to CNCF on May 9, 2016, is a powerful and 100% open-source tool and time-series database. With Prometheus, engineering teams are able to collect metrics and configure alerts on a large scale. Prometheus is used by nascent startups, as well as some of the largest companies in the world, such as Digital Ocean, Ericsson, and Docker.
With Prometheus, teams are able to write queries and create ad-hoc tables, graphs, and alerts using PromQL. And with Alertmanager, teams are able to use preconfigured and customizable alerts to identify important issues as they happen. Using the alerting rules, users are able to define alert conditions using the Prometheus expression language, and then send notifications to an external service.
Prometheus has a built-in toolset for visualization but is often paired with another visualization tool, such as Grafana or ContainIQ. Connecting Prometheus to a visualization tool is easy; there are plenty of prebuilt dashboards available in Grafana.
Because Prometheus has many integrations and existing exporters, bridging third-party metrics into Prometheus is very easy with the official exporters, as well as externally maintained options.
Prometheus is a CNCF Graduated project. On GitHub, Prometheus has more than 42,000 stars and contributions from more than 700 contributors.
Jaeger | Tracing

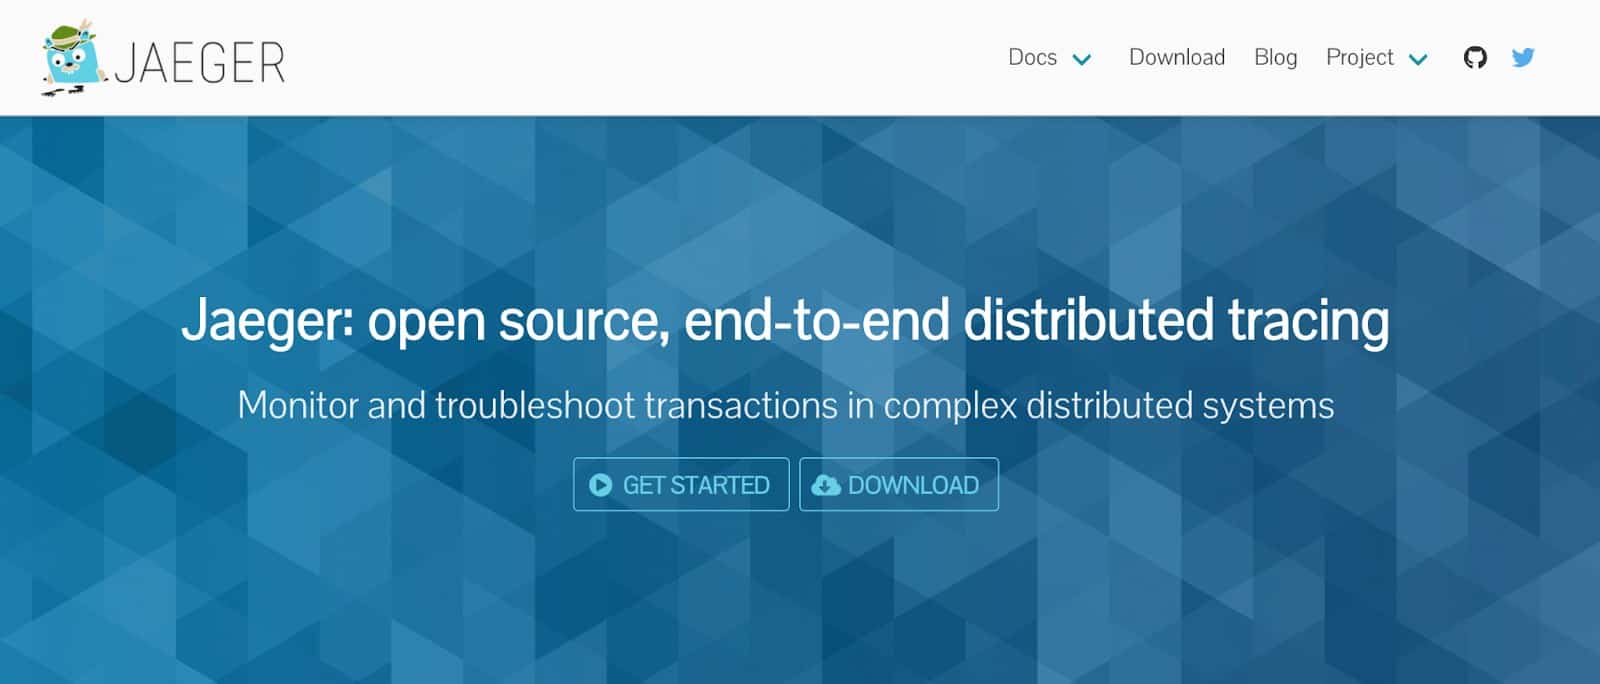
Jaeger, accepted to CNCF on September 13, 2017, is an open-source platform for distributed tracing. With Jaeger, engineers can monitor and troubleshoot with distributed transaction monitoring, or tracing. Like Prometheus, Jaeger is used by teams both large and small and was designed to be used on a massive scale. Companies like Uber use Jaeger to process billions of spans per day.
Jaeger is particularly helpful for analyzing performance and latency and for making optimizations. And with Jaeger, it is much easier to perform root cause analysis and research service dependencies. For example, Jaeger can be used to identify spikes in latency for particular microservices, including those that impact end-user experience.
Prometheus and Jaeger are often used together: Prometheus provides a toolset for detecting issues within your infrastructure, and Jaeger helps you fix them by digging into the individual requests.
Jaeger has a native UI called Jaeger Web UI, which is implemented in Javascript.
Getting started with Jaeger and Kubernetes is a straightforward process. The Jaeger Operator can be installed on a Kubernetes cluster and can be enabled for a specific namespace or across the entire cluster.
Jaeger is a CNCF Graduated project. On GitHub, Jaeger has more than 15,000 stars and contributions from more than 200 contributors.
OpenTelemetry | Standardizing Metrics, Logs, Traces

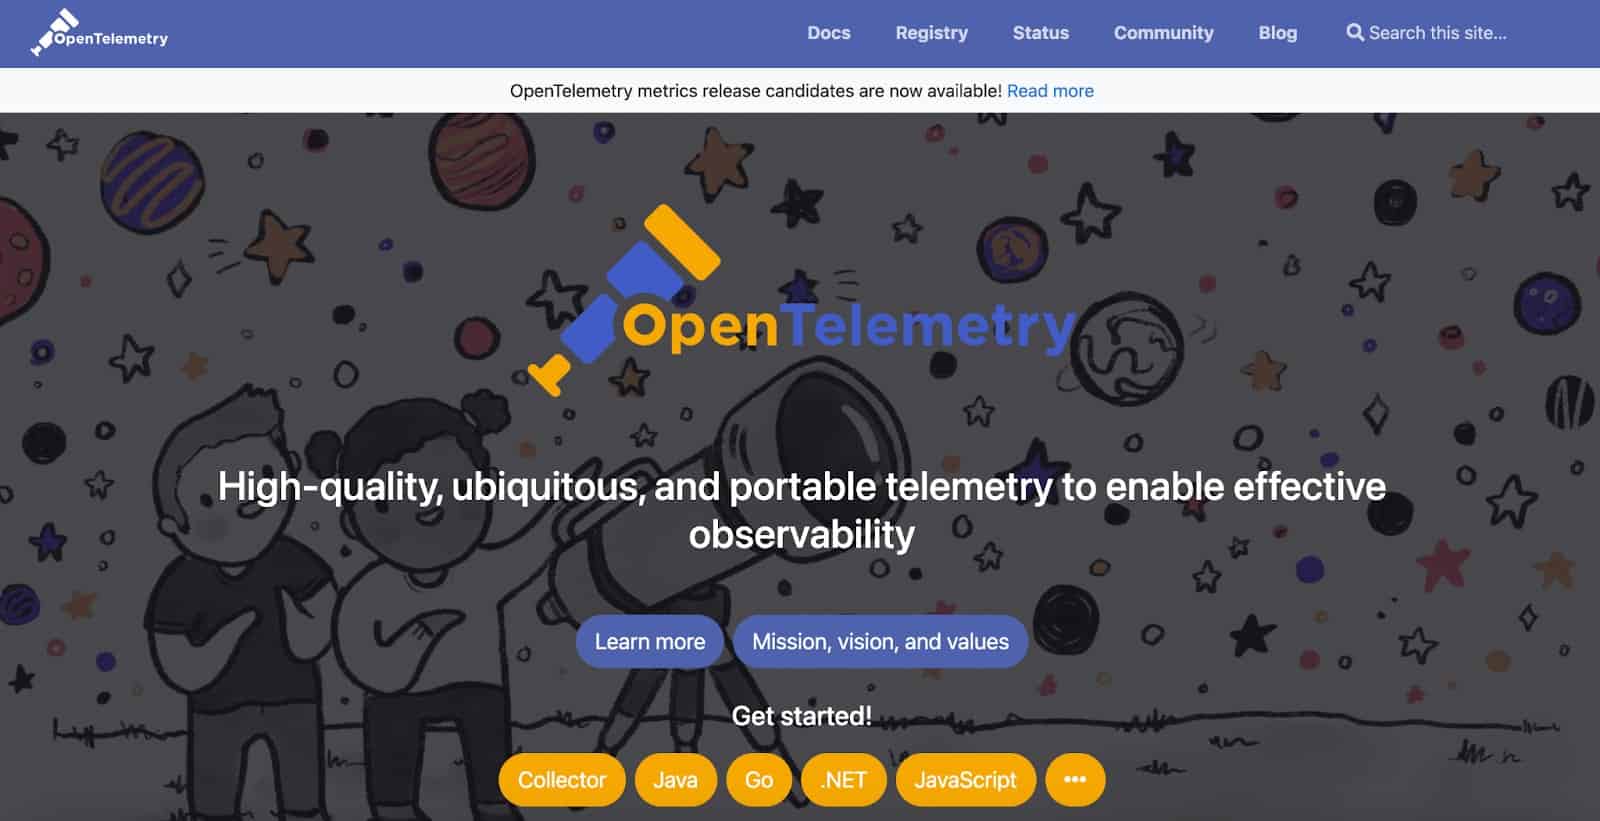
OpenTelemetry, accepted to CNCF on May 17, 2019, is a collection of tools, APIs, and SDKs that instrument, generate, collect, and export telemetry data. By using OpenTelemetry, engineers are able to collect metrics, logs, and traces, so they can dig deeper into the performance of their infrastructure and applications.
OpenTelemetry is open-source, vendor neutral, and supported by many of the largest companies in observability, as well as by the cloud providers themselves.
There are many benefits to microservices architectures, but when they are deployed at scale, it can become more difficult for engineering teams to view how services are performing and how they are affecting other services. Metrics, logs, and traces give teams a full picture of what’s happening, but gathering this data requires running, operating, and maintaining multiple agents/collectors, which can be a challenge.
OpenTelemetry solves this by standardizing the format for sending data to an observability backend, whether it be an open-source tool or a paid solution. And it removes the risk of vendor lock-in, as teams are now able to switch between backends easily with a standard format.
OpenTelemetry is a CNCF Graduated project and is on GitHub.
Thanos | Multi-Cluster and Long-Term Storage of Metrics

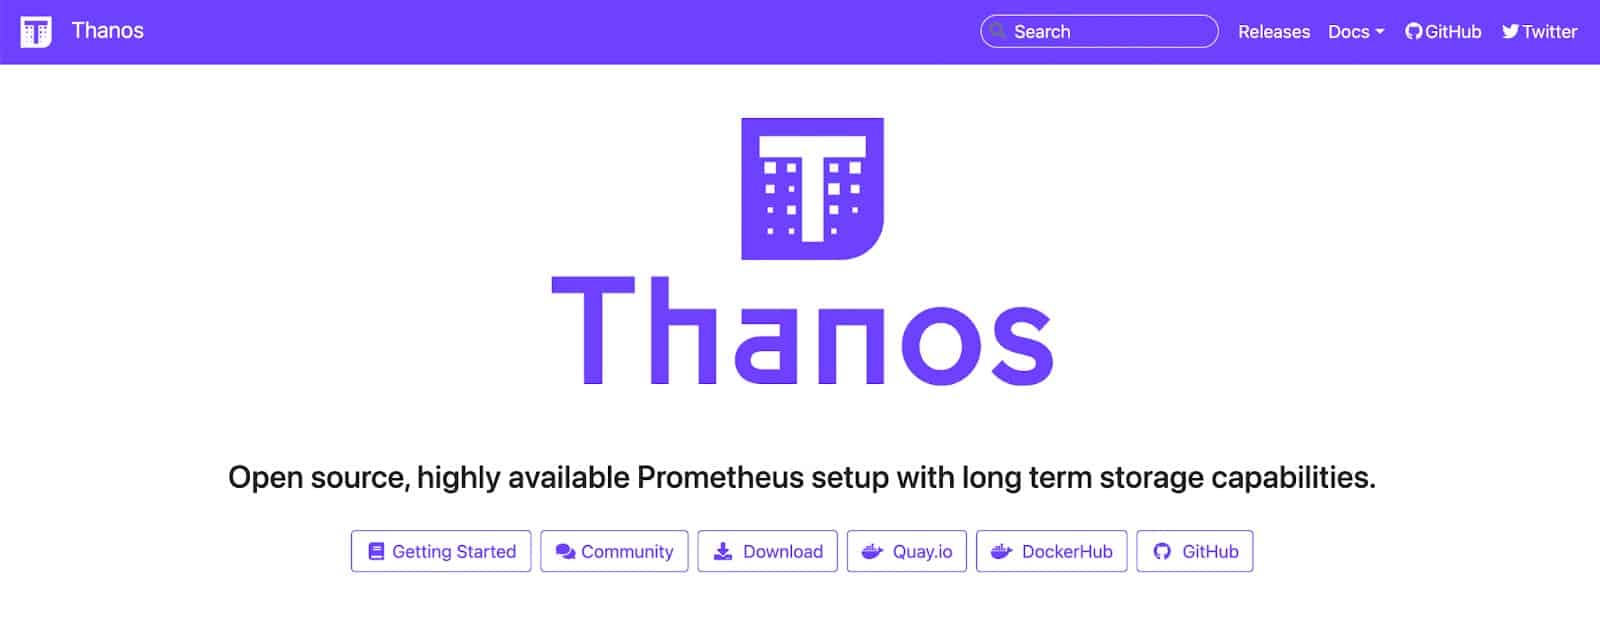
Thanos, accepted to CNCF on July 20, 2019, is an open-source project that enables engineers to scale their Prometheus setup with highly available long-term storage options. Thanos can easily be integrated with Prometheus using a sidecar that runs on the same host or in the same pod as the Prometheus server. Like Prometheus, Thanos is not tied to Kubernetes in particular, but this is the popular use case.
Thanos aims to improve upon Prometheus in a number of important ways.
First, with Thanos, engineers can scale their Prometheus setup by allowing for querying across multiple servicers and clusters. For companies running Kubernetes workloads across multiple clusters, this is an improved approach and can help save time with a centralized view. Second, with Thanos, teams are able to take advantage of a number of longer-term storage options like S3.
Thanos, like Prometheus, can be used with visualization tools like Grafana, and it natively supports the Prometheus query API.
Thanos is a CNCF Incubating project. On GitHub, Thanos has more than 10,000 stars and contributions from more than 400 contributors.
Additional Considerations
Here are a few additional best practices to consider.
- Scale Slowly: While these tools have a lot of benefits, teams should be thoughtful during implementation. In some cases, it may make sense to test each of these tools in a limited set or in a single cluster, or in a staging environment, before using them across an entire infrastructure.
- Consider Using Managed Offerings: Today, many cloud providers offer managed solutions. For example, Amazon and Google Cloud both have managed Prometheus offerings.
- Encourage Teamwork: The entire team can understand how to use these tools. Embrace learning, and give your engineering team the time and resources they need in order to familiarize themselves with the world of open-source tooling.
- Be Cautious of Alert Fatigue: Alert fatigue is a real challenge for organizations as they scale. Work hard to set actionable alerts, and consider retuning your alerts on a regular cadence to ensure that they are creating value and not wasting time.
Final Thoughts
In this article, we explored four toolsets that enhance and improve monitoring for engineers running workloads on Kubernetes.
Prometheus is the go-to time-series database for many organizations and, when used with Thanos, is a long-term solution.
Jaeger provides the additional context needed to fix the issues you detect in your infrastructure. And OpenTelemetry has standardized the format and collection of metrics, logs, and traces, giving teams peace of mind and the ability to stay dynamic.
Together, these tools provide the metrics, logs, and traces you need to troubleshoot effectively and ensure that your end users are having a great experience.