


Guest post originally published on Timescale’s blog by James Blackwood-Sewell
Table of contents
03 Instruments and Emitting Measurements
This is the second post of a three-part series about metrics. First, we deep-dived into the four types of Prometheus metrics; now, we’re examining how metrics work in OpenTelemetry, and finally, we will put the two together—explaining the differences, similarities, and integration between the two.
OpenTelemetry is an open-source observability framework for infrastructure instrumentation hosted by the Cloud Native Computing Foundation (CNCF). The project gained a lot of momentum with contributions from all major cloud providers (AWS, Google, Microsoft) as well as observability vendors (including Timescale) to the point it became the second-highest ranked CNCF project by activity and contributors, only coming second to Kubernetes itself.
OpenTelemetry aims to define a single standard across all types of observability data (which it refers to as signals), including metrics, logs, and traces. Through a collection of tools, libraries, APIs, SDKs, and exporters, OpenTelemetry radically simplifies the process of collecting signals from your services and sending them to the backend of your choice, opening the doors of observability to a wider range of users and vendors.
When designing the specification of the OpenTelemetry metrics, three design goals were embraced:
- To provide the ability to connect metrics to other types of observability data—either directly between traces and metrics with Exemplars, or indirectly, by providing the same associated metadata that logs and traces enjoy with Baggage and Context.
- To allow easy migration from OpenCensus metrics to OpenTelemetry metrics.
- To provide full support for other major metrics implementations where possible. Prometheus and StatsD are specifically targeted to have full support, with users who convert to OpenTelemetry seeing similar results to using their native clients.
OpenTelemetry provides a Collector which can be used to reaggregate and redirect metric data, often being used to create signal pipelines. As OpenTelemetry doesn’t provide a backend implementation (its concern is creating, collecting, and sending signals), the data will flow to another system or systems for storage and eventual querying.The reason why OpenTelemetry can sometimes feel complicated it’s because it can be used to model many different signal implementations. In this blog post, we will focus on the surface area—the elements that developers are likely to encounter when using metrics in OpenTelemetry.
OpenTelemetry Metrics
OpenTelemetry metrics are slightly different from Prometheus metrics, allowing much more flexibility in the way they can be transformed in the collection path, as well as supporting many export types including push and pull options. Due to this flexibility, many existing metric systems can be modeled with OpenTelemetry without the loss of semantics or fidelity, which makes it the perfect metric system for interoperability.
OpenTelemetry has three models:
- The Event model, in which you create metrics as a developer
- The Stream model, which OpenTelemetry uses for transport
- The Timeseries model, which OpenTelemetry uses for storage
The metric types discussed in this post are all part of the Event model, and the transformations are part of the conversion from the Event Model to the Stream Model. (As a developer, you don’t really need to worry about the models—but having a basic understanding helps.)
The OpenTelemetry SDK allows us to:
- Reduce the number of metrics being transmitted through temporal aggregation (changing the resolution)
- Reduce the number of metrics being transmitted through spatial aggregation (removing unwanted attributes)
- Change from a cumulative representation (which Prometheus uses) to a delta representation (expressing the change between values, not the absolute measurements)
OpenTelemetry metrics work by using the global MeterProvider to create a Meter and associating it with one or more Instruments, each of which is used to create a series of Measurements. These Measurements are aggregated in Views to a metric. The metrics are then observed and emitted by the combination of a Metric Reader and Metric Exporter (which could be pull or push).
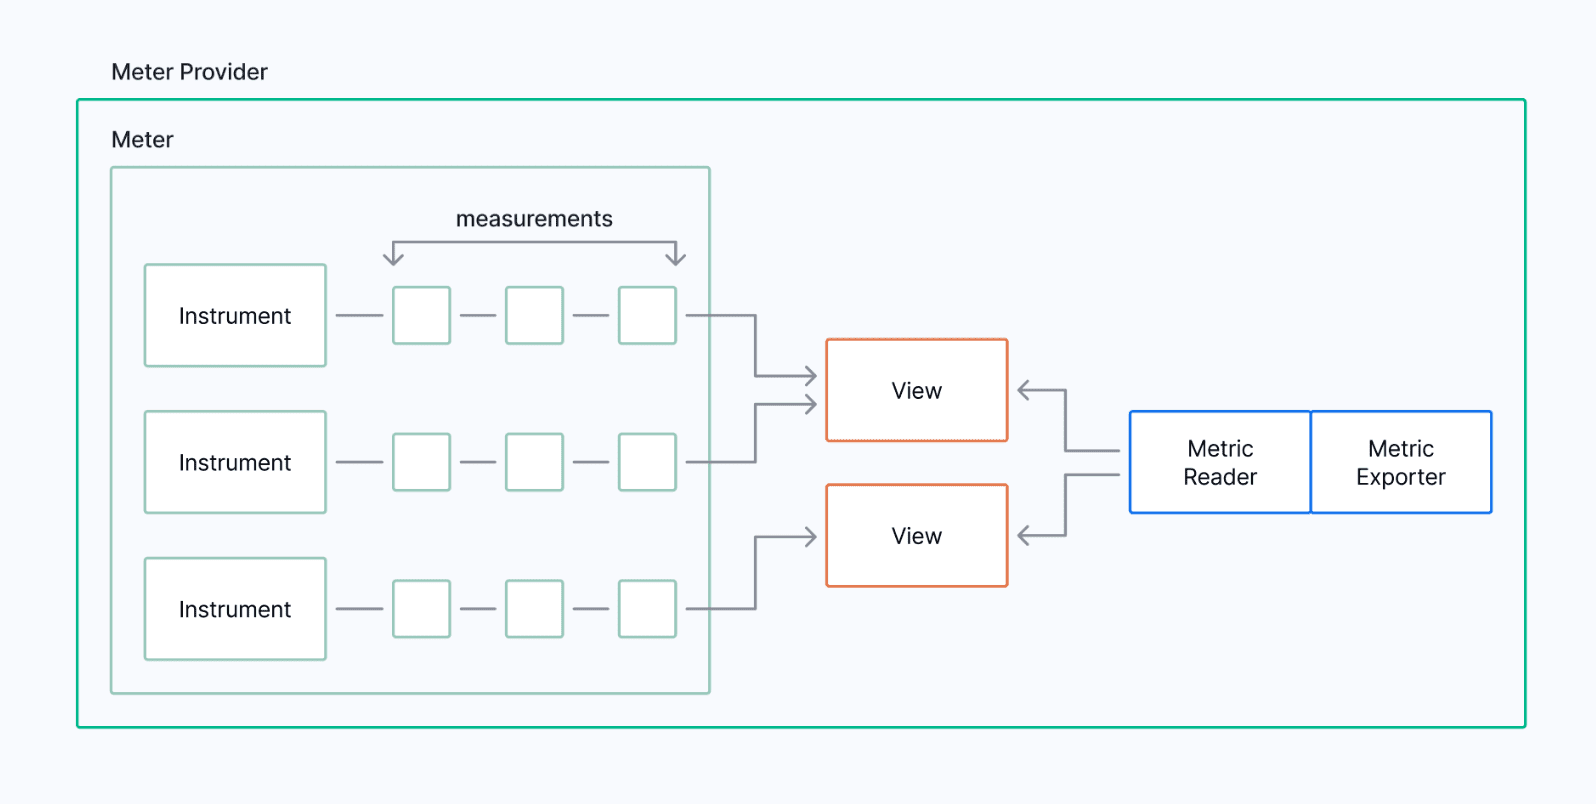
Instrument Measurements are what we create or observe in our applications, and Metrics express the current aggregated value of that Instrument that we share with consumers of our observability data.
OpenTelemetry allows attributes (labels) to be attached to metrics in several ways. The most common are:
- From any attached Resources, which might hold labels defining the host. For example, a Kubernetes pod or a virtual machine
- From the current Context, which will be attached to all synchronous Instruments
- On the Measurement itself
Measurements to Metrics
Measurements can be created very quickly, especially when synchronous, which can rapidly overwhelm a metric pipeline. To combat this, Prometheus uses a pull mechanism with a scrape interval, while OpenTelemetry addresses the issue in the collection path by attaching an aggregating view to each Instrument, then passing the data to a MetricReader which observes them, and a MetricExporter which outputs them:
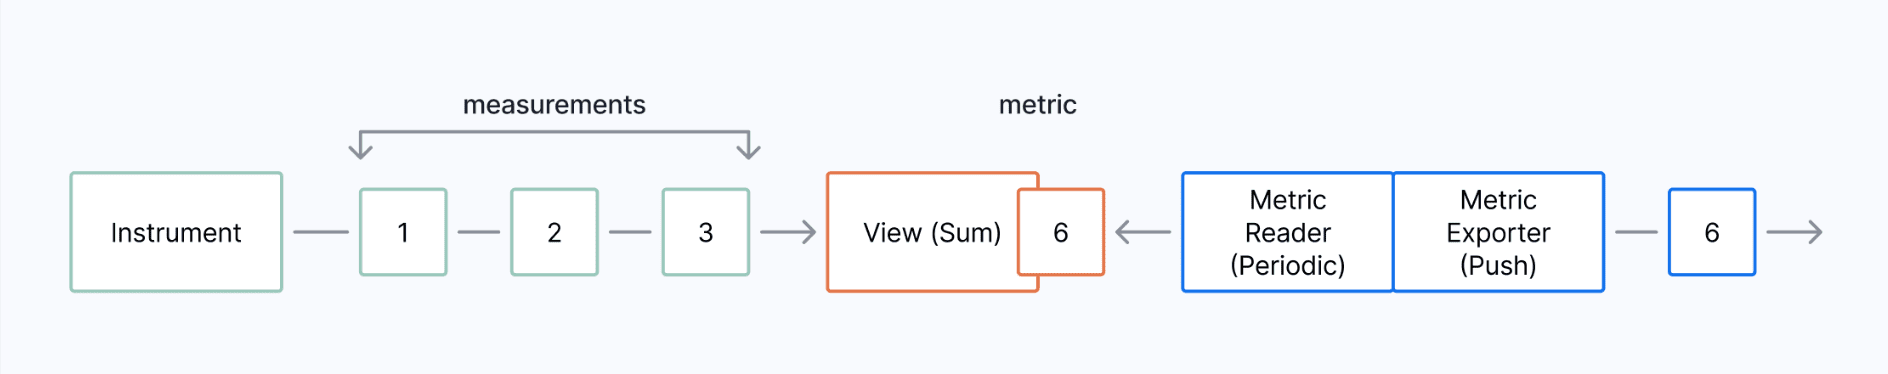
The MetricReader is responsible for attaching the default view if no views are present for an Instrument and also for defining MetricExporters, which will send the values onward. It will also change the temporality of the metrics from the default Cumulative (the new value is added to the last value, which is the same as we see in Prometheus) to Delta (the metric value is the difference between the old and new values).
Each Instrument is associated with a MetricReader, which is responsible for attaching the default views if no other views are defined for an Instrument. In addition, it also defines the temporality—potentially switching from the default Cumulative (the current value is added to the previous values, as used in Prometheus) to Delta (the difference between the current and last values is reported, reducing the client overhead when calculating rates).
The combination of the MetricReader and the MetricExporter is responsible for how the data is sent downstream. A very popular approach is to use the PeriodicExportingMetricReader with the OTLPMetricExporter to sample the metric values every period (60 seconds by default) and send them to an Opentelemetry Collector (which would use another Exporter) for further processing. Many other Exporters are available for various languages.
Some popular ones are:
- Prometheus Metric Exporter: a pull-based exporter which Prometheus clients can scrape.
- Prometheus Remote Write Exporter: a push-based exporter which sends metrics via the Prometheus remote write protocol.
- OTLPMetricExporter: it can push metrics to any device which understands the OpenTelemetry protocol.
- ConsoleMetricExporter: it is used to write debug messages to the console.
In Python, initializing OpenTelemetry metrics and attaching a default MetricReader and MetricExporter (that will send metrics to the local OpenTelemetry Collector) would look like this:
from opentelemetry._metrics import get_meter_provider, set_meter_provider
from opentelemetry.exporter.otlp.proto.grpc._metric_exporter import (
    OTLPMetricExporter,
)
from opentelemetry.sdk._metrics import MeterProvider
from opentelemetry.sdk._metrics.export import PeriodicExportingMetricReader

exporter = OTLPMetricExporter(insecure=True)
reader = PeriodicExportingMetricReader(exporter)
provider = MeterProvider(metric_readers=[reader])
set_meter_provider(provider)
Instruments and Emitting Measurements
OpenTelemetry provides six types of Instruments that we can capture Measurements with. They can be grouped into two categories: synchronous and asynchronous. Each Instrument can emit Measurements, and each Instrument can be associated with attributes.Synchronous instruments are implemented in application code in a similar way to Prometheus metrics, by inserting code into applications that will update a value each time it is executed. They can be associated with the current Context (which helps to describe the current application state).
Asynchronous instruments register a callback function and only emit values when they are being observed. For example, an asynchronous instrument could be registered to report the value of a sensor every 10 seconds. These instruments can not be associated with the current Context, as they are external to the main application—instead of being called as the main program runs, they observe signal data as requested from their watcher. In some ways, they are similar to the Prometheus monitoring of a non–instrumented application via an exporter.
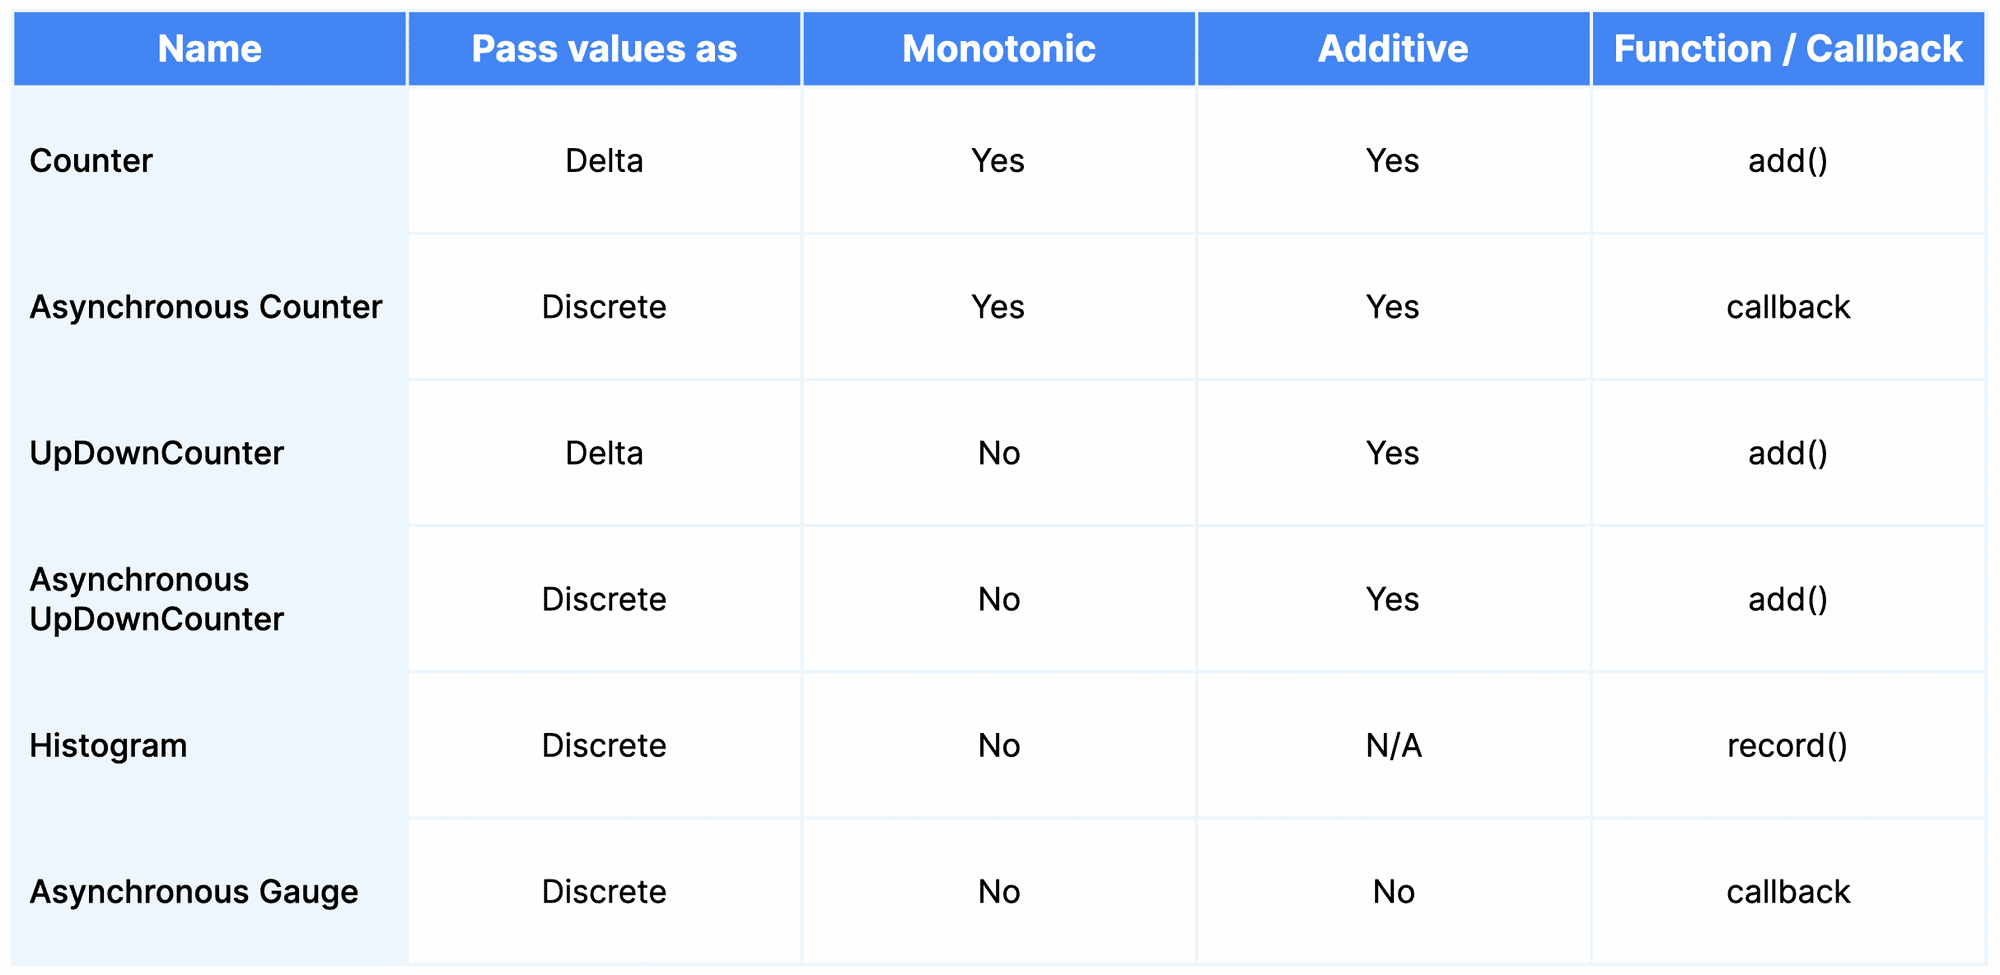
All instruments are created with a name, a description, and a unit of measurement (which must follow the instrument unit rules). Asynchronous instruments also specify the callback function, which is called to observe Measurements.The OpenTelemetry instrument types that developers can use are shown in the table below. (Confusingly, the suggested name that languages present to a user is not the same as the measurement name, with Observable being used in place of Asynchronous. I.e., observable_counter.)
Now, let’s expand into each instrument type.
Counter / Asynchronous Counter
A Counter is a synchronous instrument that is always increasing—it’s monotonic, and only accepts non–negative values. Unsurprisingly, it’s the same as the Prometheus Counter. Counters work by receiving increment or delta values.
When using a Counter, an add operation will be available in the language SDK, which must be provided with the non–negative number to increment the Counter by, along with an optional set of attributes to be attached. These attributes are similar to Prometheus labels.
An Asynchronous Counter differs by operating via callback rather than the add function. When the instrument is observed, the callback is executed and will pass back one or more measurements expressed as absolute values (not delta values). Once the values have been passed, they will be changed into delta values internally.
For example, you could implement an Asynchronous Counter that reports on the amount of CPU time the application has consumed since its start. This information would be extracted from the operating system in the callback and returned. Several values, one for each CPU or thread, could be returned at once. These measurements are always expected to be summable across attributes in a meaningful way (in this case, to get the total CPU time used for the system).
Please note that as the Python SDK is not yet stable, we need to import _metrics rather than metrics for the code examples in this post. There may also be some breaking changes in the future, we will keep this post up to date as things progress. The current examples were written with the OpenTelemetry Python SDK v1.11.1.
In Python, an example of creating and using a Counter and Asynchronous Counter would look like this:
from opentelemetry._metrics import get_meter_provider
from opentelemetry._metrics.observation import Observation

meter = get_meter_provider().get_meter("otel-demo")

# Counter
counter = meter.create_counter("counter")

# This adds 100 to the total (a delta value)
counter.add(100,{"app": "timescale"})

# Callback function for Async counter
def observable_counter_func() -> [Observation]:
    # This reports that the current value is 10, which will be
    # converted to a delta internally
    return [Observation(10, {"app": "timescale"}]

# Async Counter
observable_counter = meter.create_observable_counter(
    "observable_counter", [observable_counter_func]
)
UpDownCounter / Asynchronous UpDownCounter
An UpDownCounter is a similar synchronous instrument to a Counter, but it allows negative delta values to be passed (it’s not monotonic). Where a Counter would be suited to represent the number of jobs that had been submitted, an UpDownCounter would be perfect to represent the current number of active jobs being processed (it can move up and down). It’s important to note that this is not used identically to a Gauge in Prometheus, as we are recording changes, not absolute values.
An UpDownCounter presents an add operation that is identical to the Counter operation—with the exception that it accepts negative data values. Values correlated by attribute data are expected to be able to be summed.
Unsurprisingly, an Asynchronous UpDownCounter provides a callback interface that returns one or more measurements, expressing each measurement as an absolute value which will be changed to a delta value internally.
The OpenTelemetry spec notes that an UpDownCounter should not be used when the value being returned can easily be observed. In that case, an Asynchronous UpDownCounter should be used instead.
In Python, an example of creating and using an UpDownCounter and Asynchronous UpDownCounter would look like this:
from opentelemetry._metrics import get_meter_provider
from opentelemetry._metrics.observation import Observation

meter = get_meter_provider().get_meter("otel-demo")

# UpDownCounter
up_down_counter = meter.create_up_down_counter("up_down_counter")

# This adds 100, then removes 10 from the total (both delta values)
up_down_counter.add(100,{"app": "timescale"})
up_down_counter.add(-10,{"app": "timescale"})


# Callback function for Async counter
def observable_up_down_counter_func() -> [Observation]:
    # This reports that the current value is 10, which will be
    # converted to a delta internally
    return [Observation(10, {"app": "timescale"})]

# Async UpDownCounter, note the observable prefix
observable_up_down_counter = meter.create_observable_up_down_counter(
    "observable_up_down_counter", [observable_up_down_counter_func]
)
Histogram
A Histogram is a synchronous instrument which allows the recording of multiple values that are statistically relevant to each other. You would choose a Histogram when you don’t want to analyze data points in isolation, but would rather generate statistical information about their distribution by tracking the number of values that fall in each predefined bucket, as well as the minimum and the maximum value (if configured to do so).
Histograms have a single method that is exposed: record. Record takes a non–negative observation value and an optional set of attributes to be attached.
You might select a Histogram when you are looking at HTTP response times—knowing the exact response time of each request as it happens might not be that useful (and is much more suited to trace data, which would expose the start and finish times of each request), but being able to report on the median response time and the amount of HTTP requests above the 95th percentile might be more interesting from a service-level perspective.
It’s important to note that recording the measurements doesn’t create the Histogram; the default aggregation (Explicit Bucket Histogram Aggregation) does. When using a Histogram instrument, it’s important to make sure the buckets are also configured. The defaults are [ 0, 5, 10, 25, 50, 75, 100, 250, 500, 1000 ], and that’s not always ideal. You can see some examples of creating a view in the following paragraphs.
In Python, an example of creating and using a Histogram would look like this:
from opentelemetry._metrics import get_meter_provider
from opentelemetry._metrics.observation import Observation

meter = get_meter_provider().get_meter("otel-demo")

# Histogram
histogram = meter.create_histogram("histogram")

# This records a value of 100
histogram.record(100,{"app": "timescale"})
Asynchronous Gauge
An Asynchronous Gauge is unique in the OpenTelemetry API in two ways: it does not have a synchronous counterpart, and is designed to represent values that do not make sense to sum, even if they share attribute data. An example of this would be the temperature in various rooms of a house. This is common data, but it does not make any sense to report it as a total value—you’d potentially want an average or maximum, but never a sum. This is a different approach to Prometheus, which encoded these types of requirements into the metric naming conventions. In OpenTelemetry, if you use an Asynchronous Gauge, you will not be able to aggregate it as with all other metric types.
In the same manner, as all Asynchronous instruments, a callback is passed when creating an Asynchronous Gauge, which can return one or more (in this case completely discrete) measurements.
In Python, an example of creating and using an Asynchronous Gauge would look like this:
from opentelemetry._metrics import get_meter_provider
from opentelemetry._metrics.observation import Observation

meter = get_meter_provider().get_meter("otel-demo")


# Callback function for Async gauge
def observable_gauge_func() -> [Observation]:
    # This reports that the current value is 10
    return [Observation(10, {"app": "timescale"})]

# Async Gauge, note the observable prefix
observable_gauge = meter.create_observable_gauge(
    "observable_gauge", [observable_gauge_func]
)
Views and Aggregations
A View in OpenTelemetry defines an aggregation, which takes a series of measurements and expresses them as a single metric value at that point in time. As more measurements are created, the metric is continuously updated. If there is no View created for an Instrument, then a default aggregation is selected based on the Instrument type. Custom views can be targeted by Meter name, Instrument name, Instrument type, or with a wildcard.
There are three aggregation types available in OpenTelemetry:
- Sum Aggregation: it simply tracks the sum of the incoming measurements (respecting the monotonicity of the input Instrument).
- Last Value Aggregation: it tracks the last value reported.
- Explicit Bucket Histogram Aggregation: it tracks the number of measurements that fall into each configured bucket (which must be predefined when the View is created), and can track the minimum and maximum value.
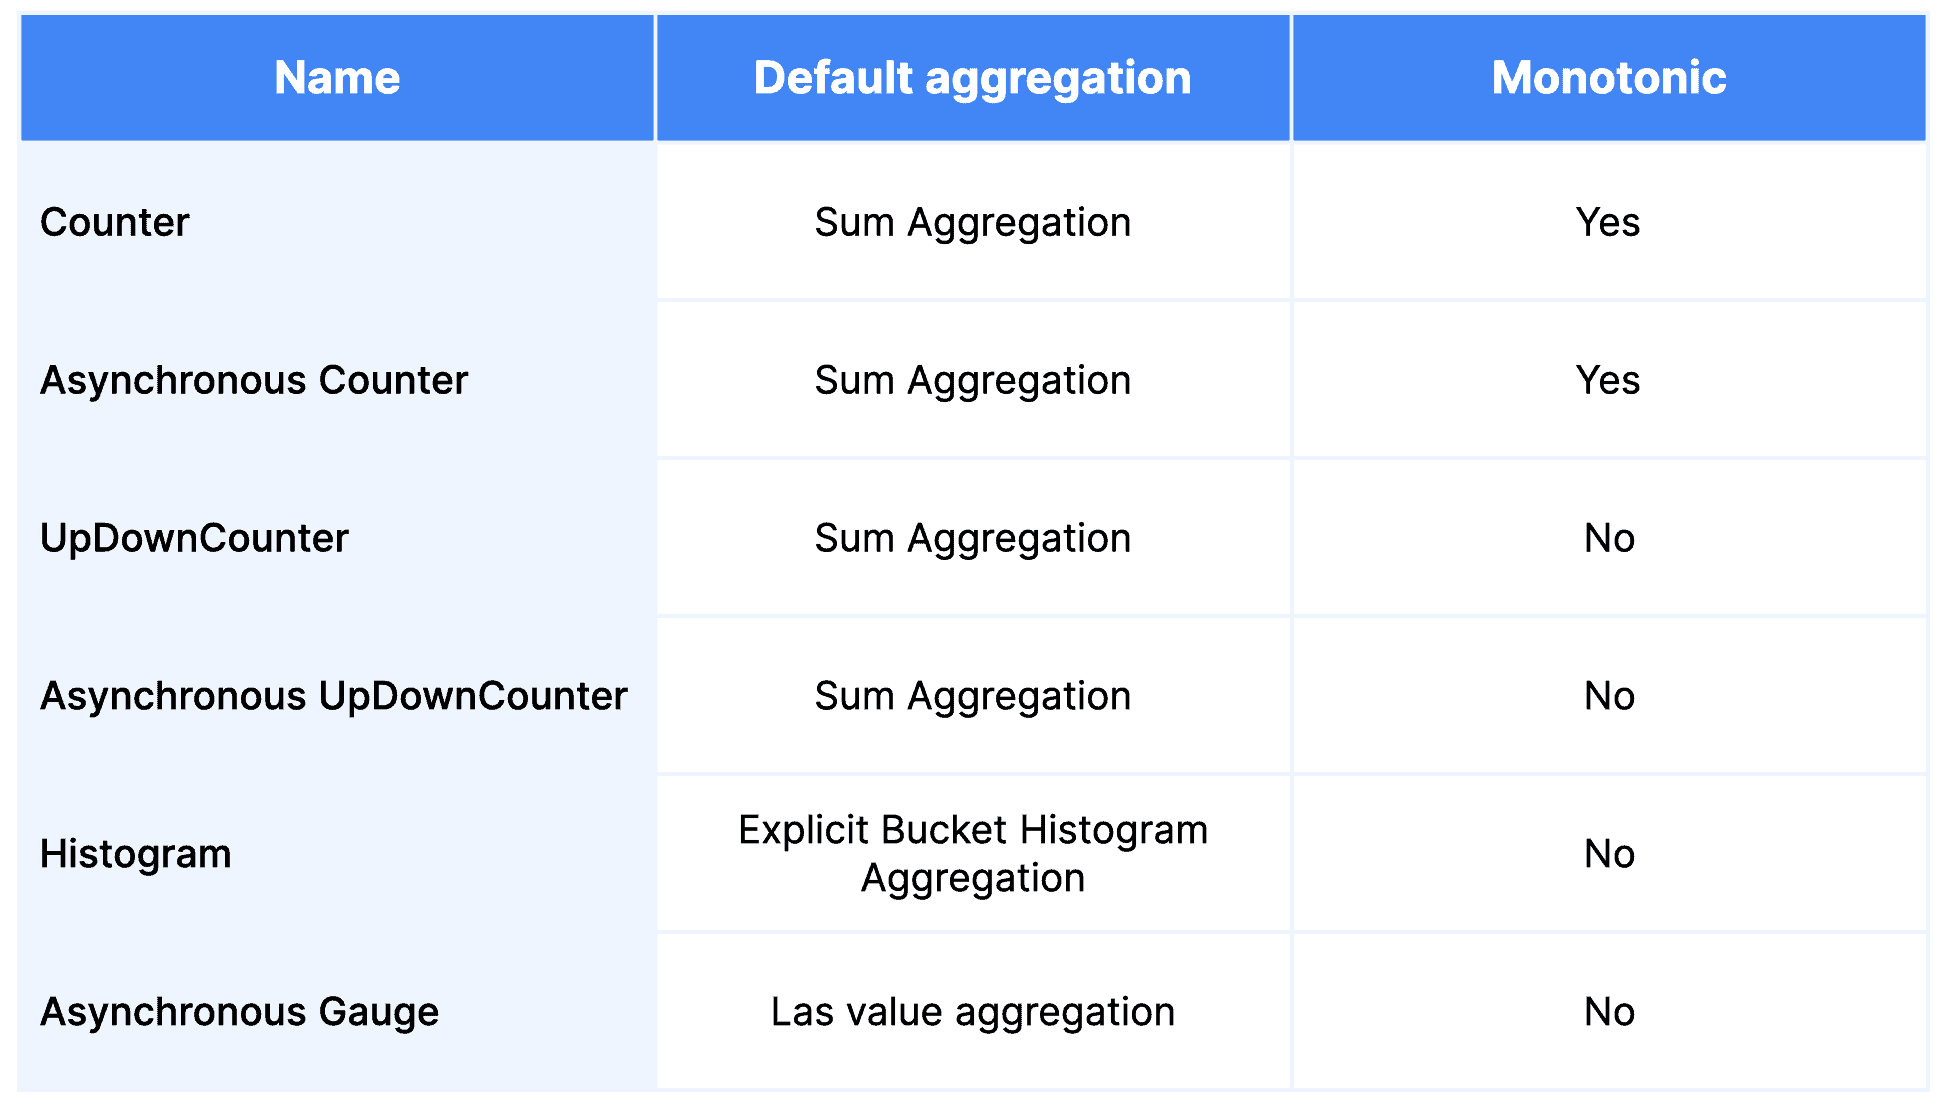
The following table defines the default aggregation for each Instrument type:
This Python code uses the ConsoleMetricExporter to write to the console, also changing the bucketing for all histogram Instruments:
from opentelemetry._metrics import get_meter_provider, set_meter_provider
from opentelemetry.sdk._metrics import MeterProvider
from opentelemetry.sdk._metrics.export import PeriodicExportingMetricReader
from opentelemetry.sdk._metrics.export import ConsoleMetricExporter
from opentelemetry.sdk._metrics.aggregation import ExplicitBucketHistogramAggregation


exporter = ConsoleMetricExporter()
reader = PeriodicExportingMetricReader(exporter)
provider = MeterProvider(
    metric_readers=[reader],
    views=[View(
        instrument_name="*”,
        aggregation=ExplicitBucketHistogramAggregation(
            (1,20,50,100,1000)
    ))],
)
set_meter_provider(provider)
Summing It Up
In this second part of our blog post series on metrics, we discussed the OpenTelemetry standard, focusing on its six instrument types: counters, asynchronous counters, UpDownCounters, asynchronous UpDownCounters, histograms, and asynchronous gauges.
In the final blog post of the series, we will cover how this model compares to Prometheus, explain the differences, and share our personal recommendations on when to consider one or the other.