Community post by Uchechukwu Obasi
Coming from a background working as a frontend developer at Grafana I’m no stranger to open source performance monitoring. I was part of a team that was responsible for the overall user experience of Grafana and performance was one of the key considerations. Along the line, I learned about a debugging technique known as profiling for monitoring application performance and fell in love ever since.
What is continuous profiling
“Profiling” is a dynamic method of analyzing the complexity of a program, such as CPU utilization or the frequency and duration of function calls. With profiling, you can locate exactly which parts of your application are consuming the most resources. “Continuous profiling” is a more powerful version of profiling that adds the dimension of time. By understanding your system’s resources over time, you can then locate, debug, and fix issues related to performance.
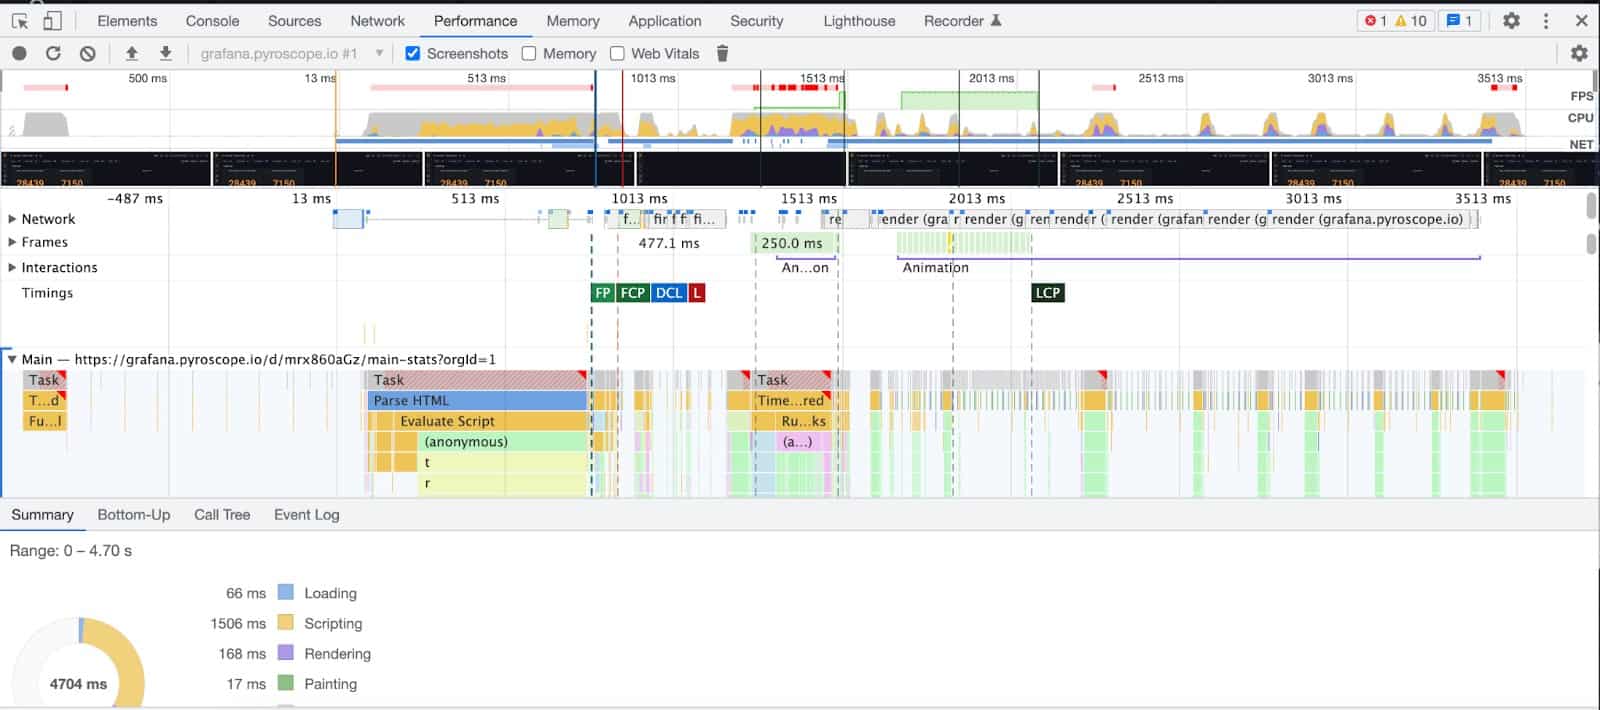
As a frontend developer, my experience with profiling was limited to the browser. However, in the course of my study, I discovered a new pattern of profiling that seems exciting– continuous profiling. Similar to how you use the profiler in the dev console to understand frontend performance issues, continuous profiling allows you to profile servers from various languages 24/7 and be able to understand resource usage at any particular time.
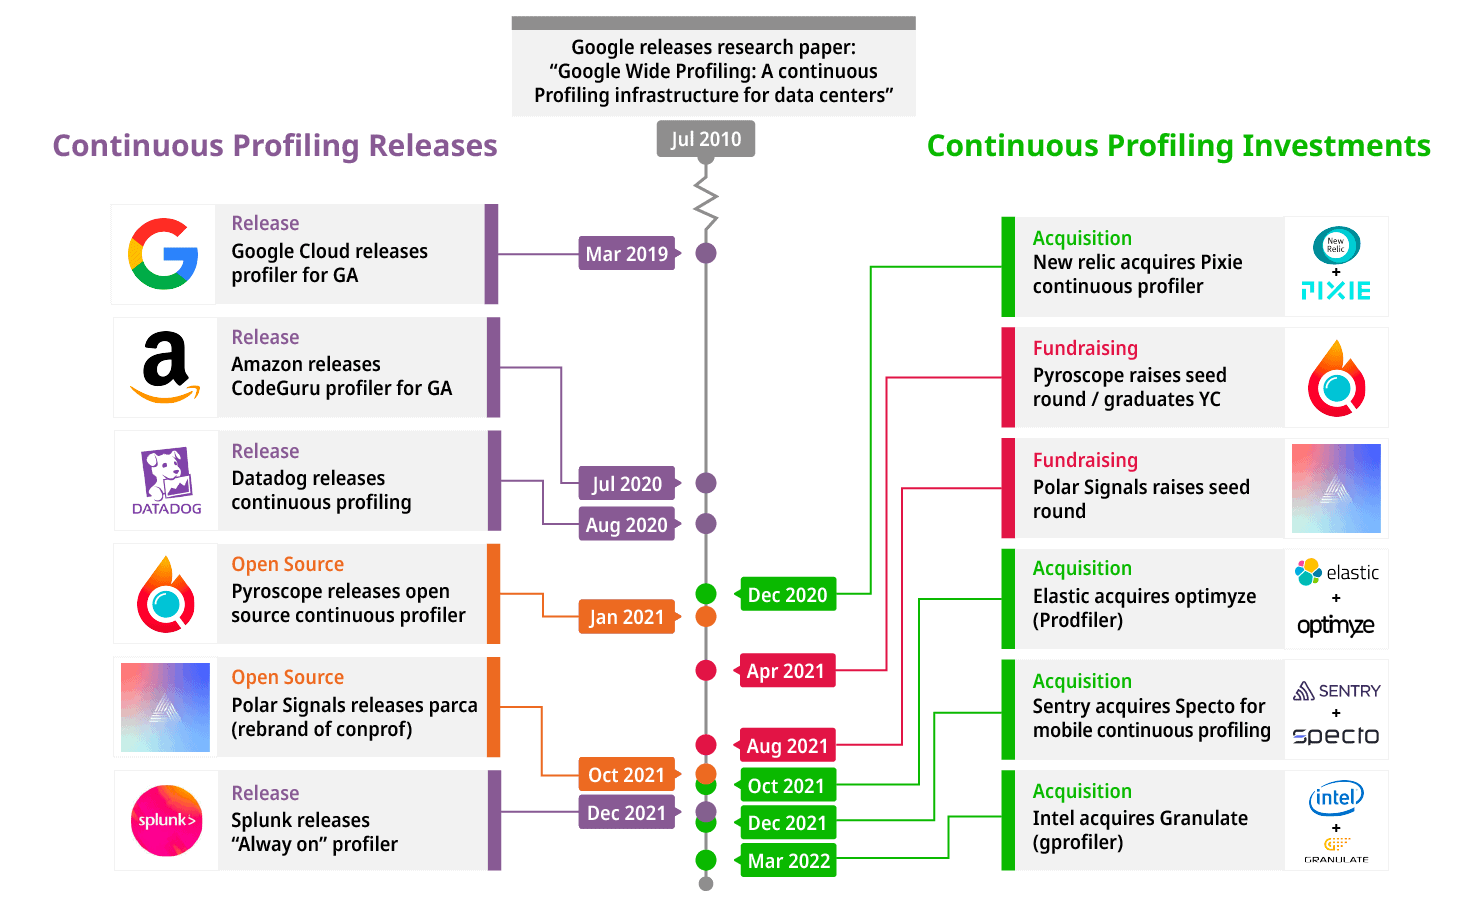
While continuous profiling is new to many, the concept is actually relatively old. In 2010, Google released a paper titled “Google Wide profiling: A continuous profiling infrastructure for data centers” where they make the case for the value of adding continuous profiling to your applications.
Industry traction for continuous profiling
Since then, many major performance monitoring solutions have joined them in releasing continuous profiling products. As time has gone on, the continuous profiling space has been getting increasingly popular as various companies/VCs are more frequently making major investments in Continuous Profiling to keep up with demand for this type of monitoring.
It’s not just major cloud providers and venture capitalists who are excited about continuous profiling, our industry leaders are super pumped about continuous profiling too!
Chris Aniszczyk, CTO of the Cloud Native Computing Foundation (CNCF) agrees that continuous profiling is an integral part of the observability stack.
This poll by Michael Hausenblas, solution engineering lead at AWS is good evidence that continuous performance profiling is becoming a culture for most engineering teams.
Even Carl Bergquist, Principal Engineer at Grafana, predicts that the popular FOSDEM conference will see more profiling talks moving forward.
And like Liz Fong-Jones, Principal developer advocate at Honeycomb, many in the tech world are “buzzing” about continuous profiling!
Simply put, continuous profiling is the future of application performance assessment
Continuous profiling using Pyroscope
At Pyroscope, we actually profile our own servers using Pyroscope and have found many cases where profiling has saved us a lot of time and money by identifying performance issues. That being said, at any organization, understanding resource utilization and adjusting to allocate it efficiently can be the difference between a healthy company with happy end-users (and employees) or a chaotic one where everyone is running around putting out fires and end-users are suffering.
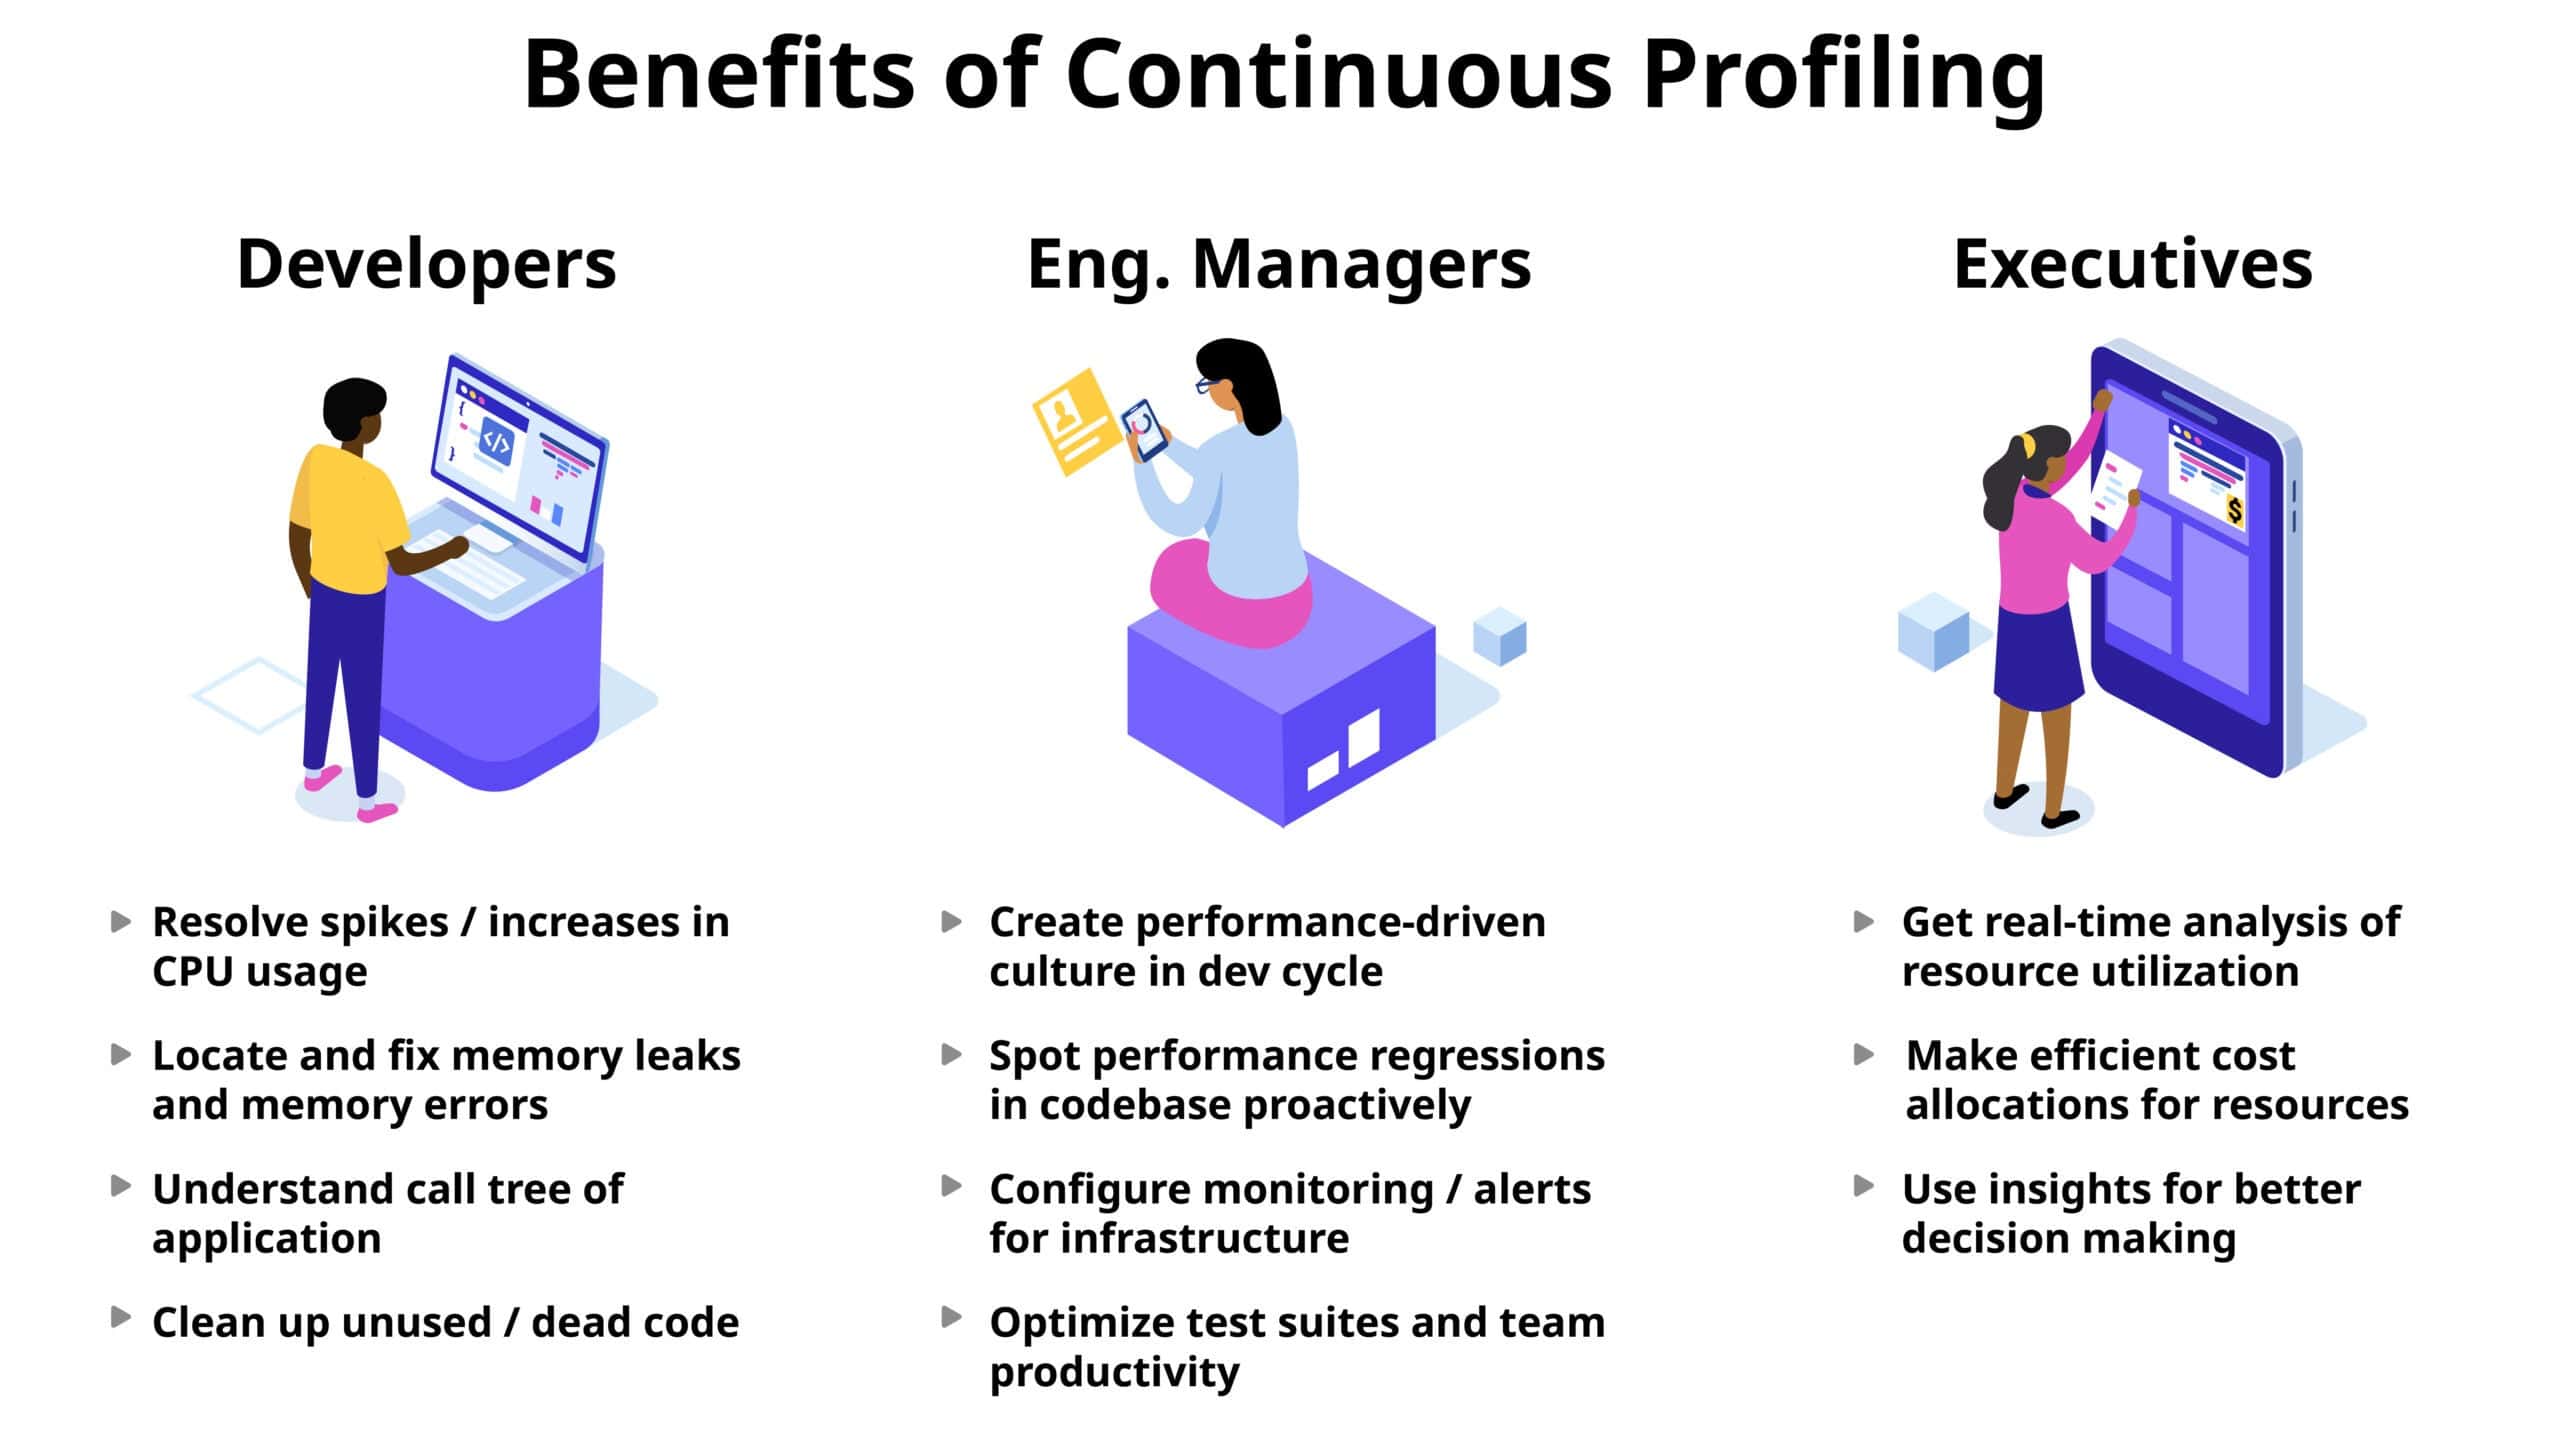
There is no better tool than continuous profiling to help be the difference-maker in these situations. No matter what your job function is in your organization there are still very valuable benefits of having continuous profiling as part of your observability stack.
Pyroscope also provides you with multi-language support, ad-hoc profiling, profile sharing, and more!
What makes Pyroscope unique?
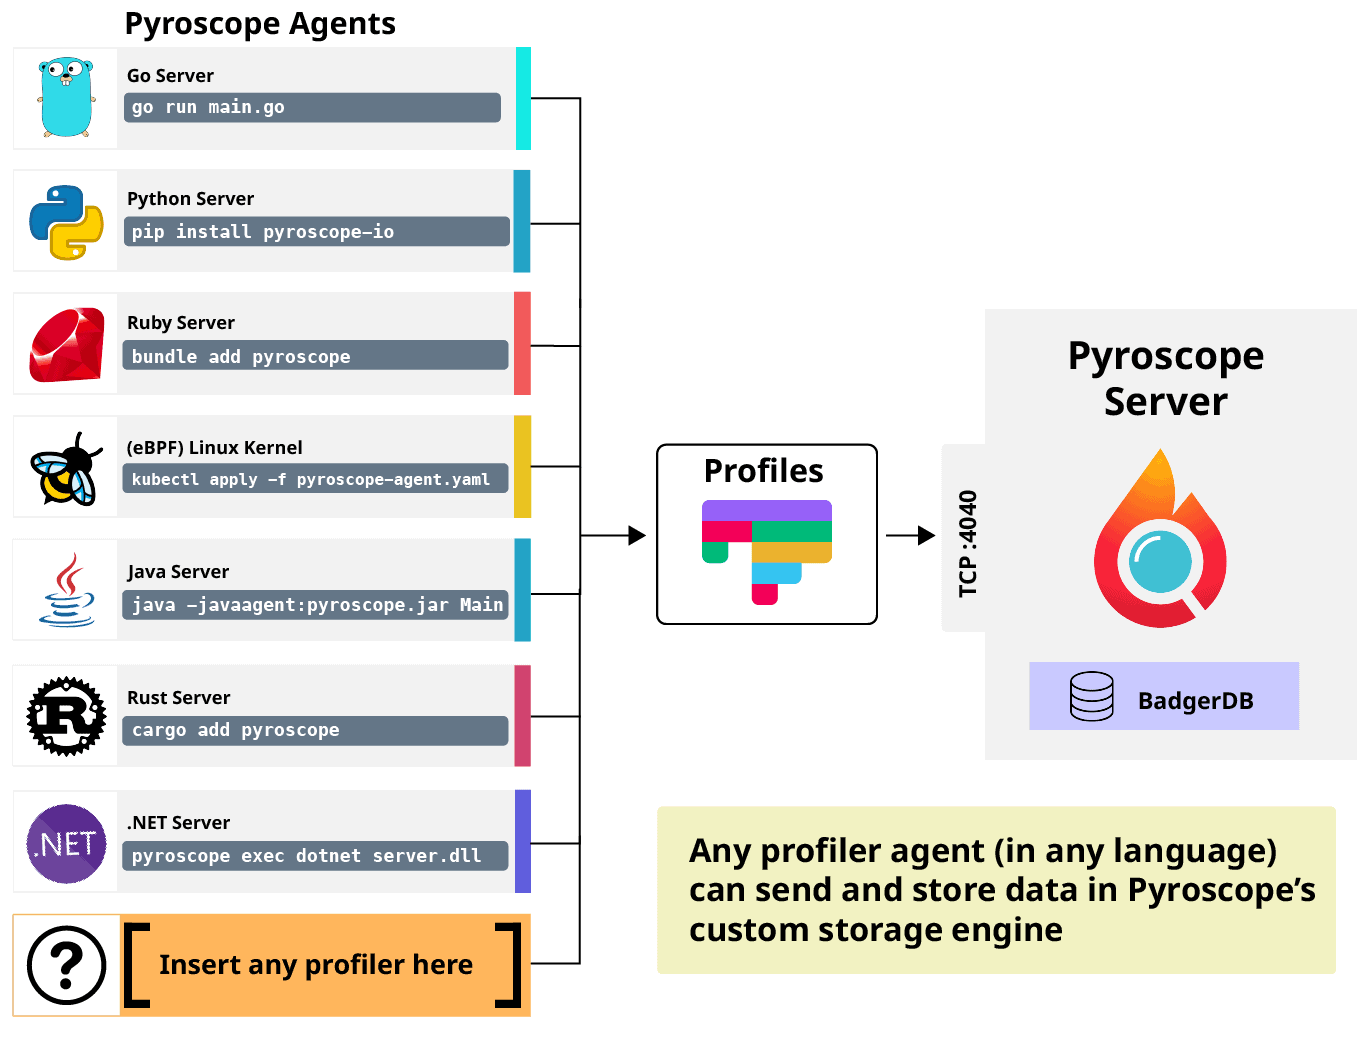
Pyroscope is open-source which means that it’s easier to get started and try out than cloud providers profilers. Pyroscope’s custom storage engine is language-agnostic so any profiling data ranging from rbspy to eBPF to even new profilers such as Bloomberg’s Memray can easily send data to Pyroscope and have it compressed, stored and queried efficiently.
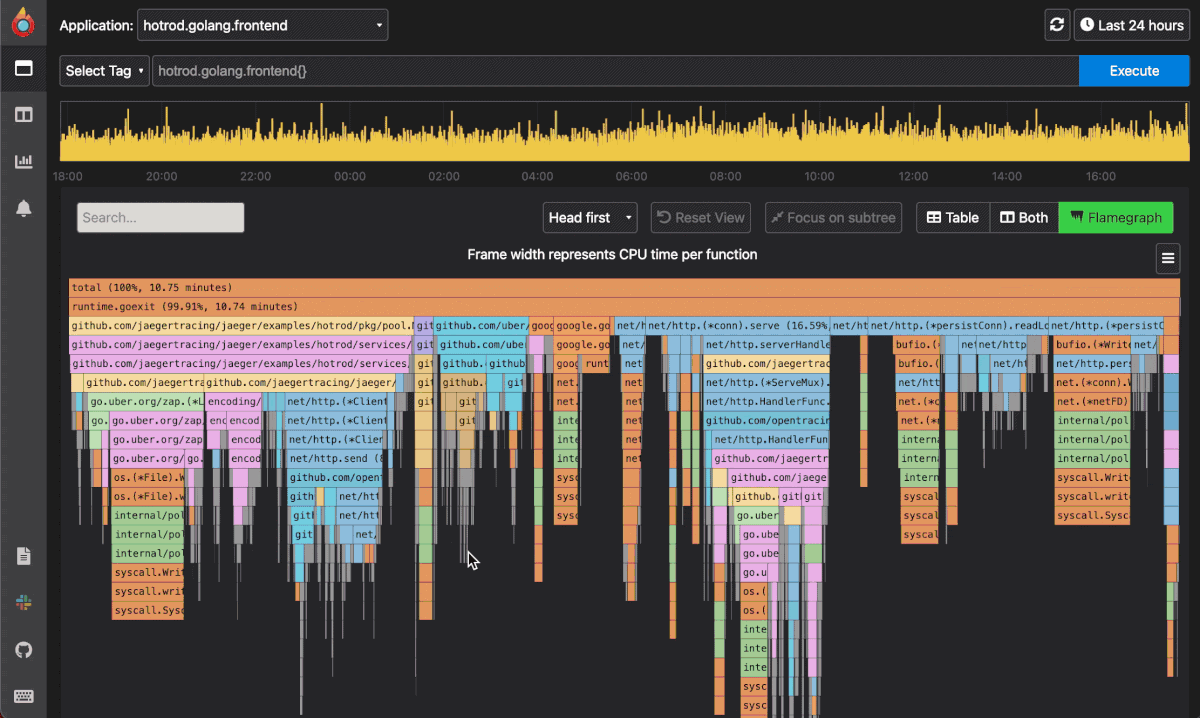
Pyroscope is also built to be easy to use by everyone. The pyroscope UI in particular was designed to be super intuitive for anyone to play around, analyze, and understand profiles.
Whether you are operating at a small scale or enterprise level, the power of continuous profiling can quickly and easily reduce infrastructure costs and improve scalability. With Pyroscope, you can build high-performance applications that increase customer satisfaction and put value back into your business.
How to get started with Pyroscope
Coming in as being relatively new to profiling myself, the easiest way for me to get started with continuous profiling was to install pyroscope. To learn how to use continuous profiling in your code or application, I would suggest you run the most relevant dockerized example from the examples folder on GitHub or you can take a look at the installation guide here.
Pyroscope has offered me useful features that make profiling fun and exciting. With Pyroscope, I’ve been able to understand how my application, server, and code are running. The best part is that I can use Pyroscope without paying any money; it’s completely free!
If you need any help getting started, join the community slack or follow Pyroscope on Github and Twitter!