


Guest post originally published on the Scout APM blog by Dave Anderson, CTO, Scout APM

Before we dive into the Collector, let’s cover the components that make up the OpenTelemetry project. Scout’s blog post “What is OpenTelemetry” gives a high-level introduction to OpenTelemetry and the key components of the OpenTelemetry project:
- OpenTelemetry Specification
- Language specific API and SDK libraries
- OpenTelemetry Collector
The OpenTelemetry collector is optional when using a SaaS service like Scout. Even so, knowing what the Collector can do and when to use it is helpful to understand.
In this post, we’ll talk about how data can be sent to the Collector and what the Collector does with it.
WHAT IS THE OPENTELEMETRY COLLECTOR
The OpenTelemetry Collector is an application written in Go. The GitHub readme does an excellent job of describing the collector:
The OpenTelemetry Collector offers a vendor-agnostic implementation on how to receive, process and export telemetry data. In addition, it removes the need to run, operate and maintain multiple agents/collectors in order to support open-source telemetry data formats (e.g. Jaeger, Prometheus, etc.) sending to multiple open-source or commercial back-ends.
Objectives:
Usable: Reasonable default configuration, supports popular protocols, runs and collects out of the box.
Performant: Highly stable and performant under varying loads and configurations.
Observable: An exemplar of an observable service.
Extensible: Customizable without touching the core code.
Unified: Single codebase, deployable as an agent or collector with support for traces, metrics and logs.
So the OpenTelemetry collector is a Go binary that does exactly what its name implies: it collects data and sends it to a back-end. But there’s a lot of functionality that lies in between. Let’s dive into the components of the collector.
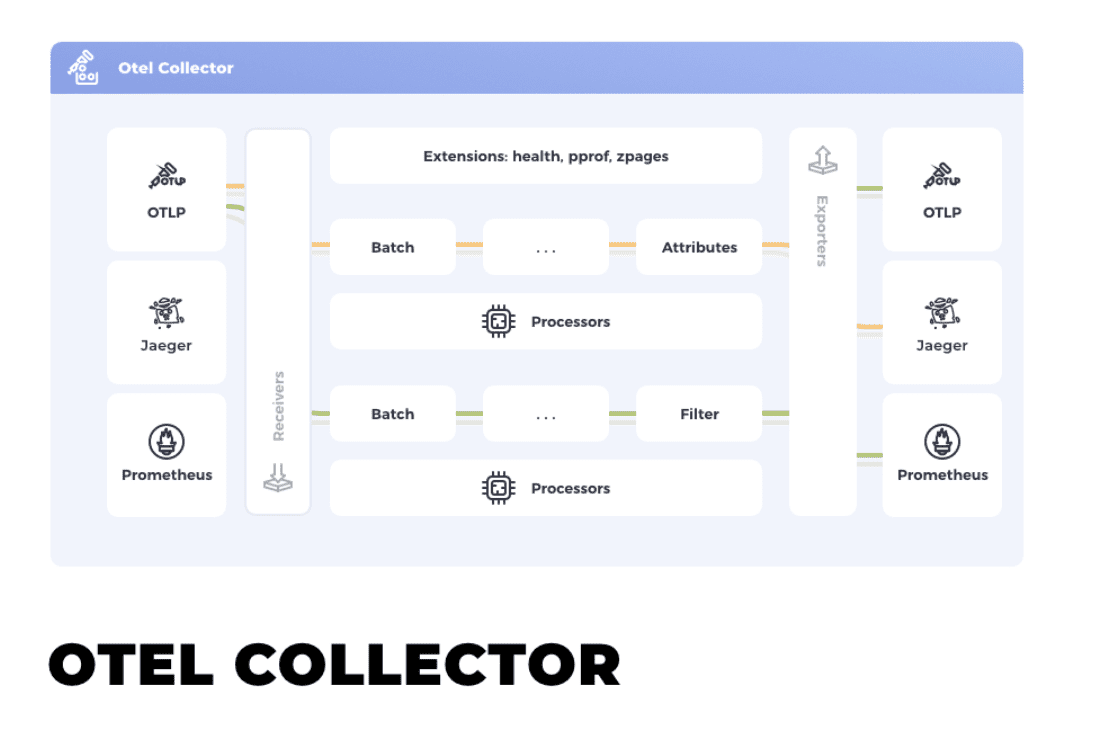
RECEIVERS – GETTING DATA INTO THE COLLECTOR
OpenTracing aims to support telemetry data in the forms of Metrics, Traces, and Logs (and even more types in the future). Out of the box, the Collector has multiple Receivers that are available to accept these telemetry types:
Metrics
- Prometheus
- OpenCensus
- OTLP – The OpenTelemetry Line Protocol
Traces
- Jaeger
- Kafka
- OpenCensus
- Zipkin
- OTLP
Logs
- Fluent
- OTLP
If you’re an application developer and want to use the OpenTelemetry SDK to send application traces to a locally installed Collector, you can simply set an environment variable to send the traces via OTLP to the collector. If you have the OpenTelemetry Collector running locally on port 55681, you would set the variable like so: OTEL_EXPORTER_OTLP_TRACES_ENDPOINT=http://localhost:55681/v1/traces.
PROCESSORS – PROCESSING DATA WITHIN THE COLLECTOR
Processors are modules within the Collector that can perform calculations, create new data, transform, remove, filter, sample, replace, or perform any number of different functions on the data received.
Processors are Go modules. There are a few that are included by default with the Collector, and you can find more in the Collector Contrib repo. You can also easily write your own processor.
EXPORTERS – SENDING THE DATA TO A BACKEND
The Collector is not meant to be the final destination of your telemetry data. Exporters are how the Collector sends the data to one or more backends. There are many exporters available for each type of telemetry data flowing through the Collector:
Metrics
- File (write the data to a local file)
- Logging (write the data to STDOUT)
- OpenCensus
- OTLP
- Prometheus
Traces
- File
- Logging
- Jaeger
- Kafka
- OpenCensus
- OTLP
- Zipkin
Logs
- File
- Logging
- OTLP
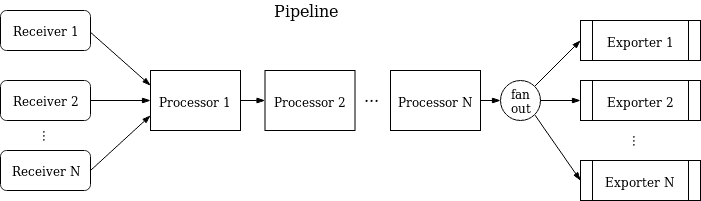
PIPELINES – TYING IT ALL TOGETHER
Receivers, Processors, and Exporters are grouped into Pipelines defined through the Collector’s configuration file. A Pipeline defines a path for how the data is received from a Receiver, processed through one or more Processors, and ultimately leaves the Collector via one or more Exporters.
There are infinite possible ways to configure pipelines that can do nearly anything you wish to the data that’s flowing through the Collector.
SUMMARY
We’ve covered the main components of the OpenTelemetry collector, but we’ve barely scratched the surface of what can be accomplished with this amazingly flexible tool. In the next post, we’ll cover deployment patterns, configuration, and put together some example Pipelines to highlight the power of the OpenTelemetry Collector.