

Guest post originally published on Chronosphere’s blog by Gibbs Cullen
This blog is primarily a recap of the workshop led by Anurag Gupta, co-founder of Calyptia and Fluent maintainer, and myself at FluentCon North America 2021 titled “Hands on Workshop: Getting Started With Fluent Bit and Metrics With M3DB.” To help set the context for the workshop, we have also included an overview of the Fluent technologies, as well as an update around recent developments within the Fluent ecosystem.
In terms of the motivation behind pairing M3DB with Fluent Bit for the workshop, Anurag explains how “M3DB’s ability to store long term metrics data at large scale makes it a great option for demonstrating Fluent Bit’s new capabilities, especially with M3DB’s Prometheus compatibility and proven effectiveness in the largest enterprises. We are excited to extend Fluent Bit’s support for Prometheus metrics to empower all of these users immediately.”
While M3DB was chosen for the workshop, Fluent Bit’s recent support for Prometheus metrics can be utilized by any Prometheus compatible solution. To learn more about the Fluent ecosystem and the workshop, check out the full session recording and workshop instructions.
What’s new with the Fluent ecosystem?
The Fluent ecosystem, made up of CNCF-graduated projects Fluentd and Fluent Bit, recently added support for Prometheus and Open Metrics. While Fluentd provides a unified logging layer for industry standard backend data sources, Fluent Bit works to process and forward this data.
Both projects have historically focused on log-based metrics, but with the latest versions (post 1.8) they are now compatible with Prometheus metrics.
Fluent Bit and metrics
When Fluent Bit was created back in 2015, one of its primary use cases was embedded Linux with plug-ins for log-based metrics like CPU, disk, and memory. However, with the rapidly increasing Prometheus ecosystem, Fluent Bit was no longer compatible with newer metric backends, and the old log-based metrics were much heavier (byte wise) compared to the standard Prometheus format.
While Prometheus integrations are not new to Fluent Bit, exposing internal metrics via the Prometheus format since 2019, the latest release (version 1.8) has continued the efforts by adding compatibility to newer metric backends. A few of these developments include:
- Exposing new node exporter metrics (e.g. CPU, network, disk) following the same format and exposition as Prometheus node exporter
- Prometheus remote write (push) and Prometheus exporter (pull) as new metric outputs
See the full release notes for more information on version 1.8.
Fluent Bit and M3
M3 is an open-source metrics engine designed to be fully Prometheus remote storage and PromQL compatible. This means it can accept metrics via Prometheus remote write, which Fluent Bit supports with the 1.8 release.
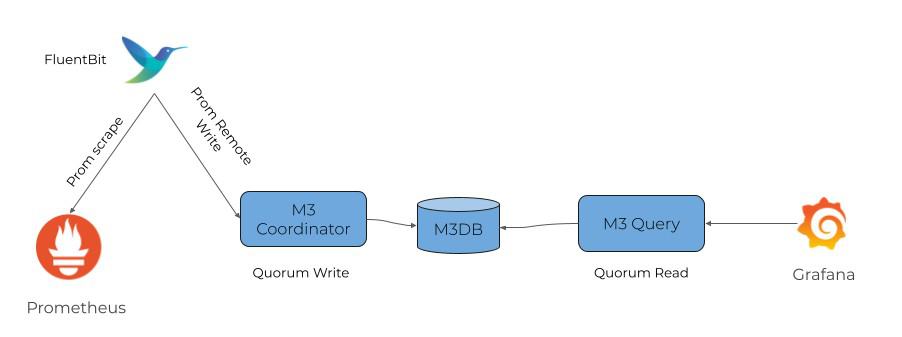
To demonstrate these changes to the ecosystem, Anurag and I set up a workshop to spin up a Fluent Bit agent alongside instances of M3 Coordinator, M3 Query, and M3DB via a Docker compose file. This file also included instances of Grafana and Prometheus.
In terms of the architecture, the Prometheus instance is configured to scrape itself along with node exporter metrics from the Fluent Bit agent, which are compatible with the Prometheus exporter format. From there, the M3 Coordinator receives these metrics via Prometheus remote write before distributing them to M3DB using quorum logic. M3 Query is used to query this data from M3DB via Grafana. Within the instance of Grafana, you can then see all of your Prometheus metrics.
The Fluent Bit configuration also shows how the output of the agent uses Prometheus remote write and Prometheus exporter to send node exporter metrics to the M3 Coordinator:
[INPUT]
    name            node_exporter_metrics
    tag             node_metrics
    scrape_interval 2

[OUTPUT]
    name            prometheus_exporter
    match           node_metrics
    listen          0.0.0.0
    port            2021
    add_label       app fluent-bit-exporter

[OUTPUT]
    Name            prometheus_remote_write
    Match           node_metrics
    Host            m3coordinator
    Port            7201
    Uri             /api/v1/prom/remote/write
If wanting to manage or monitor these metrics are large scale, a solution like M3 can help with efficiency and reliability through it’s downsampling and streaming aggregation tier, as well as it’s default data replication (3x) and optimized compression algorithm for indexing metrics within M3DB.
What’s next?
If you are interested in learning more, watch the full session recording and try the step-by-step instructions from the workshop. To stay up to date with the Fluent and M3 ecosystems, make sure to join the Fluent and M3 community Slack channels. We hope to see you at a future FluentCon!