Guest post originally published on Chronosphere’s blog by Ryan Allen
When running M3DB, it is important to monitor the cluster’s health to understand how queries are performing and if the cluster requires additional resources to handle the volume of data being written to it. Some key M3DB health metrics include memory utilization of each node in the cluster and query latencies for how long queries are taking.
These metrics revealed a pattern of the database reliably and periodically suffering from inflated memory and deteriorated query latencies.
Problem: Huge, frequent memory spikes
One example below shows how memory usage for nodes in a cluster would spike up by 20-60% every 2 hours. This spiky behavior is problematic because it requires we provision these nodes with enough memory to support the peaks, even though the majority of the time the nodes require much less. That means we’re paying for memory that most of the time we aren’t utilizing – and we only pay for this to prevent running out of memory during these peak intervals.
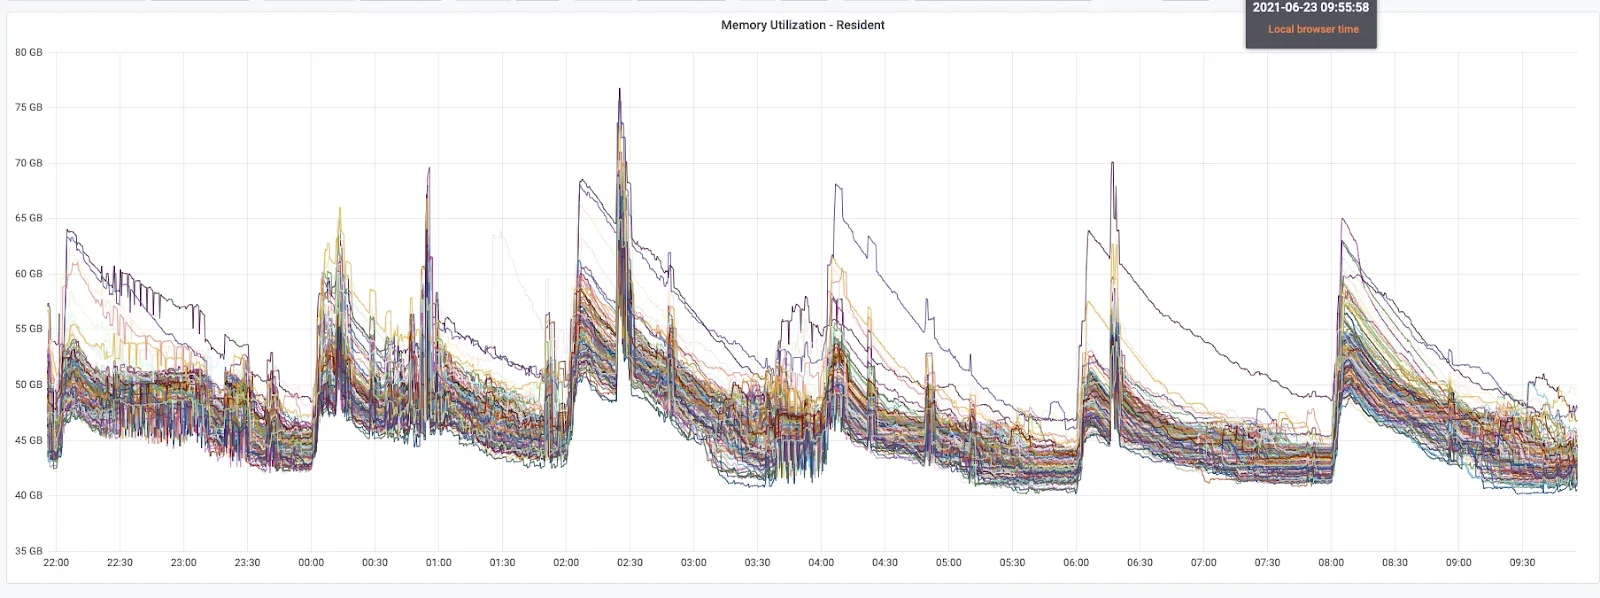
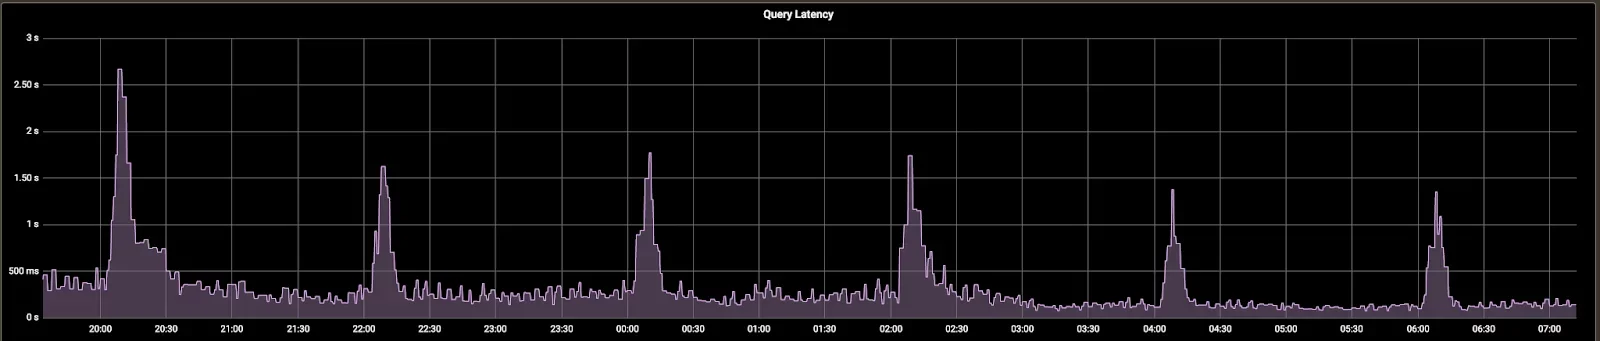
Additionally, these periodic memory spikes were exactly correlated with spikes in query latencies.
The curiously periodic nature of these performance degradations led our team to investigate what operations within the database were to blame, and ultimately resolve this behavior to achieve more consistent memory utilization and query speeds.
The Cause: Block rotation
Why was it that every 2 hours we were seeing these performance degradations? Given this cadence, we theorized that the cause, and verified via heap profiles, was a process in the database referred to as a block rotation, which happens every 2 hours. To understand what a block rotation is, first we must understand the database’s index and the index’s blocks.
What is the database index?
In M3DB, when a database node receives a query request, executing that query involves two steps:
- Find all series IDs that match the query expression (OSS)
// QueryIDs resolves the given query into known IDs.
QueryIDs(
     ctx context.Context,
     namespace ident.ID,
     query index.Query,
     opts index.QueryOptions,
) (index.QueryResult, error)- Read datapoints for each series ID (OSS)
// ReadEncoded retrieves encoded segments for an ID.
ReadEncoded(
     ctx context.Context,
     namespace ident.ID,
     id ident.ID,
     start, end xtime.UnixNano,
) (series.BlockReaderIter, error)
M3DB’s index is used in step 1 to go from a query (e.g. specific tags and values) to a set of matching series IDs. For example, a query http_request{status_code=~”200|500”} could return from the index the following series results:
{__name__=http_request,status_code=200,service=a}
{__name__=http_request,status_code=200,service=b}
{__name__=http_request,status_code=500,service=a}
{__name__=http_request,status_code=500,service=b}
In order to perform this matching, the index accumulates the set of all distinct series IDs over time as data is written. This means that every new series write that occurs involves an update to the index – whereas a subsequent write for an existing series does not need to update the index since the series ID already is present and searchable for that write.
What is an index block?
Having a single data structure on-disk that contains all series IDs and their tags for all time would be too slow to search. Series IDs / Tags are therefore stored into blocks of time. That way, a given query only must check all blocks within the query’s start/end range, limiting the search space.
For example, below shows 2 hour index blocks and how a query only must search a subset of them based on the query range.

What is a block rotation?
A consequence of breaking the index up into blocks of time is that we incur a cost whenever time elapses beyond the previous latest block to a new one. This process of opening a new latest block is referred to as a block rotation.
For example, say we have the following series [A,C,D] being actively written to in the latest block.
![[A,C,D] being actively written to in the latest block.](https://www.cncf.io/wp-content/uploads/2022/07/latency359.webp)
As soon as the clock strikes 4:00pm, that incoming data now belongs in a new block, and so a new empty block is created.

Since the new block is initially empty, it very rapidly gets seeded with the distinct series that are actively being written to.

Why is it so costly, though, to populate the new empty block? In the example above, having only three active series is not much of a burden to rapidly accumulate in a new block. However, large M3DB clusters can have millions of distinct series being written at any given time – and remember that the index must contain an entry for every new distinct series. That leads to an enormous amount of initial contention on the new block to insert each of these distinct series at the same time.
Not only do the writes lead to contention and back-up on the write path, populating the new block also disrupts the read path because queries must query for series IDs from this same new block. To make matters worse, the most common time range for a query is now (e.g. Jane the engineer wishes to know the error rate happening now, or alert XYZ wants to know if a latency metric has exceeded some threshold now). Since the majority of queries need to fetch data from now, the majority of queries have to read from the new index block after it gets created.
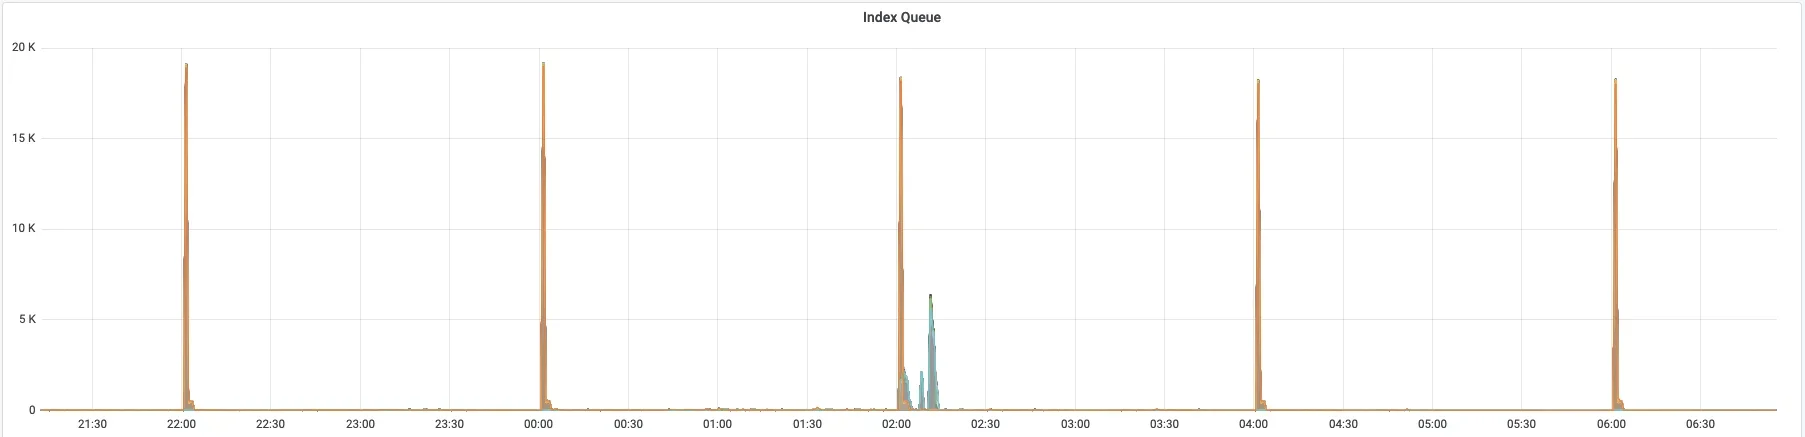
Additionally, for improved compression and speeding up evaluation of time series that match a given query, the actual data structure within an index block is an FST (finite state transducer) (i.e. a compressed trie to search for time series IDs). To achieve this compression and fast searching, the FST requires that all series be inserted in alphanumeric order (to build the trie) and also it must be reconstructed (to recompress) on each update. The cost of updating the FST makes it non-conducive to such aggressive mutation all at once. Below we see this cost in metrics for queued-up writes to the index upon each block rotation:
For more reading on FSTs in general, see this blog post by Andrew Gallant.
The Fix: Active index block
After understanding the problematic database operation to be the index’s block rotation, we knew we needed a fix that would (A) keep the data structured by blocks of time but also (B) pay a less severe penalty when transitioning to a new block.
Our new approach is to keep an “active” block around permanently that accepts all writes, even once a new block is opened. This way, we never have to rapidly seed a new block from empty to all active series. Instead, series are slowly accumulated over time as they are created. While this could mean that the “active” block indefinitely grows in size as new series are written, we address this by background garbage collecting old series that no longer are being written to.
The full active index block code change can be seen in this PR in the M3 open source repo.
Active block writes
To compare this change with the previous block rotation illustration, say we again have 3 actively written series [A,C,D] – but this time we also have the active block present.

Once time reaches 4:00pm, we again need to open a new block – however, writes continue to go into the active block instead of the new latest one.

The new latest block will eventually accumulate the relevant data by time, but it can happen in the background and more slowly, reducing the peak memory required.

To prevent indefinite growth, series that are no longer being written to will be removed from the active block in the background. In the previous example, since series [A,B,C,D] are in the active block, but only series [A,C,D] are being actively written to, series B will eventually be removed from the active block.
Active block reads
Now that all writes are directed to the active block, it is important that we also use this block for reads. This way, we can ensure results are present for series whose IDs are in the active block but not yet in their time-based block.

The Outcomes: Dramatic improvements
So … did it work? Happily we see dramatic improvements to the memory and query metrics that revealed this performance issue.
Here we see the memory transition of a cluster from before and after the active block change. Before the change, there is reliable memory spikiness every 2 hours, but afterwards we see steady memory.
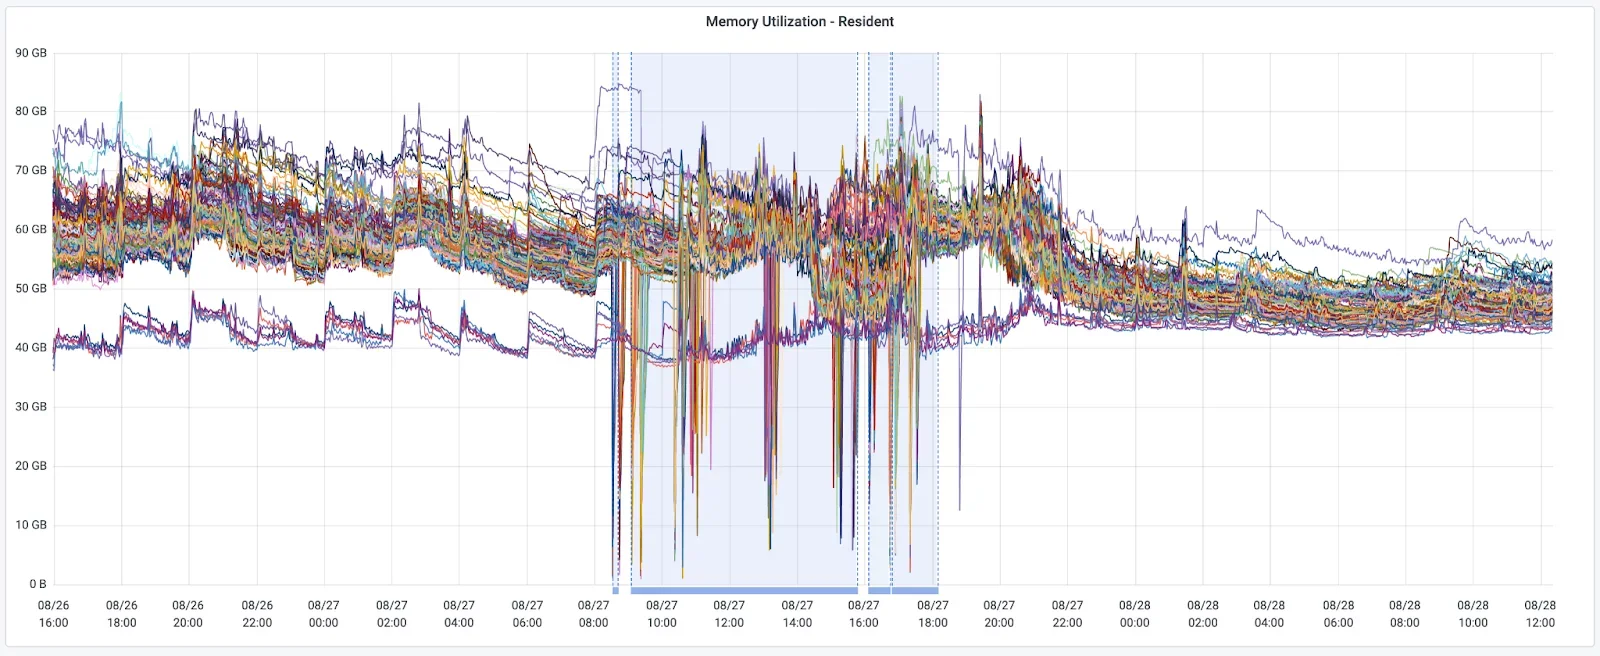
* The blue window indicates the period during which the change was deployed.
Additionally, we no longer see periodic degraded query latencies every 2 hours.
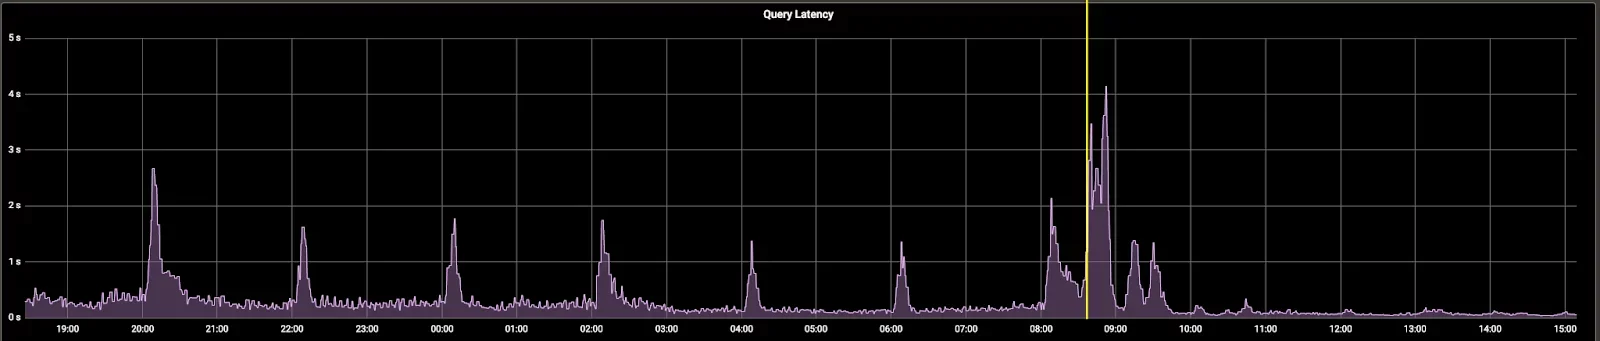
* The yellow line indicates the point of time when the change was deployed.
Importance of high-level tracking of memory and latencies
This performance improvement goes to show how important it is to monitor health metrics of systems! This issue was impacting users’ query experience – but only every so often. Someone could run a query at 4:00pm, and it could take well above average – but then run again a minute later and everything is fine. These types of issues are extremely difficult to be made aware of from anecdotal user reports – high-level tracking of memory and latencies is a much more systematic way of keeping an eye on these user-impacting issues.