


End User guest post by Ratnadeep Debnath, Site Reliability Engineer at Zapier


At Zapier, RabbitMQ is at the heart of Zap processing. We enqueue messages to RabbitMQ for each step in a Zap. These messages get consumed by our backend workers, which run on Kubernetes. To keep up with the varying task loads in Zapier we need to scale our workers with our message backlog.
For a long time, we had managed to scale with CPU-based autoscaling using Kubernetes native Horizontal Pod Autoscaling (HPA). In general, more tasks would lead to more processing, producing increased CPU usage, eventually triggering our workers’ autoscaling. It seemed to work pretty well, except for certain edge cases.
We do a lot of blocking I/O in Python (we don’t use an event-based loop in our workers written in Python). This means that we could have a fleet of workers idling on blocking I/O with low CPU profiles while the queue keeps growing unbounded, as low CPU usage would prevent autoscaling from kicking in. In a situation where workers are idle while waiting for I/O, we could have a growing backlog of messages that a CPU-based autoscaler would miss. This situation allowed a traffic jam to form and introduce delays in processing Zap tasks.
Ideally, we would like to scale our workers on both CPU and our backlog of ready messages in RabbitMQ. Unfortunately, Kubernetes’ native HPA does not support scaling based on RabbitMQ queue length out of the box. There is a potential solution by collecting RabbitMQ metrics in Prometheus, creating a custom metrics server, and configuring HPA to use these metrics. However, this is a lot of work and why reinvent the wheel when there’s KEDA.
What’s KEDA?
KEDA is a Kubernetes-based Event Driven Autoscaler aiming to make autoscaling dead-simple. With KEDA, you can drive the scaling of any container in Kubernetes by using one of the 40+ scalers that are available, including based on the pending messages in RabbitMQ.
KEDA is a single-purpose and lightweight component that can be added into any Kubernetes cluster. KEDA does all the autoscaling heavy-lifting in Kubernetes by extending Horizontal Pod Autoscaler’s and providing external metrics based on the used scalers. With KEDA you can easily define the apps you want to scale without changing the app itself, with other apps continuing to function. This makes KEDA a flexible and safe option to run alongside any number of any other Kubernetes applications or frameworks.
How do we use KEDA?
We have installed KEDA in our Kubernetes clusters and started opting into KEDA for autoscaling. Our goal is to autoscale our workers not just based on CPU usage, but also based on the number of ready messages in RabbitMQ queues they are consuming from.
Deployment
We deployed KEDA in our Kubernetes clusters using Helm. Here are the values we used for the KEDA Helm chart:
priorityClassName: system-cluster-critical
prometheus:
 enabled: true
 metricServer:
   enabled: true
   podMonitor:
     enabled: true
     namespace: keda
 operator:
   enabled: true
   podMonitor:
     enabled: true
     namespace: keda
   prometheusRules:
     enabled: true
     alerts:
       - alert: KedaMetricsServerDown
         expr: absent(up{job="keda-operator-metrics-apiserver"})
         for: 1m
         labels:
           severity: critical
         annotations:
           summary: "Keda metrics server is down"
       - alert: KedaScalerErrorsHigh
         expr: rate(keda_metrics_adapter_scaler_errors{}[5m]) > 0
         for: 1m
         labels:
           severity: critical
         annotations:
           summary: "Keda scaler errors is high for {{ $labels.namespace }}/{{ $labels.scaledObject }} {{ $labels.scaler }}"
       - alert: KedaScaledObjectErrorsHigh
         expr: rate(keda_metrics_adapter_scaled_object_errors{}[5m]) > 0
         for: 1m
         labels:
           severity: critical
         annotations:
           summary: "Keda scaledObject errors is high for {{ $labels.namespace }}/{{ $labels.scaledObject }}"

service:
 annotations:
   prometheus.io/path: /metrics
   prometheus.io/port: "9022"
   prometheus.io/scrape: "true"

resources:
 requests:
   cpu: "100m"
   memory: "100Mi"
 limits:
   cpu: "1"
   memory: "1000Mi"
Contributing a feature to KEDA
Since our workers read messages for a queue from multiple RabbitMQ hosts, we needed to scale based on ready messages for a queue on multiple RabbitMQ hosts. However, the KEDA RabbitMQ scaler in KEDA version 2.3.0 did not support defining triggers for the same queue for multiple RabbitMQ hosts because the KEDA RabbitMQ scaler auto-generated metric names using queue names.
KEDA is an open-source project, so we were able to add functionality to support our setup ourselves. Using the same pattern as other scalers (like Kafka), we revised how the metric names were generated and submitted the change to the KEDA maintainers. They were able to get this change reviewed, merged, and released as part of the 2.4.0 release. Kudos to the KEDA team for being so lovely and helpful.
Configuring autoscaling with KEDA
We added support for KEDA based autoscaling in our private Helm chart used to launch services on Kubernetes. All we need to do now is configure the autoscaling section in our Helm values for the service.
autoscaling:
    minReplicas: 3
    maxReplicas: 10
    keda:
      enabled: true
      rabbitmq:
        auth:
          vaultSecret: zapier/data/keda/rabbitmq
        servers:
          - "rabbitmq-1"
          - "rabbitmq-2"
      metrics:
        - type: cpu
          metadata:
            type: Utilization
            value: "82"
        - type: rabbitmq
          metadata:
            protocol: amqp
            queueName: celery
            mode: QueueLength
            value: "180"
This generates the necessary artifacts: ExternalSecret (external-secrets controller, https://github.com/external-secrets/kubernetes-external-secrets generates Kubernetes Secret from an ExternalSecret object by fetching secrets from Vault), TriggerAuthentications, ScaledObject for configuring autoscaling with KEDA for the service. In this example, the ScaledObject zapier-worker-celery tells KEDA to scale zapier-worker-celery deployment on the following triggers:
- when CPU utilization for a pod is 82%
- When the number of Ready messages in celery queue in rabbitmq-1 host is 180
- When the number of Ready messages in celery queue in rabbitmq-2 host is 180
The rabbitmq trigger in the above ScaledObject uses the TriggerAuthentication referred to in authenticationRef of the trigger to authenticate with the RabbitMQ host to collect RabbitMQ metrics for the scaler.
# Secret containing RabbitMQ host connection strings for use in KEDA TriggerAuthentication. This is autogenerated by ExternalSecrets for us
---
apiVersion: v1
kind: Secret
metadata:
  name: zapier-worker-celery
data:
  rabbitmq-1: <AMQP URI connection string> # base64 encoded value of format amqp://guest:password@localhost:5672/vhost
  rabbitmq-2: <AMQP URI connection string> # base64 encoded value of format amqp://guest:password@localhost:5672/vhost
---
# KEDA TriggerAuthentications for use in KEDA’s RabbitMQ triggers in ScaledObject
apiVersion: keda.sh/v1alpha1
kind: TriggerAuthentication
metadata:
 name: worker-celery-rabbitmq-1
 namespace: zapier
spec:
 secretTargetRef:
 - key: rabbitmq-1
   name: zapier-worker-celery
   parameter: host
---
apiVersion: keda.sh/v1alpha1
kind: TriggerAuthentication
metadata:
 name: worker-celery-rabbitmq-2
 namespace: zapier
spec:
 secretTargetRef:
 - key: rabbitmq-2
   name: zapier-worker-celery
   parameter: host
---
# KEDA ScaledObject to define how to scale a deployment
apiVersion: keda.sh/v1alpha1
kind: ScaledObject
metadata:
 finalizers:
 - finalizer.keda.sh
 name: zapier-worker-celery
 namespace: zapier
spec:
 cooldownPeriod: 300
 maxReplicaCount: 10
 minReplicaCount: 3
 pollingInterval: 15
 scaleTargetRef:
   name: zapier-worker-celery # Name of target deployment to scale
 triggers:
 # CPU trigger
 - metadata:
     type: Utilization
     value: "82"
   type: cpu
 # RabbitMQ trigger for “celery” queue length on rabbitmq-1 host
 - authenticationRef:
     name: worker-celery-rabbitmq-1
   metadata:
     metricName: celery-rabbitmq-1-worker-celery
     mode: QueueLength
     protocol: amqp
     queueName: celery
     value: "180"
   type: rabbitmq
 # RabbitMQ trigger for “celery” queue length on rabbitmq-2 host
 - authenticationRef:
     name: worker-celery-rabbitmq-2
   metadata:
     metricName: celery-rabbitmq-2-worker-celery
     mode: QueueLength
     protocol: amqp
     queueName: celery
     value: "180"
   type: rabbitmq
—
Monitoring & Alerts
At Zapier, we use Grafana to visualize metrics from Thanos (highly available Prometheus setup with long-term storage capabilities). To make sure our system is performing as expected, we use custom Prometheus rules to alert when things are going wrong.
To achieve this, we are relying on built-in metrics provided by KEDA that allow us to define the following rules (as seen in the above helm values files):
- KedaMetricsServerDown: Raised when keda-operator-metrics-server is down for 1m
- KedaScalerErrorsHigh: Raised when rate of keda_metrics_adapter_scaler_errors_total > 0 for 1m
- KedaScaledObjectErrorsHigh: Raised when rate of keda_metrics_adapter_scaled_object_errors > 0 for 1m
We are also using them for our monitoring by tracking the following metrics
- up{job=”keda-operator-metrics-apiserver”}: This tells if the KEDA service is up and running
- keda_metrics_adapter_scaled_object_errors: ScaledObject errors, e.g., scaler errors, missing secrets for TriggerAuthentication, need to scale up beyond max replicas, etc.
- keda_metrics_adapter_scaler_errors_total: Total errors for all scalers in a cluster
- keda_metrics_adapter_scaler_errors: Scaler errors grouped by each trigger in a ScaledObject
- keda_metrics_adapter_scaler_metrics_value: Metric value for a KEDA scaler grouped by each trigger in a ScaledObject
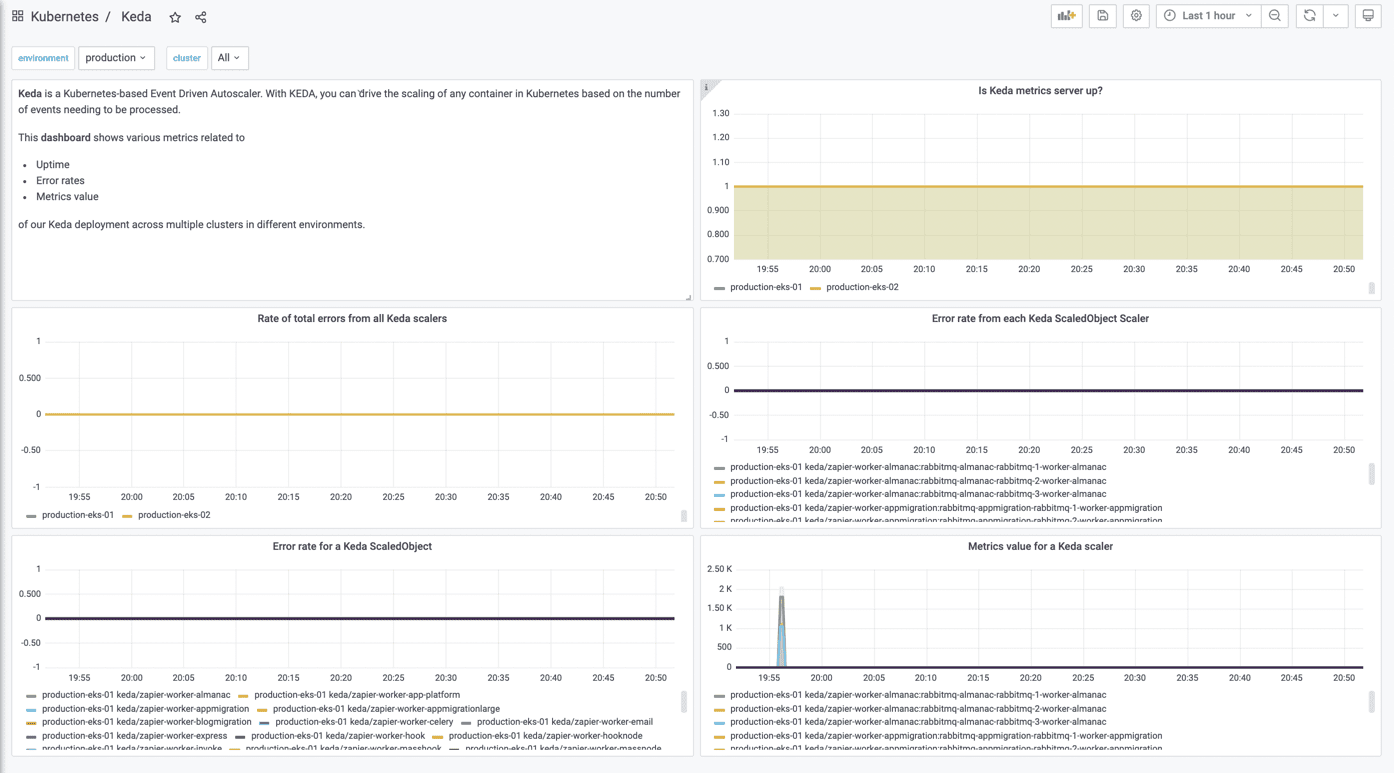
This monitoring and alerting setup have helped us to stay on top of any errors coming from KEDA controller and scalers.
Results
KEDA performed at par with Kubernetes native HPA in terms of CPU-based scaling and seamlessly auto-scaled our workers based on ready messages in RabbitMQ.
Using KEDA to autoscale our workers significantly prevented delays in our Zap processing due to blocked I/O calls. We are slowly updating apps at Zapier to use KEDA.
Conclusion
We at Zapier are delighted with how KEDA is helping us to scale our workloads. It’s simple to use, well documented and has a plethora of ready-to-use scalers.
On top of that, KEDA has a very active and helpful community of contributors. We’ve just started using KEDA but we can already see new use cases to push KEDA to the limit. We look forward to working with the KEDA community in the future.
About: Ratnadeep Debnath works as a Site Reliability Engineer at Zapier.
He’s a passionate advocate of open source technologies throughout the
organisation. He spends a lot of time tinkering with Kubernetes and
other CNCF projects and actively contributes to some of these. He
likes to spend his free time with friends and family, doing mantra
meditation, reading, and growing food.