


Guest post by Nate Matherson, Co-founder and CEO of ContainIQ
Too much monitoring and alert fatigue is a real problem for today’s engineering teams. There are plenty of open-source and third-party tools offering to cut through the noise these days. It always sounds good to be true, and it likely is. But what if I told you that one of my favorite alternatives was right in front of you and accessible from the Kubernetes API almost instantly? I am talking about the Kubernetes events feed.
Kubernetes events provide unique and clear insights into cluster health and performance. And in the days of too much data, I’ve found that Kubernetes events provide clear insight without much noise.
In this article, we will learn about Kubernetes event types, help you access and store events, and suggest some alerts that most teams, small and large, will find helpful.
What Is A Kubernetes Event? Types and Examples
A Kubernetes event is an object that shows what’s happening inside a cluster, node, pod, or container. These objects are usually generated in response to changes that occur inside your K8s system. The Kubernetes API Server enables all core components to create these events. Generally, each event is accompanied by a log message as well. However, both of these are very different and do not affect each other in any other way.
One important thing to note about Kubernetes events is that they are deleted by default after some time, usually under an hour. Therefore you must watch for and collect important events as they happen.
To access Kubernetes events, you can run the following command:
| kubectl get event |
Here’s how the results would look like:
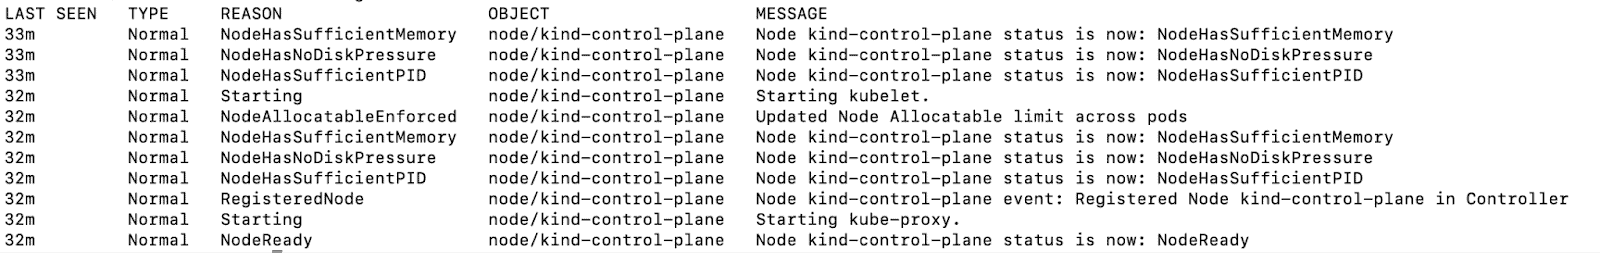
Events for a freshly started node
As you can see, many Kubernetes events are caused by a change of status in a node. There is a Reason field attached to each event. You can use this field to determine the type of the K8s event object. Here are some standard classifications based on event reasons.
Failed Events
Failed events are generated when K8s fails to create a container or other resource. This could happen due to faulty images, typing mistakes, insufficient reasons, and many different reasons. There’s an almost certain chance that failed events will lead to broken functionalities in your app; hence monitoring for these types of events is essential.
FailedToCreateContainer, FailedToStartContainer, FailedToPullImage, FailedToKillPod, etc. are some examples of failed events.
Evicted Events
Evicted events occur quite commonly since K8s often steps in and evicts rogue containers and pods (those consuming large amounts of resources unnecessarily). While this is expected behavior, you still need to look out for the occurrence of these events. A high number of evictions indicates that you have not placed proper thresholds in your system. More often than not, K8s might not be able to identify the best entities to evict, resulting in irrelevant evictions leading to loss of uptime.
Node-Specific Events
Many K8s events are based around nodes and their life cycle activities. You might have already noticed NodeHasSufficientMemory, NoteHasSufficientPID, NodeReady, and other events in the example from above. These convey status changes related to nodes and come in handy when looking for the source of the system’s erratic behavior.
Storage-Specific Events
All cloud-based apps utilize storage in one way or another. K8s mainly connects to external services like AWS, GCP, or internal resources from Docker for storage. There can be instances where a pod might fail to mount storage resources. You should look out for FailedMount and FailedAttachVolume events to identify cases of faulty storage mounting.
Scheduling Events
Scheduling events provide insights into the efficiency of your resource management strategy. If you do not manage your resources well, there might not be any left to allocate to new pods. Insufficient memory or CPU is usually the culprit, and you would receive a FailedScheduling event in most cases with a clear description of why the scheduling could not happen.
Accessing Kubernetes Events
To access Kubernetes events, you can run the following command for a pod:
| kubectl describe <podname> |
Or, if you want to view a larger collection of events based on their types or any other field, you could run this command:
| kubectl get events –field-selector type!=Normal |
While these commands provide you with the most recent events on the command line, they will not be helpful for large-scale deployments where you need historical data analysis. You can use the following command to export the events data from the Kubernetes API for detailed analysis:
| kubectl get events -o json |
This will export the latest events into a JSON file that you can import into your favorite visualization tool to gain more insights.
How To Collect And Store Events
The last method discussed above is one of the most primitive ways of exporting events from Kubernetes. There are various other techniques that you can use to collect and store events safely. Here are a few of the most common ones.
Watch And Export Events Natively
Kubectl provides another handy command for watching events as they occur in the system:
| kubectl get events –watch |
This will start streaming events to your terminal. Again, this is not quite useful for analysis and visualization. So you should consider coupling it with a third-party logging operator like Banzai Cloud’s for analysis.
KubeWatch
KubeWatch is a great open-source tool for watching and streaming K8s events to third-party tools and webhooks. You can configure it to send messages in Slack channels for important status changes. You can also use it to send events to analytics and alerting tools like Prometheus.
You can install KubeWatch through your favorite Kubernetes tools like kubectl or helm. Here’s a quick snapshot of how Slack notifications from KubeWatch look like:
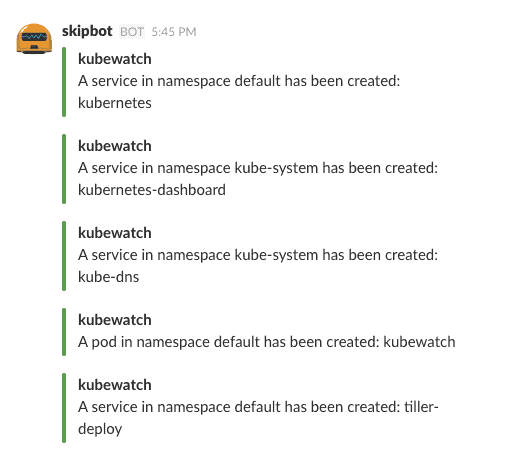
KubeWatch Slack Notifications (Source: KubeWatch)
KubeWatch offers a straightforward setup process but does not provide independent storage or management capabilities. Also, you do not get any metrics or logging abilities.
Events Exporter
The Kubernetes Events Exporter is an excellent alternative to the native watching methods in K8s. It allows you to monitor K8s events continuously and list them when needed. It also draws quite a handful of metrics like event counts, unique event counts, etc., from the data it gathers and provides you with a basic monitoring setup. It is pretty easy to install and can be an excellent alternative to try out before settling down with a more comprehensive tool.
EventRouter
EventRouter is another great open-source tool for collecting Kubernetes events. It is effortless to set up and aims to stream Kubernetes events to multiple sources or sinks as they are referred to in its documentation. However, just like KubeWatch, it also does not offer querying or persistence features. You need to connect it with a third-party storage and analysis tool for a full-fledged experience.
Once you understand your monitoring goals and formulate a strategy, you can consider moving to a dedicated, paid K8s events monitoring service. You get powerful querying capabilities and alerting across a wide range of platforms.
Alerting On Common Warning Events
Watching K8s events in real-time is crucial to staying in the know of what’s happening in your system. However, you also need to set up a robust alerting strategy to notify you in case of anomalies or emergencies.
As a rule of thumb, you should keep a close eye on Failed and Scheduling Events, as ignoring these can break functionality in your apps. You can set evicted events on low priority since they are often generated due to routine cleanups by K8s. Node-specific and Storage-specific events have to be picked manually for alerting (while NodeReady is a good event to know, you don’t need to send out an alert for it every time).
Most tools allow for sending alerts via webhooks or common collaboration platforms like Slack. While this is simple and easy to set up, you can take it a step further by connecting your monitoring tool to a more advanced alerting platform. AlertManager in Prometheus is a good alternative too. You can also consider using a SaaS based solution, like ContainIQ, which has dedicated interfaces for creating alert conditions, sending them across a wide range of platforms, and the ability to correlate events to other metrics.
Final Thoughts
Kubernetes events are a great way to monitor the health and activity of your K8s clusters. However, they become more powerful when coupled with practical strategies and extensive toolsets. This guide helped you understand the significance of Kubernetes events and how you can draw the most value out of them.