Guest post originally published on Snapt’s blog by Iwan Price-Evans
In this data-driven world, we capture data for just about everything in our software and hardware. User data, user behaviors, events, data flows, and the inner workings of our servers, virtual machines (VMs), and containers are all recorded. Applications expose ever more data to DevOps and IT teams, to help them make good decisions. However, all of this data is meaningless if users cannot access the data easily, make sense of it, and act on it. This is where observability comes in.
Observability is not an inevitable result of having lots of data. Neither is it merely a feature of an application user interface (UI) populated by graphs and timelines. Observability is a state of being – a state of situational and historical awareness, confidence in planning and action, and transparency in success and failure. Applications, architectures, and processes can enable observability or they can get in the way.
An application delivery pipeline that impedes observability will suffer security risks, unfixed errors, unsolvable customer complaints, challenges in scaling, and more. Teams managing applications like websites, ecommerce stores, financial services, or internal enterprise tools will struggle to respond to disruptive events, to plan ahead, or to know for sure whether or not plans have been implemented successfully.
When it comes to managing a complex distributed software system like many of today’s largest companies do, observability is incredibly important. As the number of locations, platforms, and human operators goes up, so does the volume, complexity, and diversity of the data produced and recorded. This compounds the risks of functioning without comprehensive observability, with both the likelihood and impact of errors increasing dramatically.
So how can DevOps and IT teams build observability into their application delivery pipelines?
Telemetry
The starting point for achieving observability for distributed systems such as container-based microservices deployments and load balancers is telemetry.
You should expect to aggregate telemetry data from four major categories. Below is how Snapt makes use of these categories to equip your business with the observability it needs.
- Metrics: A numerical representation of data measured over a time interval. Examples might include queue depth, how much memory is being used, how many requests per second are being handled by a given service, active connections or flows, the number of errors per second, latency, health status of nodes, etc. Metrics are particularly useful for reporting the overall health of a system, and also naturally lend themselves to triggering alerts and visual representations such as gauges, but offer greater insight into how your systems are used across a global audience.
- Events: An immutable, time-stamped record of events over time. These are typically emitted from the application in response to an event in the code. Having detailed information about specific events, allows teams (and Snapt’s intelligent AI systems) to better respond and mitigate specific events while as a business, you can also better prepare for and predict these events in future.
- Logs: In their most fundamental form, logs are essentially just lines of text that a system produces when certain code blocks get executed. Logs prove valuable when retroactively verifying and interrogating code execution. In fact, logs are incredibly valuable for troubleshooting databases, caches, load balancers, or older proprietary systems that aren’t friendly to in-process instrumentation, to name a few. Our observability tools help to make sense of all this by highlighting the information you need, while also showcasing what information is perhaps wasteful and not necessary, reducing this unneeded noise from your servers, which should improve operational performance and make the life of your engineering teams far easier.
- Traces: Traces show the activity for a single request as it “hops” through a chain or web of services. A trace should show the path of the request through the system, the latency of the components along that path, and which component is causing a bottleneck or failure. These traces are vital to troubleshooting issues and designing better systems that can prevent these sorts of issues from occurring in the future.
Unification In Hybrid Environments
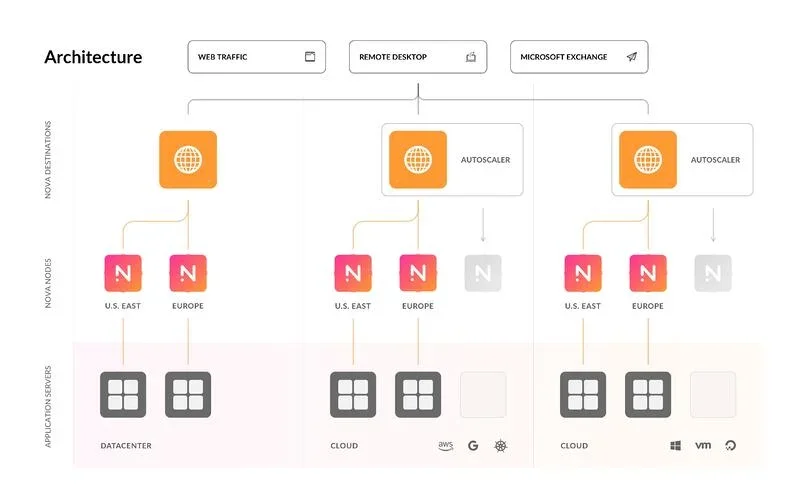
Telemetry data – and traces in particular – can prove tricky for many organizations to gather and collate. One of the main challenges is that a single organization might operate a hybrid environment encompassing many different locations, server types, clouds, platforms, and more, which might have been set up by different teams following different procedures. The resulting data comes on many channels and in many different formats and structures. This volume and complexity can be more than human operators can manage.
Unless DevOps and IT teams get control of all this data, observability will be out of reach. To address this challenge, these teams need an application delivery solution that works with any combination of location, servers, clouds, VMs, containers, traffic protocols, and applications. Such a solution must be able to connect to every node simultaneously, navigate the differences in architecture and data structure, and bring it all together in one data repository and one UI.
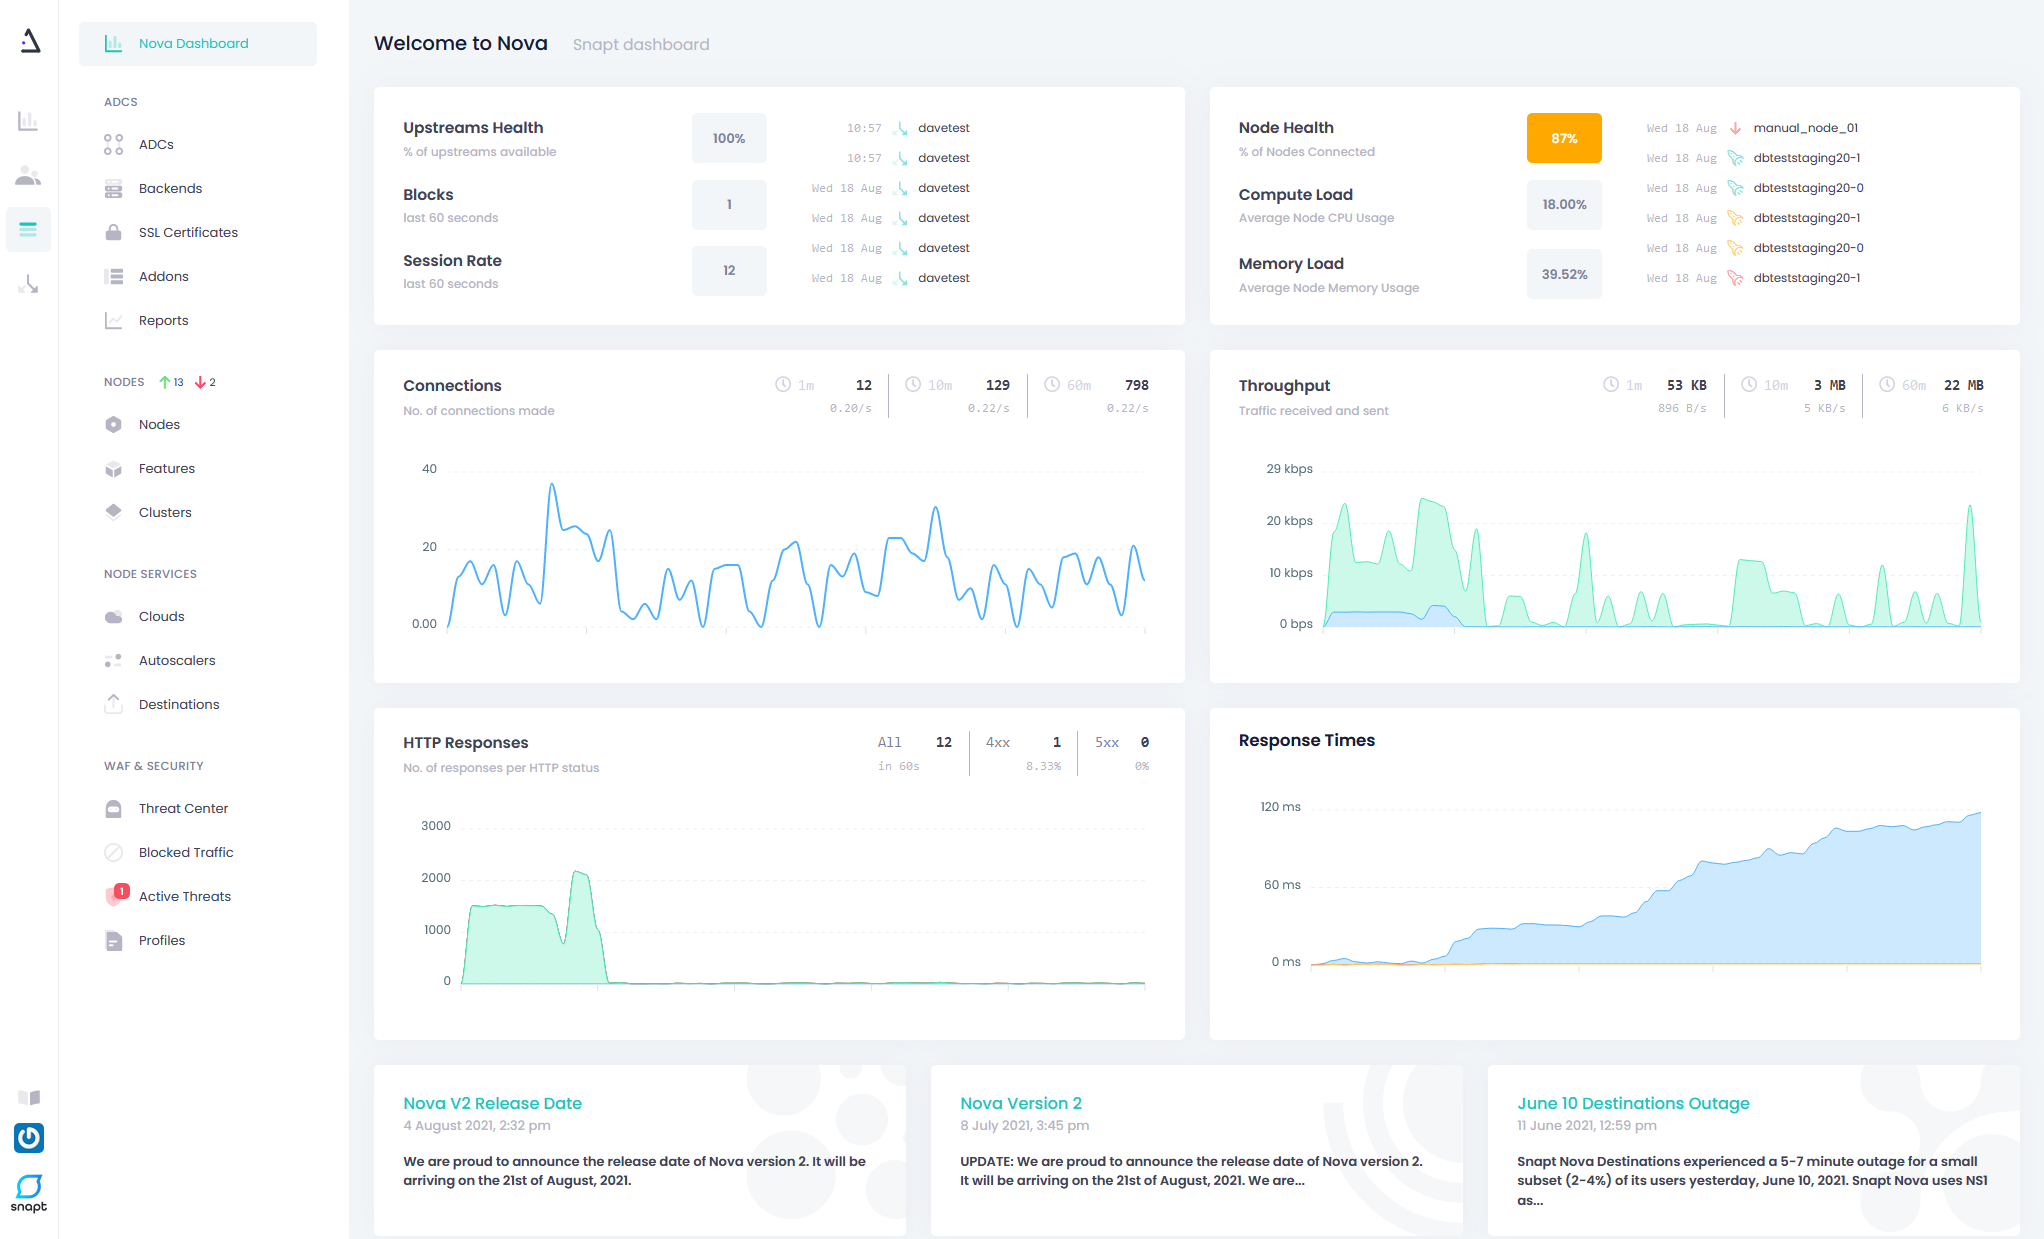
For example, Snapt Nova is designed to work this way, providing ADC-as-a-service dynamically into any number of network nodes in any combination of backends, collecting telemetry data from all of them. As a result, Nova produces end-to-end telemetry across complex hybrid environments.
Intent-Based Monitoring and Dashboarding
Monitoring is a big buzzword in software development and DevOps, and for good reason. The ability of teams to monitor their systems’ telemetry is vital to ensuring system availability and also to learning about usage patterns and real-world performance. However, while monitoring itself is a component of observability, observability requires more than just reading streams of data and acting on them.
An “observable” deployment is one where telemetry data is displayed in an intelligent way, so as to show the right data at the right time (when it matters most), and so that key stakeholders can understand what the data means for them.
For example, a monitoring-only solution might present logs, traces, and events for the purpose of health checking and troubleshooting a system. The operator responsible would need to check all of this data, identify problems, and figure out how to fix them.
By contrast, an observability solution might also provide highly granular intent-driven insights into the behavior of systems, alerts when a problem is detected (or predicted by a machine learning algorithm), along with rich contextual information and recommended actions, perfect for debugging purposes.
It’s not possible to predict every possible way in which a system could misbehave or fail, so we should build systems that can be debugged with evidence and not conjecture.
Observability also provides more structured dashboarding that caters to different audiences. Whereas monitoring is aimed at technical users in ITOps and DevOps teams, observability provides information relevant to a wider range of technical and commercial audiences, based on their needs.
For example, reporting on server latency helps technical teams to keep servers responding quickly to traffic, while reporting on the number of users that abandoned their shopping carts when latency was high helps commercial teams to assess the impact of technical issues on revenue and to prioritize resources to address those issues.
This adds more value to the decision-making process across an entire organization.
Real-World Testing With Technical and Commercial Stakeholders
An “observable” deployment is one that is observable in practice and not only in theory. Here are some key tests for your observability.
- Are your technical teams able to demonstrate that they meet defined service level agreements (SLAs)? For example:
- Time to detect business-critical problems.
- Time to fix business-critical and customer-facing problems.
- Uptime and performance, eg. latency on API integrations.
- How many user interfaces does each stakeholder need to look at to answer the questions they are responsible for? How long does it take?
- Do your commercial teams know how sales and marketing KPIs were affected by technical factors within a defined period?
- How many of your teams’ decisions for the next quarter are based on trustworthy data and how many are based on incomplete, out-of-date, or unreliable data?
Check out how Snapt Nova can improve your organization’s observability.